Organizational, Social and Individual Aspect on Acceptance of Computerized Audit in Financial Audit Work

Adv. Sci. Technol. Eng. Syst. J. 5(3), 55–61 (2020);
 DOI: 10.25046/aj050308
Auditors now can no longer rely on the old-fashioned way of auditing manually. More and more jobs, increasingly complex work environment, the demands of the times, accuracy and speed of work require auditors inevitably must adopt technology. This research began with our success as academics in the audit family. Related to Indonesia, a large country and has several hundred public accounting firms and thousands of auditors, but computerized use of audits using software is still very little. The public accounting firm still uses a manual system, using normally typed paperwork. We want to find out what can boost the use of software among auditors. Our results are useful for auditors in Indonesia. From the results of statistical tests we found that auditors use compilation software by individual auditors themselves rather than organizations and individuals
1. Introduction
This paper is an extension of work originally presented in 2019 International Conference on Information Management and Technology (ICIMTech) [1]. The development of the information system used by the client has an impact on the expertise that must be mastered by the auditor who was originally approached manually, so with these changes the auditor is required to master the information system process used by the client and computerized audit technique for adjusting the audit process and the procedures used when carrying out field work such as changes in the manual accounting system environment into a computer-based accounting information system causes the auditor to study a system. Purpose auditing for carried out effectively and efficiently, the auditor should adjust his audit techniques to the client’s information system [2].
General Audit Software or commonly abbreviated as GAS is an auditing with computer technique, or better known as Computer Assisted Audit Techniques. In Western countries, this GAS has been widely applied by audit companies. [3] Revealed that “Adoption of General Audit Software (GAS) can improve audit quality, and this is the reason why its use is applied by US Auditing Standards”.
In terms of regulation (environment), the Indonesian Audit Standards suggest GAS in conducting works [4], but its use is not mandated / charged. Therefore, the use of technology in audit companies in Indonesia is not fully regulated. One of the Public Accounting Firm’s Big Four states they use Generalized Audit Software because they have the software and own the resources.
In terms technology, information technology proficiency including English as foreign language is very influential for public accounting firms medium and small. In terms of technological skills, the Big Four is not in doubt. Obviously, become problem in domain of public accounting firms that smaller. On the contrary, is nor serious problem; the elite office believe language matters won’t hamper their work, it used in operation every day. In addition, auditors must understand compatible software that is compatible to check/audit clients for accuracy in testing data integrity.
Associate terms of audit companies (organizations), IT Capital Budget is very influential on the implementation of General Audit Software. Big companies tend having customized audit tools, while medium and small audit companies usually rely on commercially available and cheaper software. Besides that, the IT skills of auditors in the company are also very influential.
On the other hand, the attitudes and intentions of auditors are also very influential in adopting General Audit Software (GAS). One senior auditor from the intermediate audit commented “Software is to help auditor work, nor to make it more complicated”. Difficult to operate software make hamper usage. As a result, the auditor will need even more effort to be able to use it. Interestingly, the intermediate audit office found young employee pay more interest in Generalized Audit Software (GAS) [5]. These premises also supported by research conducted by [6] which resulted that people willing to adopt, when it simplify audit process times and do their jobs more efficiently. Auditors who are young and have IT insights will usually be more interested if given the opportunity to enhance their skills.
2. Theoretical Framework and Hypothesis
2.1. Technology Acceptance Model
The Technology Acceptance Model (TAM) developed by [7] a successful and highly acceptable model for predicting willingness to adopt current information approach. Until now this theory was a pioneer and the foremost in uncovering the reasons people want to change to keep abreast of technological developments. Many studies have re-examined, expanded, and used TAM.
The TAM model originated from theory of reason action [8], that is grounded from study of reaction perception for something, effect on person’s will and behavior. Reaction and perception affect in acceptance of technology. One factor that can influence is the user’s will, so that the reason someone sees the actions / behavior as a benchmark in the acceptance of a technology. The TAM model that is grounded with a premise reaction or perception for something which outcome in result behavior. Reaction and perception affect in acceptance of technology. One factor that can influence it is the user’s will his or herself.
According to [9] people willing to leave old method and change to new modern one, because they think it was useful and easy. Both of these components when associated with TRA are part of belief.
Basically it will be very strong if someone already has a perception, perception will be a suggestion, it will make someone want to do it [10]. The main perception here is the perception of usefulness, namely that this technology is very useful. But in addition to usability, it must also be supported by perceptions of ease, because we find many useful but difficult, it will also be left by people. Based on this premises and previous study by [11], [12] we formulated our premise as follows:
Hypothesis 1: PU has positive influence on System Usage (SU).
Hypothesis 2: PEU has positive influence on System Usage (SU).
Hypothesis3: PEU has positive influence on Perceived Usefulness (PU).
2.2. Auditing Software
CAATs according to [13] software designed to enable auditors with less sophisticated computer skills to carry out audits related to data processing functions. These packages can carry out certain analytical calculations, thus detect anomalies. Audit software is also interpreted as a computer program that allows automatic decision. Conventional tools such as system use programs, information reappearance programs, or high-level programming languages can be used for this audit. Real data processing goes through an audit program. Outputs are simulated and compared with regular outputs for monitoring purposes. Parallel simulation, redundant processing of all input data by conducting a separate program test, allows comprehensive and very precise validation to be carried out on important transactions that require 100% audit [14]. The audit program used in parallel simulations is usually a type of general audit program that processes data and produces output that is identical to the program being audited. Audit software is one of the software that adapted in educational work, along with other software used in college/university [15].
2.3. Social, Individual, and Organizational
Reflecting on the preliminary research, we find that there are recognizable 3 factors that are triggers for the perception of ease and perception of use. these three factors are individual, social and organizational [16]. The organization in our research context is the office where the auditor works. The policies taken by partners, which are the highest leaders in the public accounting firm, determine whether software is used or not. In accordance with [16] organization impact both Perceived Usefulness, Perceived Ease of Use (PEU).
The second factor to be investigated is social. Socials in our study are peers or peers of the auditor. When working of course the auditor works in a team, where in the team consists of several people. This is where social interactions were influenced [16]. [11] said people tend to be the same and not too different from their peers or social community. If one uses software easily, the others don’t want to be left behind to use it. this opinion is reinforced by the results of the study [17], [18].
The third factor is individual. These factors originated from within the auditor himself. Where they have their own intentions, have their own perceptions before being influenced by the surrounding environment [16]. Individual factors are suspected to have strong potential, because it involves beliefs from within [13], Based on this premises, we form these several hypotheses related to the social, individual and organizational factors to PU and PEU.
H4: Organizational factor has positive influence on Perceived Usefulness
H5: Social factor has positive influence on Perceived Usefulness
H6: Individual factor has positive influence on Perceived Usefulness
H7: Organizational factor has positive influence on PEU
H8: Social factor has positive influence on PEU
H9: Individual factor has positive influence on PEU
3. Research Methodology
Our research was an associative research using path analysis test. We use a total of six factors. The six variables contain three independents, namely: individual, social, organizational, also two intervening variables namely perceived usefulness and perceived ease of use and one dependent variable, namely system usage. Hypothesis testing performed using statistical software. Hypothesis testing is done after the precondition namely validity and reliability.
3.1. Population and Samples
Respondents in our study were people who worked as independent auditors or financial auditors in public accounting firms. We do not limit the accounting firm, whether the big four, ten or others. The population size is difficult to know, because the number of auditors is very large and changing, based on the approach taken by Chassan [19]. it was concluded that the respondents were at least 30, so we decided to use 100 respondents similar like [20]. .
3.2. Measurements of Factors
Factors used within our research are adjectives, which are basically abstract. For this reason, in order to be concrete and can be explored with certainty, then we made the operation of variables to make measurements. Variable measurements are made to make abstract variables (derived from adjectives) more tangible and can be calculated quantitatively. Variable measurement is based on preliminary research and grand theory. Here in table 1 presented the operation of variables.
Table 1: Table Operation of Variables
| Operation of Variables | ||
| Variable | Main indicator | Source |
| Organizational Factor (X1) | 1. Support
2. Training 3. Management Support |
[21] |
| Social Factor (X2) | 1. Internalization
2. Image |
[21] |
| Individual Factor (X3) | 1. Job relevance
2. Output quality 3. Result demonstration |
[21] |
| Perceived Usefulness (Z1) | 1. Improve job performance
2. Useful |
[9] |
| Perceived Ease of Use (Z2) | 1. Easy to Understand
2. Easy to Use |
[9] |
| System Usage (Y) | 1. Frequency of Use
2. Use anytime |
[9] |
4. Research Result
We use path analysis to examine whether there is influence and how strong is the influence between variables in our study. However, before we conduct hypothesis testing, the data must first be tested for validity, reliability and classic assumptions. This is done to ensure that the data is valid, reliable and worth testing.
4.1. Reliability and Validity Testing
A variable is said to be reliable when the Cronbach alpha value is above 0.7 [22], reliable means that even if tested over and over again, the results will remain consistent.
Table 2: Cronbach’s Alpha
| No. | Variable | Reliability indicator |
| List of variables | Cronbach’s Alpha | |
| 1. | X1 Organizational factor | 0.950 |
| 2. | X2 Social factor | 0.830 |
| 3. | X3 Individual factor | 0.879 |
| 4. | Z1 Perceived usefullness | 0.820 |
| 5. | Z2 Perceived ease of use | 0.861 |
| 6. | Y System Usage | 0.947 |
Different from reliability, validity is intended to know whether if a question is asked to many parties then the answer remains the same. Validity can be seen from the r count greater than r table.
Table 3: Validity Testing
| Variable | Variable | ||||
| Indicator | r count | r table | Indicator | r count | r table |
| OF | PU | ||||
| OF1 | 0.842 | 0.195 | PU1 | 0.697 | 0.195 |
| OF2 | 0.932 | 0.195 | PU2 | 0.697 | 0.195 |
| OF3 | 0.917 | 0.195 | PEU | ||
| SF | PEU1 | 0.756 | 0.195 | ||
| SF1 | 0.712 | 0.195 | PEU2 | 0.756 | 0.195 |
| SF2 | 0.712 | 0.195 | SU | ||
| IF | SU1 | 0.900 | 0.195 | ||
| IF1 | 0.697 | 0.195 | SU2 | 0.900 | 0.195 |
| IF2 | 0.862 | 0.195 | |||
| IF3 | 0.751 | 0.195 | |||
4.2. Classical Assumption
This must be performed as a data quality test in testing the linear regression model. Quality multiple regression analysis in this study are free from deviations of assumptions. The classical assumption test, there are several tests including normality, multicollinearity, heteroscedasticity, and autocorrelation.
4.2.1. Normality Test
In this study normality testing is performed using graph analysis and statistical analysis.
The statistical test used in the study is Kolmogorov-Smirnov (K-S) non-parametric statistical test. Data requirements are normal if the probability or p> 0.05 in the Kolmogorov-Smirnov normality test. Kolmogorov-smirnov test value > 0.05 means that the data is normally distributed [22]. If the Kolmogorov-Smirnov test value <0.05 then the data is not normally distributed. In Table 4 the K-S test value is 0.200 which means it is greater than 0.05, which means that the data are normally distributed.
Table 4: Normality Test
| Unstandardized Residual | ||
| N | 100 | |
| Normal Parametersab | Mean | .0000000 |
| Std. Deviation | 1.95132147 | |
| Most extreme differences | Absolute | .088 |
| Positive | .088 | |
| Negative | -.082 | |
| Test Statistic | .088 | |
| Asymp. Sig. (2 tailed) | .200c | |
The criteria used in chart analysis are, if the data spreads around a diagonal line and follows the direction of the diagonal line or the histogram graph shows a normal distribution pattern, then the regression model meets the normality assumption.
Based on Figure 1 it can be concluded that the data is spread around the diagonal line, so it can be concluded that the regression model meets the normality assumption
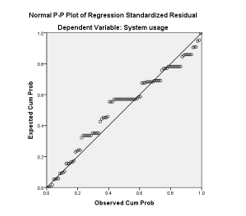
Figure 1: Graphic Normality
4.2.2. Multicollinearity Test
Multicollinearity test aims to test whether the regression model found a correlation between independent variables. A good regression model should not accept a correlation between independent variables. To find out the presence / absence of multicollinearity is to use Variance Inflation Factor (VIF) and tolerance. A low tolerance value is the same as a high VIF value (because VIF = 1 / Tolerance). If the tolerance value ≤ 0.10 or VIF value ≥ 10, it means that there is multicollinearity, while the tolerance value ≥ 0.10 or VIF value ≤ 10, it means there is no multicollinearity.
Based on Table 5, the tolerance values for the OF, SF, and IF variables are 0.597, 0.338 and 0.486, also for the PU and PEU variables, each at 0.532, which is greater than 0.100. In addition, the VIF values of the OF, SF, and IF variables of 1,674, 2,956 and 2,059, also for the PU and PEU variables, respectively 1,880, which are all smaller than 10. Based on these results, we can conclude that the research data free from multicollinearity
Table 5: Multicollinearity Test
| Model | Collinearity Statistics | ||
| Tolerance | VIF | ||
| 1. | (Constant) | ||
| PU | .532 | 1.880 | |
| PEU | .532 | 1.880 | |
| Organizational | .597 | 1.674 | |
| Social | .338 | 2.956 | |
| Individual | .486 | 2.059 | |
4.2.3. Heteroscedasticity Test
Heteroscedasticity test aims to determine whether in the residual regression model there is an imbalance of variance from one observation to another. If the variance from one observation to another is the same, it can be called homoscedasticity and if it is different it can be called heteroscedasticity. Testing heteroscedasticity in this study is using statistical tests and plot graph tests.
The statistics used in this study to determine the presence or absence of heteroscedasticity is the Goldfeld-Quandt Test. The testing steps are as follows:
- Sort the independent variable X from the smallest largest
- Then make two separate regressions, first for the smallest X value. Second for large X values and omit some data in the middle.
- Make the ratio of RSS (Residual Sum of Square = error sum if square) from the second regression to the first regression (RSS2 / RSS1) to get the calculated F value.
- Perform the F test using degrees of freedom of (n-d-2k) / 2, where
n = number of observations,
d = the amount of data or observation values lost
k = estimated number of parameters.
F test criteria if:
F arithmetic > F table, then there is heteroskedasticity
F arithmetic < F table, then there is no heteroskedaticity
Results of group I regression with RSS1 = 381.974. The results of group II regression with RSS2 = 814.614. F-stat = RSS2 / RSS1 = 814.614 / 381.974 = 2.132. F-table is 4.85. It can be concluded that F-statistic < F-table it means that no heteroscedasticity
Heteroscedasticity test plot graph to detect the presence or absence of heteroscedasticity by looking at the plot graph, if there are certain patterns such as points that form certain patterns and orderly, then heteroscedasticity has occurred. If the pattern image spreads above and below the number 0 on the Y axis indicates the absence of heteroscedasticity.
Figure 2 illustrates the spread of scattered data so that it can be concluded that the data in this study is free from heteroscedasticity.
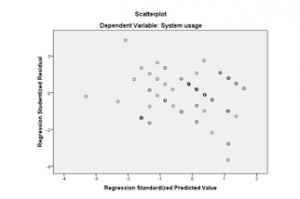
Figure 2: Graphic Heteroscedasticity
4.2.4. Autocorrelation Test
Autocorrelation test was performed using Durbin Watson. If the Durbin Watson value ranges between the upper limit values (dU), then an autocorrelation violation is not expected. The following is a table of autocorrelation test results:
Table 6: Autocorrelation Test
| dL | dU | 4-dU | 4-dL | DW |
| 1.61 | 1.74 | 2.26 | 2.39 | 1.740 |
Based on Table 6 it is known that the Durbin Watson (DW) value is 1,740. In the table, we see DW to obtain dL value of 1.61 and dU of 1.74. So, that in the regression equation, the DW value is in the dU <d <4-dU region. Then H0 is accepted meaning that the DW value is in the criteria of no autocorrelation. Thus, the assumptions on autocorrelation in the regression equation model have been fulfilled.
We also used Breusch-Godfrey or often called the LM test. In order to detect the presence of autocorrelation, the following are things that can be done:
- Pay attention to the t-statistic value, R2, F test, and Durbin Watson (DW) statistics.
- Perform LM test (Breusch Godfrey method). This method is based on the values of F and Obs*R-squared, where if the probability value of Obs*R-squared exceeds the level of confidence, then H0 is accepted. This means that there is no autocorrelation problem.
Testing the autocorrelation hypothesis:
- H0: autocorrelation does not occur
- Ha: autocorrelation occurs
- If the p-value Obs*R-square < α, H0 is rejected.
Following are the results of autocorrelation testing with the Breusch-Godfrey test:
Table 7: Breusch Godfrey Test
| F-Statistic | 0.316 | Probability | 0.726 |
| Obs*R-Squared | 0.835 | Probability | 0.657 |
Based on the results of calculations using the Breusch-Godfrey test, Obtained probability value Obs*R-square is equal to 0.657. This matter means probability > α = 0.01, then the conclusion is the level of confidence 99% of the regression models are free from autocorrelation problems.
4.3. Hypothesis Testing
The data has passed the prerequisite test, which means it is time to test the initial assumption / hypothesis. The test is presented in Tables 8 and 9. If the p-value is significant below 0.05 we find that the variable has a significant effect. After having an effect, we also see whether the effect is positive or negative. The direction is seen from the value of the beta coefficient, whether positive or negative. If positive means positive and vice versa. When referring to tables 8 and 9 we can conclude that hypotheses 1, 2 and 3 are all accepted, have a significant effect and are in a positive direction, this result supported previous result in preliminary study by [23].
Table 8: Hypothesis Testing 1
| No. | Variable | Unstandardized B | t | Sig. |
| 1. | PU | -0.319 | 3.439 | 0.001 |
| 2. | PEU | 0.977 | 10.458 | 0.000 |
| Dependent Variable: SU | ||||
Table 9: Hypothesis Testing 2
| No. | Variable | Unstandardized B | t | Sig. |
| 1. | PEU | 0.689 | 9.285 | 0.000 |
| Dependent Variable: PU | ||||
H4 can’t be accepted and H5 and H6 can’t be rejected, this resulted in line with [24], in other word not supported [16] and [25].
Table 10: Hypothesis Testing 3
| No | Variable | Unstandardized B | t | Sig. |
| 1. | OF | 0.009 | 0.135 | 0.893 |
| 2. | SF | 0.297 | 2.074 | 0.041 |
| 3. | IF | 0.573 | 7.219 | 0.000 |
| Dependent Variable: PU | ||||
While H7 is can’ be accepted, H8 also can’t be accepted and H9 positively influenced. We have result that support [26],[25], [27].
Table 11: Hypothesis Testing 4
| No. | Variable | Unstandardized B | t | Sig. |
| 1. | OF | 0.065 | 0.830 | 0.408 |
| 2. | SF | -0.106 | -0.599 | 0.551 |
| 3. | IF | 0.235 | 2.398 | 0.018 |
| Dependent Variable: PEU | ||||
The research path coefficient is presented below.
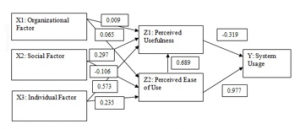
Figure 3: Research Path Analysis
5. Conclusion and Suggestion
After getting the test results statistically, we followed up. The follow up that we do is to conduct interviews and observations of respondents. Our results have found that audit judgment expectancy and expectancy incentives can influence auditors’ interest in using GAS. This is because the auditor’s performance will increase, when performance increases, then incentives such as salary increases, benefits, bonuses, which are material and also praise/acknowledgement, non-material recognition will accompany their careers. Defers case with age similarity influence; It is true that auditors in their daily life prefer to associate with the same age. However, this association only affects behavior outside of work obligations. For example, it only affects hobbies, games and favorites foods. Meanwhile, to use audit software, it still has to be mandatory from the lead leader.
While other results state that the availability of software and the desire to adopt influence people to actually use it. This is reasonable, because how is it possible for an auditor to use, if the software is not provided by the relevant accounting firm where he works. It is impossible for the auditor to install himself on a personal laptop and use it without the company’s approval. For the influence between intention and behavior clearly follows psychological rules, that someone who already wants, will usually continue to use.
Future studies can examine the actual process, on internal auditors and small accounting firms outside the big four and big ten. Future studies can test the extent to which the ability of the software. Future studies examine affect partners or owners can increase utilization by providing facilities and infrastructure as well as conducting training and socialization of its use.
- B. L. Handoko, Meiryani, S. Sabrina, and N. Ayuanda, “Admission of Information Technology in External Audit Profession: Impact of Organizational, Social and Individual Factors,” in Proceedings of 2019 International Conference on Information Management and Technology, ICIMTech 2019, 2019, pp. 36–41.
- N. Mahzan and A. Lymer, “Examining the adoption of computer-assisted audit tools and techniques,” Manag. Audit. J., vol. 29, no. 4, pp. 327–349, 2014.
- J. J. Schultz, J. L. Bierstaker, and E. O’Donnell, “Integrating business risk into auditor judgment about the risk of material misstatement: The influence of a strategic-systems-audit approach,” Accounting, Organ. Soc., 2010.
- S. M. Glover, M. H. Taylor, and C. Western, “Mind the Gap: Why Do Experts Have Differences of Opinion Regarding the Sufficiency of Audit Evidence Supporting Complex Fair Value Measurements” Contemp. Account. Res., 2019.
- N. K.-G. J. of and U. 2017, “’Attitudes and Perceptions Towards Incorporating Computer Assisted Audit Techniques in an Undergraduate Auditing …,” Theibfr.Com, vol. 11, no. 3, pp. 55–71, 2017.
- M. Mustapha and S. J. Lai, “Information Technology in Audit Processes: An Empirical Evidence from Malaysian Audit Firms,” Int. Rev. Manag. Mark., vol. 7, no. 2, pp. 53–59, 2017.
- F. D. Davis, “Perceived Usefulness , Perceived Ease Of Use , And User Acceptance,” MIS Q., vol. 13, no. 3, pp. 319–339, 1989.
- M. Fishbein and I. Ajzen, “Belief, Attitude, Intention and Behaviour: An Introduction to Theory and Research,” Read. MA AddisonWesley, no. August, p. 480, 1975.
- V. Venkatesh, F. D. Davis, and S. M. W. College, “Theoretical Acceptance Extension Model: Field Four Studies of the Technology Longitudinal,” vol. 46, no. 2, pp. 186–204, 2012.
- A. Rogers, “Examining Small Business Adoption of Computerized Accounting Systems Using the Technology Acceptance Model.,” Walden Diss. Dr. Stud., p. 126, 2016.
- Y. L. Chen, H. T. Chih, and C. C. Wan, “The relationship between attitude toward using and customer satisfaction with mobile application services: An empirical study from the life insurance industry,” J. Enterp. Inf. Manag., vol. 28, no. 5, pp. 680–697, 2015.
- H.-J. Kim, A. Kotb, and M. K. Eldaly, “The use of generalized audit software by Egyptian external auditors,” J. Appl. Account. Res., vol. 17, no. 4, pp. 456–478, 2016.
- R. Widuri, B. L. Handoko, and I. E. Riantono, “Perception of Accounting Student on Learning of Generalized Audit Software,” in Proceedings of 2019 International Conference on Information Management and Technology, ICIMTech 2019, 2019.
- H. J. Kim, A. Kotb, and M. K. Eldaly, “The use of generalized audit software by Egyptian external auditors: The effect of audit software features,” J. Appl. Account. Res., 2016.
- E. Symeonaki, M. Papoutsidakis, D. Tseles, and M. Sigala, “Post-Implementation Evaluation of a University Management Information System (UMIS),” in Third International Conference on Mathematics and Computers in Sciences and in Industry (MCSI), 2016, pp. 14–19.
- K. Rosli, P. H. P. Yeow, and E.-G. Siew, “Adoption of Audit Technology in Audit Firms,” Proc. 24th Australas. Conf. Inf. Syst., pp. 1–12, 2013.
- A. S. Shammari, “An Examination Factors Influencing The Intention To Use Instructional Technologies: An Extention Technlogy Acceptance Model (TAM),” Int. J. Inf. Res. Rev., vol. 04, no. 02, pp. 3637–3641, 2017.
- A. Ahmi and S. Kent, “The utilisation of generalized audit software (GAS) by external auditors,” Manag. Audit. J., vol. 28, no. 2, pp. 88–113, 2013.
- J. B. Chassan, Research Design in Clinical Psychology and Psychiatry. New York: Irvington Publishers Inc, 1979.
- J. B. Chassan, “Intensive design in medical research,” Pharmacol. Ther. Part B Gen. Syst., vol. 1, no. 1, pp. 139–148, 1975.
- H. J. Kim, A. Kotb, and M. K. Eldaly, “The use of generalized audit software by Egyptian external auditors: The effect of audit software features,” J. Appl. Account. Res., vol. 17, no. 4, pp. 456–478, 2016.
- U. Sekaran and R. Bougie, “Research Methods For Business. A Skill Builing Approch. 7th Edition,” Book, 2016.
- A. Tarhini, K. Hone, and X. Liu, “A cross-cultural examination of the impact of social, organisational and individual factors on educational technology acceptance between British and Lebanese university students,” Br. J. Educ. Technol., vol. 46, no. 4, pp. 739–755, 2015.
- M. Sharif Abbasi, A. Tarhini, M. Hassouna, and F. Shah, “Social, Organizational, Demography and Individuals’ Technology Acceptance Behaviour: a Conceptual Model,” Eur. Sci. J., vol. 11, no. 9, pp. 1857–7881, 2015.
- K. Rosli, P. Yeow, and E.-G. Siew, “Factors Influencing Audit Technology Acceptance by Audit Firms: A New I-TOE Adoption Framework,” J. Account. Audit. Res. Pract., vol. 2012, pp. 1–11, 2012.
- C. Chiu, S. Chen, and C. Chen, “An Integrated Perspective of TOE Framework and Innovation Diffusion in Broadband Mobile Applications Adoption by Enterprises,” Int. J. Manag. Econ. Soc. Sci., vol. 6, no. 1, pp. 14–39, 2017.
- R. Widuri, B. L. Handoko, and I. C. Prabowo, “Adoption of Information Technology in Public Accounting Firm,” 2019.