A Novel Hybrid Method for Segmentation and Analysis of Brain MRI for Tumor Diagnosis

Adv. Sci. Technol. Eng. Syst. J. 5(3), 16–27 (2020);
 DOI: 10.25046/aj050303
It is difficult to accurately segment brain MRI in the complex structures of brain tumors, blurred borders, and external variables such as noise. Much research in developing as well as developed countries show that the number of individuals suffering tumor of the brain has died as a result of the inaccurate diagnosis. The proposed article, a novel hybrid method improves segmentation accuracy. The proposed research includes three basic steps. In the first step, the adaptive filter based on mean and local variance is utilized for noise removal in the input images. It helps in de-noising to a different orientation and scale, creates numerous responses for all components in the medical images while preserving the edges. In the second step, the development of a hybrid method takes place. It is the combination of extended K-mean clustering and fuzzy C-mean clustering. The purpose of the research is to develop a hybrid segmentation structure of single-channel T1 MR Images for multiform benign and malignant tumors. It removes the limitation of prefixed cluster size which helps in improving the segmentation accuracy by reducing the sensitivity of the clustering parameters. In the third step, the morphological non-linear operation performed for the removal of the non-tumor part. The proposed approach is evaluated against various statistical parameters such as mean, standard deviation, entropy, correlation, homogeneity, smoothness and variance. The parameters result predicts a greater balance between the automated tumor areas extracted by radiologists with the tumor areas extracted by the proposed method. The findings show that the proposed hybrid method achieves a 98% level of segmentation accuracy.
1. Introduction
Advanced 3-D medical imaging techniques produce highly efficient and reliable images [1]. Segmentation of the medical image is the method of automatically or semi-automatically detecting boundaries within a 2D or 3D image. A significant challenge in segmenting medical images is the increased variation of medical images. First and foremost, there are significant modes of variation in human anatomy. Furthermore, a number of different modalities like X-ray, CT, MRI, Microscopy, PET, SPECT, Endoscopy and OCT are used in the processing of medical images [2]. Normal cells develop regulated in the human brain, whereas new cells replace damaged cells, tumor cells produce uncontrolled in the brain, which is not yet understood. Benign or malignant can be primary brain tumors. Brain tumors are heterogeneous and extremely variable in size, place, shape, and appearance. Automatic benign and malignant brain tumor segmentation is a difficult task. Some MR imaging artifacts also increase the complexity level in the tumor segmentation [3]. The slow growth of a benign brain tumor is certain and rarely diffuses, while its cells are not malignant. Figure 1 display below containing different types of benign MRI tumor images.
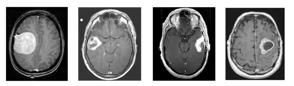
Figure 1: Brain MRI images containing different types of benign brain tumor
Figure 2 display containing different types of malignant MRI tumor images.
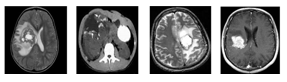
Figure 2: Brain MRI images containing different types of malignant brain tumor
The tumor, causing normal tissue damage, compression and elevated intra-crane pressures can have an effect on the brain [4]. Symptoms like headache, dizziness and visibility problems can vary by type, size, and location of the tumor in the brain.
In this paper, Image segmentation relates to pixel classification or grouping, so that each class or group represents an object that is viewed differently. Different characteristics are used for this purpose to discriminate between one item and another [5]. Texture, boundaries, edges, and color are some of the characteristics most commonly used to differentiate between different objects [6, 7]. Edge is a significant image feature, so edge detection plays an important role in the segmentation. A challenging issue for edge detection of digital medical images is noise. De-noising images is a classic yet active subject as it is an essential step in many applications. Since the pixel characteristics are discontinuous, there will be comparatively evident variations between the pixel characteristics on both sides of the edges. Therefore, the fundamental concept of the edge-based segmentation algorithm is to use some techniques to discover the limits. On one side of the corners the pixels are divided into one sub-image and on the other side, the pixels are considered to belong to another sub-image. It is sensitive to noise and generally gets incomplete data [8]. Linear filters that transform the image into a constant matrix, in the presence of additive noise, will generate the image that is blurred with the poor position of features and incomplete noise reduction [9]. A lot of research has taken into consideration and conclude that the adaptive mean and variance based filter is better than other filters for de-noising medical images.
Clustering techniques are used to distinguish groups of similar objects in a multivariate data set gathered from areas such as Biomedical and Geospatial etc.. The Fuzzy C- Mean (FCM) clustering technique applies to a broad range of data in the assessment of biomedical information. For any set of numerical information, this program produces fuzzy partitions and prototypes. These partitions are helpful to support recognized substructures or to suggest substructure in unexplored information. A generalized minimum-square objective function is the clustering criterion used to aggregate subsets [10]. Extended K-means algorithms are used to separate the area of concern from the context [11].
For the assessment of Brain Tumor, the statistical parameters are implemented. Under the average data technique, statistical and mathematical parameters such as Entropy, Standard Deviation, Mean and Variance are introduced [12]. For the number of iterations, the statistical range of each parameter is calculated. The individual statistical parameter assessment is performed with its impact on MR images of the brain tumors. Factors such as intensity, artifact presence and similarities in gray-level images are also taken into account in the segmentation process.
2. Background Study
Segmentation of the magnetic resonance images relates to the pixel clusters. Each cluster represents an object that is viewed differently. Distinct characteristics are used to discriminate between one object to another. Medical image processing is always a focal point for researchers. The challenge is to predict the accurate areas of brain tumors within the given time frame. Many studies suggested in the field of brain tumor identification have been released over the past 30 years. Research has grown exponentially over the past decade. An article was written by A. Kharrat et. al. on the brain tumor recognition using the Wavelet Transform segmentation approach to break up images of MRI. In this proposed method k-means are implemented to remove the locations or tumors that are suspect. The wavelet transformation functions called the wavelet family in equation 1. Equation 2 evaluates many wavelets, which are derived from the scaling of a solitary function called the mother wavelet [13].
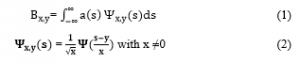
The method displays images at different levels of resolution. The wavelet test also allows the images to be compact or to de-noise without any noticeable degradation. In this study, researchers achieved 21.6272 PSNR value and 17.7768 MSAD value. R. Ratan and. al. suggested a detection method for brain tumors based on multi-parameter analyzes of MR images. Segmentation of the Watershed was implemented in this process. By deciphering a force picture’s inclination guide as a tallness appreciation, we get lines that seem to be edged by all accounts. The journey from the dividing lines to the corresponding catchment bowl would be discovered if the forms were a precipitation dropper. These lines of isolation are called watersheds. The shift in the watershed can be created on a grayscale by flooding method. It was used to detect brain tumors in 2D and 3D medical images [14]. A properly organized quick diagnostic of brain tumor technique was suggested by Qurat-Ul-Ain et al. In the first stage extraction of texture, features takes place while the second stage consists of the classification of brain pictures on the basis of texture feature using the hybrid base classifier. The extracted tumor region is categorized as malignant by using two-phase segmentation processes. The segmentation process in this technique involves stages of removal of the skull and extraction of tumors. The researchers achieved 99% classification accuracy [15]. M. U. Akram et al. suggested an automatic diagnostic system technique for MR images. In this approach, segmentation and fragmentation of the images are obtained in three phases. In the first phase, preprocessing is performed to evacuate the blurring and to sharpen the picture. In the second phase, thresholding based segmentation takes place and in the third phase, fragmented images are processed with morphology, and tumor cover is carried out to remove the falsified pixels. The authors achieved an average of 97% segmentation accuracy in the experiment [16]. S. Baurer et al. placed forward a distinctive approach in which tumor patients can select a healthy brain atlas for medical images. The simulation of tumor growth along with trained algorithms is used to equate a safe image of the brain with that of the patient’s brain. Finally, the non-stringent identification between the mutated atlas and the patient image is used to allow a better contrast. It provides flexibility in the segmentation and enhanced tumor simulation and tumor enhancement treatment of atlas-based brain tumor images. In this approach, iterations are repeated until 90% of the tumor volume achieved [17]. A multiform brain tumor segmentation proposed by J. Huo et. al. used a hybrid approach. In this approach, they adopted three different methods: the first one is fuzzy connectedness, the second one is grow cut, and last is a classification of voxel using the vector supporting machine. As a hybrid rule, a confidence map averaging (CMA) technique has been used. In order to capture the global “joining together” of the voxels, a fuzzy correctness frame (FC) assigns the target object flipped affinities during classification. A paired t-test was found to be greater than 5 in the results of the experiments. A. Tom et. al. Suggested a technique of segmentation using invariant geometric transform analysis to detect brain tumors. The authors proposed a unique algorithm which is the combination of translational, rotational and scaling. The feature vector is calculated using the combination of shape, position, and texture. After that, the calculation of the Euclidean distance between the input vector and the preciously stored vector takes place. Images with minimum Euclidean distance are considered whose result is above a certain level i.e. threshold level. Experimental results achieved 90% of segmentation accuracy [18]. R. Vijayarajan et.al. explain about the medical image segmentation using fuzzy C-mean clustering technique where averaging is done by fusion of principal components. Image fusion is a technique of transmitting all appropriate and complementary image information into a single composite image from multiple MRI from the same source or from different sources. In this method, source images are segmented by the FCM clustering algorithm into K-number of clusters and the segmented regions are sorted specifically for fusion regions. If the principal components for the k-clusters is p1i and p2i where, i is from 1 to K then the average of all the parts is assessed by equation 3 and 4 [19].
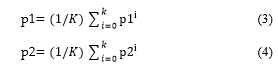
K is subjective to various image inputs. And p1 and p2 are fusion weights. The fused image is obtained by the following equation 5 :
![]()
Where, i1 and i2 are two images which are going to be fused. The average quality index is around 85% which better than the other algorithm as given in the experiments.
The distinctive local, independent transformation based segmentation and classification of CT and MRI images have been submitted by M. Huang et al. In their study, the LIC method is employed to identify the segments into separate classes. Locality plays an important part in LITC’s autonomous urban development, which solves problems. The locality is used to bind the anchor code to solve linear transformation issues instead of other coding techniques. On the basis of the actual patient results, the average dice similitude of the proposed whole tumor, tumor center, and tumor section are 0.84, 0.685 and 0.585, respectively [20]. The method was suggested by N. Dhanachandra et. al. for the solution of the problem of segmentation using the K-mean algorithm of clustering and subtractive clustering algorithm. In this approach, the enhancement in the image quality, partial stretching improvement is applied to the picture. The clustering subtractive approach is an information clustering technique. Therefore, the subtractive cluster is used in k-means algorithms for the division of the images. The median filter is then placed in the segmented image to eliminate any undesired part from the image. Experimental results showed that RMSE is 0.0017 and PSNR is 35.77 which is a good result for segmentation. The ACM segmentation and ANN-LM classification methods used in brain tumor MRI analysis were used by A. Shenbagarajan and others. The proposed image analysis of MRIs using the ACM method regionally used to segment and the ANN algorithm based on the LM to efficiently identify MRIs as normal brain and timorous brain. The proposed MRI image-based brain tumor evaluation should effectively address the segmentation process and the classification method for brain tumor evaluation using feature removal techniques so that the technique would lead to a better result of brain tumor diagnostics before use in medical areas [21]. M. Sornam and others focus on establishing an independent diagnostic tumor program using pictures of MR weighted T1 and T2. The beginning step is to separate the brain MR images into benign and malignant by filtering images and the k-mean algorithm. The textural and form-based extraction process is performed with Wavelet and Zernike methods in the intermediate step. The final step is to determine the difference entre benign and malignant tumors using the ELM (Extreme Learning Machine) algorithm. Researchers found that the proposed algorithm achieved 77% of segmentation accuracy [22]. Figure 3 depicts an example of wavelet and Zernike based segmentation results.
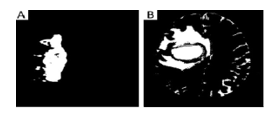
Figure 3: A – Benign, B – Malignant are the images after segmentation using k-mean [22].
In order to classify images of the MR of brain tumor, R.Ahmed et al. suggested the use of a support vector machine and ANN. For the segmentation of MRI images, the combination of tempered K-means and modified Fuzzy C-means (TKFCM) is used. TKFCM assimilates with few improvements K-means and Fuzzy C-means. A combination of Temper with K-means has identified in the brain MR images by gray level intensity. Equation 6 shall assess the gray based strength and picture complexity.
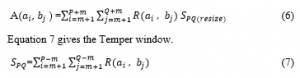
Tempe-based image matrix is given with G gray-level intensity number and B bin numbers used for image R ( ) temper detection. Where, m is defined as m= (winsize -1)/2. Application of exact temper values, rank and column is obtained by placing the desired temper.
P and Q are row and column of A ( ) and d is contour value. Cluster number, cluster center, and data point’s number are identified by G, Q, and D respectively. The proposed study evaluates the sample data with 97.37% classification accuracy [23]. X. Ma et.al. proposes a noise removal method in SAR images. In this method, shift-invariant K- means singular value decomposition (SVD) with guided filter is used. The entire technique is made up of two steps. The first stage is to deal with the noisy image, the K-SVD shift, and the original de-noisy images. In the second step, the guided filtration is performed for the initial de-noisy image. Researchers achieved an average of 31.4040 PSNR over 6 images in the given method [24]. The automated brain tumor identification technique suggested by A. Mukaram et. al. is composed of the picture and separating two principal sections. Smoothing of the image can be accomplished through the use of a median filter, followed by an image enhancement method that can be accomplished through Sobel edge detection. For the Segmentation purpose, the K-means pillar algorithm is used. Pillar K-mean algorithm involves pillar pixel selection for efficient segmentation [25]. Hanafy M. Ali presented a study on MRI images for noise removal. MRI images are usually susceptible to noise such as the Gaussian noise, salt, pepper, and spatula noise. Therefore, having a precise brain picture is an extremely severe activity. A precise brain image is very important for further diagnosis. To remove noise, a median filter algorithm is used. Input images are combined with Gaussian noise and salt and pepper noise at various levels. To solve the problem of noise reduction it will be introduced a combination of the proposed Middle filter (MF), adaptive Middle Filter (AMF) and adaptable Wiener Filter (AWF). The filters are used to eliminate the additive noise from images of the MRI [26]. S. Riaz et. al. applied a unique technique on images having large scale data. This incorporates rough Fuzzy C-mean clustering with the methodology of the neural network. The main concept is to first create an original cluster core, then update image clusters and representations jointly during preparation, using a single layer of clustering by multi-layers of CNN. Fuzzy rough C-mean (FRCM) will be used for upgrading the forward pass cluster centers, while Stochastic Gradient Decent (SGD) will be used to upgrade CNN parameters. This rough collection of low and limited approaches addresses uncertainty, vacuity, and incompleteness in the definition of clusters and fuzzy sets which make it possible to effectively manage overlapping partitions in a noisy environment. The experimental result predicts that the given method has an average of 91% clustering accuracy among 4 different datasets [27]. Exhaustive research carried by A. Zotin et. al. used in brain tumor pictures to detect edges. In this technique, you look for a set of the fuzzy cluster by searching iteratively. A related fuzzy membership matrix specifying the membership level of the kth element is prepared in the first set of vectors of the ith cluster. Equation 11 calculates the objective function.
![]()
Where, d is the membership value, xm is the mth cluster and cn is the centre of the nth cluster. After dividing the image into a series of homogenous clusters with the fuzzy C-mean (FCM) algorithm the canny edge detector is implemented. The authors achieved 98.4% segmentation accuracy in 2 images [28, 29]. Proposed A Robust segmentation on MRI and field correction, incorporated into a clustering model through local contextual information by Z. Zhang and J. Song. In this study, the precise segments of brain MRI, which is corrupted by noise and intensity homogeneity, are used to produce a new robust clustering of local context information (RC-LCI). In order to produce the respective anisotropic weight to update the present core pixel and eliminate noisy pixels, the weighting method incorporating local contextual data was used to construct a pixel in the principal pixel region. A multiplying structure consisting of a real image product and a bias field could then efficiently segment the brain RMI and analyze the bias domain. In terms of the coefficient of Jaccard similarity, the results obtained by RC_LCI were increased by 0.195 +/- 0.125 [30]. A unique algorithm proposed by F. Han for the detection of high-speed moving locations in a noisy environment. In conjunction with the Wavelet Coefficients tree and Lipschitz Expertise Noise Property, the definition of the neural network activation function is agreed on for the activation evaluation technique. Then it is possible to retain the important wavelet coefficients. The non-important coefficients were also excluded by the process of testing the independent coefficients. High-frequency data can be preserved during the wavelet transformation by raising the disappearance of wavelet filters which is useful for edge sensing [31]. A. Nyma et. al. presented a research paper on a hybrid technique for MRI segmentation. In this study, they adopt the vector median filter for the removal of noise. Thereafter, the Otsu threshold is used to define the homogenous regions of the input image in the first coarse segmentation process. An improved FCM is used to separate brain MR pictures in several segments that use the optimal deletion factor in the given data set for perfect clustering. The experimental result showed that it achieves around 96% of segmentation accuracy [32]. M.Z. Abderrezak et. al. discuss a new hybrid approach for the analysis of brain MRI. In this approach, the nonlocal median filter is used for the preprocessing. For the post-processing, authors propose a new model that is based on geometrical transformation. The segmentation efficiency is up to the mark for the tumor and the multiple detections of sclerosis [33]. R.Ahmad et. al. discussed a different approach for solving brain tumor problem. The combined SVM and ANN classification techniques were adopted by the researchers. In order to segment an image, temper based KMFCM is used. The numbers of clusters are assigned more than the standard K-mean algorithm. Automatically modified FCM membership eradicates tumor field contouring issues. The statistical characteristics obtained from segmented images are used to identify and distinguish tumors from normal SVM brain MRI images. The classification of benign tumors is based on 2 sets of features and ANN is used for four stages of malignant. In this method, 97.37% classification accuracy achieved.
3. Proposed Hybrid Method
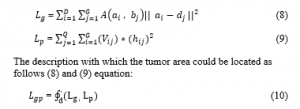
On the basis of the historical research and result analysis of the different segmentation methods for brain tumor diagnosis, the authors proposed a unique hybrid method for automatic brain tumor detection. The framework of the proposed method is given below:
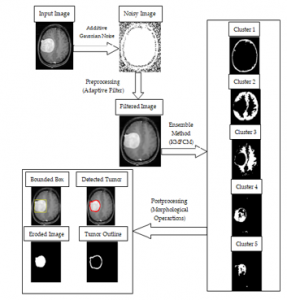
Figure 4: The framework of the proposed novel hybrid method for brain tumor segmentation
As shown in Figure 4, this article primarily divides the segmentation algorithm into three components.
Step 1: Preprocessing: Input the brain image from the Kaggle database [34]. Add Gaussian noise with different levels like 0.005, 0.007, etc. In this step noise removal is takes place with the help of adaptive mean and variance bas filter. By smoothing the MR images, it eliminates noise. This filter also reduces the variability in the intensity of MR images between one pixel to another.
Step 2: Applying Hybrid Method: In this step, a hybrid method which is the combination of modified K-mean clustering and fuzzy C- mean clustering (KMFCM) is applied. Segmented image with 5 different clusters are shown in figure 4. Brain tumor clustering and segmentation is done according to a threshold value.
Step 3: Post-processing: In the post-processing morphological operations are applied to the finding exact tumor region. For this purpose, the bounded box is used to show closed tumor areas. Also, the exact prediction of brain tumor some more eroded images and tumor outline images is added.
3.1. Preprocessing
On the degraded images containing Gaussian noise, the adaptive filter is applied. The mean and variance are the two statistical measures depending on a locally adaptive filter with a specified region of m × n window. The Function of adaptive filter is given below:
f(x,y) = g(x,y)- (σ2noise2/ σ2local)(g(x,y)-µ) (12)
Where, g(x, y) is the pixel value of the image at position (x, y), σnoise is the variance of the overall noisy image, σlocal is the variance of the local region and µ is the local mean. The overall noise removal process is explained below with the help of an example:
- Define a 3 × 3 window size.
- Consider an input image B with additive Gaussian noise level=0.005. Noisy image is a 218 × 180 matrix having values from 0 to 255.
- Appending 0’s to all four sides of the matrix B. The resultant matrix is C of order 222 × 184.
- Calculate the local mean (µ) and variance by sliding 3 × 3 window on the entire matrix C. Local mean is the mean of window of a matrix of 3 × 3.
- Calculate local variance (σlocal) with the given below equation:
σlocal = mean(window2)-(mean(window))2 (13)
- The noise variance (σnoise) of the whole image is calculated by taking the average of all local_variance.
- If (σnoise > σlocal) then σlocal = σnoise.
- The Filtered image is calculated by the following equation:
![]()
Noisy image and the filtered image is shown in the figure below:
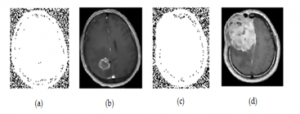
Figure 5: (a) Noisy Benign brain tumor image (b) Filtered image of an after processing adaptive filter (c) Noisy Malignant brain tumor image (d) Filtered image of c after processing adaptive filter
3.2. Applying Hybrid KMFCM Method
The proposed hybrid method is the combination of the modified K-mean clustering technique and Gaussian based fuzzy C- mean clustering technique. In the first stage, the extended K-mean is applied for deterministic cluster centroid initialization to prevent overfitting and then use the Fuzzy C-means algorithm for enhancing the classification capability. The extended K-mean algorithm is based on the standard K-mean algorithm having the capability of deterministically initializing the centroids. Maximizing the distance between the original cluster centroids is the fundamental principle of the extended K-means algorithm for initializing cluster centroids. This technology allows cluster centroids to be initialized deterministically and resolve the shortcomings of the K-means algorithm linked to their initialization instability. Given below is the method of initialization of an extended K-mean algorithm:
- Select a sample pixel as the first initialized cluster centroid from the information set randomly.
- Select the centroids of the all k- clusters and compute the distance between sample pixel (i.e. the point within the cluster) and cluster centroid.
![]()
Where, (xc, yc) is the centroid of the cluster and (xi, yi) is the ith sample pixel.
- After finding the distances between cluster points with the remaining pixel values, extract the point with minimum distance.
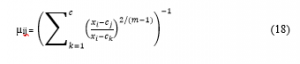
- Compute the probability of remaining sample pixel by using equation 16
![]()
Where, x is the sample pixel within the set of R pixels. d(x) is the distance between the sample pixel x to closest cluster center and d(x’) is the distance between the nearest pixels. By probability, select the sample with the biggest probability as the new centroid cluster.
- Repeat the above method until the determination of k cluster centroids.
- Now applying, fuzzy C-mean clustering for further updating in the cluster center.
- Let, Xi is the input cluster centers obtained from extended k-mean clustering.
- FCM partitions input information set Xi, where i=1 to R, is assigned to different clusters by assigning membership values to the set of points.
- Calculate the membership values with the help of objective function given below:
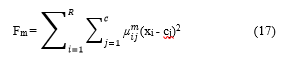
Where, m>1, µij is the degree of membership of cluster input data set xi in the jth cluster having cluster centre cj.
- k is the number of steps. Iteratively optimizes the objective function and updates the degree of membership µij and the cj cluster centers.
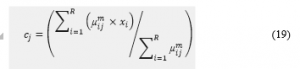 Calculate the value of µdiff = µij(k+1) – µijk . If the µdiff is less than ε then terminates. The value of the ε is the fixed value between 0 and 1 throughout the computation of the hybrid method.
The results after applying the hybrid method are given below in figure 6:
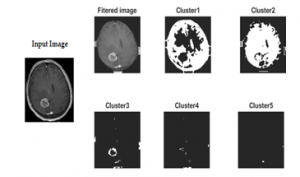
Figure 6: Clusters numbered 1 to 5 are shown after processing input image to the proposed KMFCM method
3.3. Post-processing
Morphological operations such as erosion and dilations applied to the results to improve the accuracy of segmented areas.
- Erosion is a method in which the structuring element is translated across the image domain. In a binary picture, erosion shrinks or thins items. A structuring element controls the way and magnitude of shrinking.
- The erosion by a structuring factor S of the binary image I generates a new binary image Ieroded = I Ө S with those positions (x, y) where the structuring element S matches the input image I originated, i.e. I(x,y) = 1 suited I and 0 otherwise, this process will be repeated for all the image pixels.
- Dilation is an operation in the binary image that develops or thickens items. A structuring component controls the way and magnitude of shrinking. Dilation is a method in which the structuring element is translated through the image domain.
- A new binary I picture is created by the dilation of I with a structural element S, i.e. Idilated=I S with At all places (x, y) where the structuring element S touches the input image f, i.e. I(x, y)= 1 for all pixel coordinates (x, y), if S reaches 1 and 0 otherwise, then repeat. Dilation has the opposite impact on erosion.
The results after applying the morphological operations are given below in figure 7:
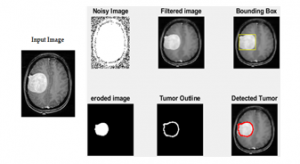
Figure 7: Eroded image, dilated image (Tumor Outline) and detected tumor are shown after processing input image to the morphological operation.
4. Evaluation Results
We randomly select 250 images from the kaggle database for the purpose of testing the proposed method [34]. These images are collected from different patients to check the reliability of the proposed method. Evaluation results of 10 images are given in table 1.
5. Result Analysis
The result is assessed on various parameters such as mean, standard deviation, Entropy, RMS, correlation, variance, smoothness, kurtosis, and skewness in order to inspect various aspects of this proposed method.
Table 1. Evaluation results of 10 different images containing benign and malignant tumor
| Input Image | Noisy Image | Results after Applying Hybrid Method | Types of Tumor |
| Benign | |||
| Malignant | |||
| Benign | |||
| Benign | |||
| Malignant | |||
| Malignant | |||
| Malignant | |||
| Malignant | |||
| Malignant | |||
| Malignant |
5.1. Platform for Evaluation
MATLAB implements the proposed model with the specific system requirements as shown in the table 2.
5.2. Result Analysis after Applying Proposed Method
Result analysis based on the statistical parameters is given in table 3. The statistical parameters are mean, standard deviation, entropy, RMS, correlation, variance, smoothness, kurtosis, and skewness. Table 4 predicts the detected tumor area, elapsed time. It is also able to classify the tumor is benign and malignant categories. Tables 5 show the comparative analysis between the size of the image and the elapsed time for brain tumor detection.
5.3. Histogram Analysis of Size of the Image vs. Elapsed Time
Figure 8 shows the histogram analysis of the result shown in table 5. Histogram analysis of the images shown that as size increase the time of brain tumor detection also increases.
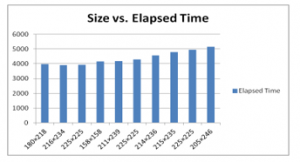
Figure 8: Histogram analysis of 10 different images based on the sizes in pixels and elapsed time in the Matlab
5.4. Comparison Based on the Segmentation Accuracy
Comparative result analysis based on the segmentation accuracy is shown in table 6. The proposed method contains 98% segmentation accuracy.
Table 2. System requirements of the proposed hybrid method
| Operating System | Processor | Disk Space | RAM | Graphics |
| Windows 10 | Any Intel or AMD x86-64 processor | 2 GB | 2 GB | It is suggested to have a hardware accelerated OpenGL 3.3 graphics card with 1 GB GPU RAM. |
Table 3. Result evaluation of 10 images with different parameters like mean, standard deviation, entropy, RMS, correlation, variance, smoothness, kurtosis, and skewness
| Image | Mean | Standard Deviation | Entropy | RMS | Correlation | Variance | Smoothness | Kurtosis | Skewness |
| 1 | 0.00324997 | 0.0944484 | 3.25081 | 0.094491 | 0.149077 | 0.0089188 | 0.920936 | 6.31294 | 0.346882 |
| 2 | 0.00262226 | 0.087009 | 3.31088 | 0.087039 | 0.124667 | 0.0075712 | 0.921683 | 7.78956 | 0.662543 |
| 3 | 0.00311785 | 0.0857021 | 3.62058 | 0.085749 | 0.091271 | 0.0073174 | 0.933302 | 6.71334 | 0.514491 |
| 4 | 0.00260813 | 0.0999868 | 2.77989 | 0.100000 | 0.131878 | 0.0099708 | 0.86225 | 7.30026 | 0.505607 |
| 5 | 0.00287338 | 0.0883515 | 3.65058 | 0.088388 | 0.079195 | 0.0077465 | 0.927916 | 5.70919 | 0.385260 |
| 6 | 0.003997 | 0.08567 | 3.21550 | 0.085750 | 0.114946 | 0.007309 | 0.9472 | 10.49700 | 0.829200 |
| 7 | 0.002789 | 0.08835 | 3.08390 | 0.08839 | 0.106534 | 0.007804 | 0.9239 | 11.15900 | 0.972100 |
| 8 | 0.002625 | 0.08701 | 3.4965 | 0.08704 | 0.039998 | 0.007511 | 0.9218 | 6.8506 | 0.4296 |
| 9 | 0.003545 | 0.08569 | 2.6891 | 0.08575 | 0.136652 | 0.007345 | 0.9409 | 13.195 | 1.1142 |
| 10 | 0.004851 | 0.08968 | 3.6828 | 0.0898 | 0.065291 | 0.008028 | 0.9547 | 5.3377 | 0.3763 |
Table 4. Comparative result analysis of 10 images with different parameters like detected tumor area, elapsed Matlab time and type of tumor.
| Image | Detected Tumor Area | Elapsed Time( mili seconds) | Types of Tumor |
| 1 | 753.925 | 3967.4151 | Benign |
| 2 | 15.9 | 3898.48409 | Malignant |
| 3 | 56.18 | 3934.035306 | Benign |
| 4 | 55.385 | 4159.82001 | Benign |
| 5 | 23.85 | 4187.05282 | Malignant |
| 6 | 120.575 | 4283.705 | Malignant |
| 7 | 19.345 | 4565.229 | Malignant |
| 8 | 563.655 | 4777.548 | Malignant |
| 9 | 55.385 | 4952.883 | Malignant |
| 10 | 1444.52 | 5151.964 | Malignant |
Table 5. Comparative result analysis based on the size of the image and elapsed time
| Image | Size of the Image (Pixels) | Elapsed Time
(mili seconds) |
| 1 | 180×218 | 3967.4151 |
| 2 | 216×234 | 3898.48409 |
| 3 | 225×225 | 3934.035306 |
| 4 | 158×158 | 4159.82001 |
| 5 | 211×239 | 4187.05282 |
| 6 | 225×225 | 4283.705 |
| 7 | 214×236 | 4565.229 |
| 8 | 215×235 | 4777.548 |
| 9 | 225×225 | 4952.883 |
| 10 | 205×246 | 5151.964 |
Table 6. Comparative result analysis based on segmentation accuracy
| S. No. | Segmentation Technique | Imaging Modalities | Image Task(s) | Segmentation Accuracy |
| 1 | Proposed Hybrid Method | MRI | Noise Removal and Segmentation | 98% |
| 2 | Wavelet transform with morphology based segmentation technique | MRI | Segmentation | 80% |
| 3 | Computer Aided method that includes the segmentation of the morphological erosion and dilation | MRI | Segmentation | 97% |
| 4 | Multistage modeling using Eulerian approach based segmentation technique | MRI | Registration and Segmentation | 90% |
| 5 | Probabilistic neural network based segmentation technique | MRI | Segmentation and Classification | 79% |
| 6 | Watershed & Thresholding based segmentation technique | CT Images and MRI | Segmentation | 92% |
| 7 | Geometric transform invariant based segmentation technique | CT Images and MRI | Segmentation | 90% |
| 8 | Watershed based segmentation technique | MRI | Segmentation | 97% |
| 9 | SVM and ANN based segmentation technique | MRI | Segmentation and Classification | 97.37% |
6. Conclusion
The brain images in this study are different in tumor sizes. Therefore, the tumor region is calculated by the proposed process. A variety of statistical and machine learning algorithms such as extended K-mean and modified fuzzy c-means are combined with noise removal adaptive filter technique for implementing such an efficient algorithm. The non-linear morphological erosion and dilation operations carried out to remove the non-tumor portion. As a result, segmentation accuracy and time of brain tumor detection improved with previously discussed techniques in this era. The proposed hybrid method achieves 98% segmentation accuracy. Also, an average of 4 to 5 seconds is the time taken to detect brain tumors depending upon the size of the image. Depending on the outcome review of the various techniques, segmentation level accuracy is higher than other approaches in the background study. It is also found that the statistical parameters such as standard deviation and image are small, which indicates that the statistical analysis outcomes of the proposed method are better than previously discussed algorithms.
Conflict of Interest
So far the knowledge, the authors declare no conflict of interest regarding this article.
Acknowledgment
This work is supported by the director, ASET, Amity University, Lucknow. They would also like to thank the anonymous readers and reviewers for their important and constructive feedback and suggestions, which significantly improved this paper’s content.
- N. Goel, Dr. A. Yadav and Dr. B.M. Singh, “Medical Image Processing: A Review” IEEE International Innovative Applications of Computational Intelligence on Power, Energy and Controls with their Impact on Humanity (CIPECH), 57-62, 2016.
- Sivakumaran, “Identifying Bone Cancer Using Markov Random Field Segmentation”, 4 June 2018, Available online:
https://electronicsforu.com/electronics-projects/prototypes/cancer-markov-random-field-segmentation . [Accessed: 21-August-2019] - Huo, Jing & Okada, Kazunori & van Rikxoort, Eva & Kim, Grace Hyun & R Alger, Jeffry & B Pope, Whitney & Goldin, Jonathan & S Brown, Matthew, “Hybrid segmentation for GBM brain tumors on MR images using confidence-based averaging”. Medical physics, 2013. 40. 093502. 10.1118/1.4817475.
- A. Shenbagarajan, V. Ramalingam, C. Balasubramanian and S. Palanivel, “Tumor Diagnosis in MRI Brain Image using ACM Segmentation and ANN-LM Classification Techniques”, Indian Journal of Science and Technology, Vol 9(1), 1-12, Jan 2016.
- Aiman Badawi and Muhammad Bilal, ”High-Level Synthesis of Online K-Means Clustering Hardware for a Real-Time Image Processing Pipeline”, J. Imaging 2019, 5, 38; doi:10.3390/jimaging5030038
- Yuheng, S.; Hao, Y. Image Segmentation Algorithms Overview. arXiv, 2017; arXiv:1707.02051.
- Cardoso, J.S.; Corte-Real, L., “Toward a generic evaluation of image segmentation”, IEEE Trans. Image Process. 2005, 14, 1773–1782.
- Chong Zhang , Xuanjing Shen, Hang Cheng, and Qingji Qian, “Brain Tumor Segmentation Based on Hybrid Clustering and Morphological Operations”, Hindawi, International Journal of Biomedical Imaging, Volume 2019, Article ID 7305832, 11 pages https://doi.org/10.1155/2019/7305832.
- N. Nezamoddini-Kachouie and P. Fieguth, “A Gabor based technique for image denoising”, Canadian Conference on Electrical and Computer Engineering, 2005. Saskatoon, Sask., 2005, pp. 980-983. doi: 10.1109/CCECE.2005.1557140
- James C.Bezdek, RobertEhrlich, WilliamFull, “FCM: The fuzzy c-means clustering algorithm”, Computers & Geosciences volume 10, issues 2–3, 1984, Pages 191-203.
- Nameirakpam Dhanachandra, Khumanthem Manglem, Yambem JinaChanu, “Image Segmentation Using K -means Clustering Algorithm and Subtractive Clustering Algorithm”, Procedia Computer Science volume 54, 2015, pages 764-771.https://doi.org/10.1016/j.procs.2015.06.090
- Kale Vaishnaw, Vandana B. Malode, “A Novel Approach based on Average Information Parameters for Investigation and Diagnosis of Lung Cancer using ANN”, Pattern Recognition and Image Analysis april 2018, volume 28, Issue 2, pp 301–309.
- Ahmed Kharrat, Mohamed Ben Messaoud, Nacéra BENAMRANE and Mohamed ABID, “Detection of Brain Tumor in Medical Images”, International Conference on Signals, Circuits and Systems, PP 1-6, 2009.
- Rajeev Ratan, Sanjay Sharma and S. K. Sharma, “Brain Tumor Detection based on Multi-parameter MRI Image Analysis”, ICGST-GVIP Journal, Volume (9), Issue (III), PP- 9- 17, June 2009.
- Qurat-Ul-Ain, Ghazanfar Latif, Sidra Batool Kazmi, M. Arfan Jaffar and Anwar M. Mirza, “Classification and Segmentation of Brain Tumor using Texture Analysis”, Recent Advances in Artificial Intelligence, Knowledge Engineering and Data Bases, PP 147- 155, Jan 2010.
- M. Usman Akram and Anam Usman, “Computer Aided System for Brain Tumor Detection and Segmentation”, International Conference on Computer Networks and Information Technology, PP 299-302, July 2011.
- Stefan Bauer, Christian May, Dimitra Dionysiou, Georgios Stamatakos, Philippe B¨uchler, and Mauricio Reyes, “Multiscale Modeling for Image Analysis of Brain Tumor Studies”, IEEE Transactions on Biomedical Engineering, Vol. 59, No. 1, ,PP 25-29, January 2012.
- Arun Tom, P. Jidesh, “Geometric transform invariant Brain-MR Image Analysis for Tumor detection”, IEEE conference on Circuits, Controls and Communications (CCUBE), 1-6, Dec 2013.
- R. Vijayarajan and S. Muttan, “Fuzzy C-Means Clustering Based Principal Component Averaging Fusion”, International Journal of Fuzzy Systems, Vol. 16, No. 2, June 2014 PP-153-159.
- Meiyan Huang, Wei Yang, Yao Wu, Jun Jiang, Wufan Chen and Qianjin Feng , “Brain Tumor Segmentation Based on Local Independent Projection-based Classification”, IEEE Transactions on Biomedical Engineering , 2633 – 2645 , Vol. 61, Issue 10, Oct 2014.
- K. K. Gupta, N. Dhanda and U. Kumar, “A Comparative Study of Medical Image Segmentation Techniques for Brain Tumor Detection”, 2018 4th International Conference on Computing Communication and Automation (ICCCA), Greater Noida, India, 2018, pp. 1-4.
- M. Sornam , Muthu Subash Kavitha , R. Shalini, “Segmentation and Classification of Brain Tumor using Wavelet and Zernike based features on MRI”, IEEE International Conference on Advances in Computer Applications (ICACA), Coimbatore, 166-169, Oct 2016.
- Rasel Ahmmed, Anirban Sen Swakshar, Md. Foisal Hossain, and Md. Abdur Rafiq, “Classification of Tumors and It Stages in Brain MRI Using Support Vector Machine and Artificial Neural Network”, In Proc. IEEE International Conference on Electrical, Computer and Communication Engineering (ECCE), Bangladesh, 229-237, Feb 2017.
- Xiaole Ma, Shaohai Hu and Shuaiqi Liu, “SAR Image De-Noising Based on Shift Invariant K-SVD and Guided Filter”, remote sensing, November 2017.
- Arbaz Mukaram, Chidananda Murthy and M.Z.Kurian, “An Automatic Brain Tumour Detection, Segmentation and Classification Using MRI Image”, International Journal of Electronics, Electrical and Computational System, Volume 6, Issue 5 May 2017.
- Hanafy M. Ali, “MRI Medical Image Denoising by Fundamental Filters”, in High-Resolution Neuroimaging – Basic Physical Principles and Clinical Applications, Ahmet Mesrur Halefolu, Intechopen, pp-111-124, March, 2018.
- Saman Riaz, Ali Arshad and Licheng Jiao, “Fuzzy Rough C-Mean Based Unsupervised CNN Clustering for Large-Scale Image Data”, applied sciences October 8(10), 1869 , 2018.
- Alexander Zotin, Konstantin Simonov, Mikhail Kurako,Yousif Hamad, Svetlana Kirillova, “Edge detection in MRI brain tumor images based on fuzzy C-means clustering”, 22nd International Conference on Knowledge-Based and Intelligent Information & Engineering Systems, PP-1262-1270, 2018.
- Gupta K.K., Dhanda N., Kumar U., “Depth Analysis of Different Medical Image Segmentation Techniques for Brain Tumor Detection”, in: Jain L., Virvou M., Piuri V., Balas V. (eds) Advances in Bioinformatics, Multimedia, and Electronics Circuits and Signals. Advances in Intelligent Systems and Computing, vol 1064, 2020. Springer, Singapore.
- Zhe Zhang and Jianhua Song, “ A Robust Brain MRI Segmentation and Bias Field Correction Method Integrating Local Contextual Information into a Clustering Model”, Recent Advances on Signal Processing and Deep Learning for Public Security and Engineering Applications, Appl. Sci. , 9(7), 1332, March, 2019.
- Fangfang Han , Bin Liu , Junchao Zhu and Baofeng Zhang, “Algorithm Design for Edge Detection of High-Speed Moving Target Image under Noisy Environment”, Sensors 2019, 19(2), 343; https://doi.org/10.3390/s19020343
- Alamgir Nyma, Myeongsu Kang, Yung-Keun Kwon, Cheol-Hong Kim and Jong-Myon Kim, “A Hybrid Technique for Medical Image Segmentation”, Hindawi Publishing Corporation, Journal of Biomedicine and Biotechnology, Volume 2012, Article ID 830252, 7 pages, doi:10.1155/2012/830252.
- Mohamed Zaki Abderrezak, Mouatez billah Chibane, Prof. Karim Mansour, “A New Hybrid Method for the Segmentation of the Brain MRIs”, Signal & Image Processing: An International Journal (SIPIJ) Vol.5, No.4, 77-84, August 2014.
- Navoneel Chakrabarty, “Brain MRI Images for Brain Tumor Detection Dataset”, Apr, 2019. Available online: https://www.kaggle.com/navoneel/brain-mri-images-for-brain-tumor-detection. [Accessed: 21-August-2019]