Evaluation of Uncertainty Measurement Calculation for Vector Network Analyzer From 300 kHz to 8.5 GHz
Volume 5, Issue 3, Page No 01-10, 2020
Author’s Name: Tan Ming Hui1,2,a), Ahmad Yusairi Bani Hashim2
View Affiliations
1Radio Frequency Calibration Laboratory, National Instruments (M) Sdn Bhd, 11900, Malaysia
2Faculty of Manufacturing Engineering, Universiti Teknikal Malaysia Melaka, 76100, Malaysia
a)Author to whom correspondence should be addressed. E-mail: ming.hui.tan@ni.com
Adv. Sci. Technol. Eng. Syst. J. 5(3), 01-10 (2020); ![]() DOI: 10.25046/aj050301
DOI: 10.25046/aj050301
Keywords: Measurement Uncertainty, Network Analyzer, Reflection

Export Citations
Increasing the telecommunications products that allow Vector Network Analyzer is becoming more common tools to measure the S-Parameter. It will be an absolute number from the S-Parameter measurements produced in real and imaginary, other words it is also known as the product of the calculation. The calculation findings do not include the systematic and random errors. It’s the reaction of the engineer to mitigate the likelihood of random and systemic errors. One of the common random error solutions is through the statistical analysis in the Vector Network Analyzer either repeated measurement or turn on high averaging measurement. The more data assessed, the greater the engineer’s confidence in evaluating random errors did not contribute significant errors. Systemic Error is consistent and reproducible when the measurement is made. One way of harmonizing these errors is to evaluate uncertainty measurements in the calculation for Vector Network Analyzer to perform measurements of reflection and transmission. Transmission measurements produce the three systematic errors that were directivity, source match and frequency response reflection tracking. This paper will concentrate from 300 kHz to 8.5 GHz directivity experimental to determine the accuracy of the Vector Network Analyzer. The experimental results will check balance with the Vector Network Analyzer specification. It is a validation process to ensure the Vector Network Analyzer meets the specification in order to perform an accurate measurement. The estimation of measurement uncertainty also refers to the Metrology 100 series Joint Committee for Guide to the Expression of Uncertainty in Measurement. The uncertainty expended should apply to Student Table’s confident level of 95%. It creates awareness to demonstrate the importance of measurement quality associated with the uncertainty, particularly for an ISO17025:2017 certified competence testing and calibration laboratory. Without the uncertainty associate to the measurement, it is not complying to the standard ISO17025:2017.
Received: 04 January 2020, Accepted: 14 April 2020, Published Online: 03 May 2020
1. Introduction
The raise of the telecommunication products enabling Vector Network Analyzer (VNA) [1] is getting more popular instruments to making the S-Parameter measurements. The Vector Network Analyzer is measuring in Time Domain Reflection and Time Domain Transmission converting into time domain. The Vector Network Analyzer had been helped engineer to solve the Fourier Transformation calculation and giving the results in real and imaginary number. The real and imaginary would be an absolute number, other words it is also known as measurement result. The measurement results are not including the random and systematic errors yet.
In the Vector Network Analyzer random error is statistical deviations in any direction during calculation. This error’s source is unknown. It is not a mistake that the technician made during the calibration of the Vector Network Analyzer. The same issue is also encountered even through a highest traceability chain in calibration performed by national measurement laboratory. It is not possible to eradicate random error from a calculation. It is the duty of the engineer to mitigate the probability of the random errors. One of the common random error solutions is through the statistical analysis in the Vector Network Analyzer either repeated measurement or turn on high averaging measurement. The more data taken into calculation, the greater the engineer’s confidence in evaluating a random error did not contribute substantial errors to the calculation of the Device Under Test [2].
Systematic error in a Vector Network Analyzer is reproducible through the calibration experiment and unable to determine the systematic error by statistical analysis. This mistake demonstrates consistently the same direction in making measurements. Systematic error contributor may be calculated by instrument impact factors, environmental factors, incoming source frequency and others do not cause by statistical contribution.
Random and systemic errors and consequences can lead to measurement uncertainty reporting in a huge number. Calculation of measurement uncertainty often refers to the Metrology 100 series Joint Guide Committee which is the Guide to Expression of Uncertainty in Measurement. It is creating awareness to demonstrate the importance of measurement quality associate with the uncertainty.
Many aspects in our life, we are accustomed to the doubt to estimate length in Meter, weight in Kilogram, temperature in Kelvin, time in Second, electric current in Ampere, amount of substance in Mole and luminous intensity in Candela. These are the 7 units of measure defined by the International System of Units were defined with its traceability. Quantitative measurement is not complete without uncertainty being reported with the measurement. For example, estimate a weight of a kilo pack of sugar. The manufacturer always including a tolerance from the weight that they measured. The manufacturer also has a tolerance of the weight they were examining. This means the measurement is in question by the manufacturer. This is the key reason why calibration is necessary to retain its tractability to the International System of Units. Another example of new Fifth Generation of Mobile Technologies (5G) sub-6GHz low frequency spectrum antenna required calibration up to 7.125 GHz [3]. The antenna manufacturer required to purchase the Vector Network Analyzer to perform analysis of the antenna reflection and transmission. Vector Network Analyzer examinations will help determine whether the antenna produce is pass or fail. Vector Network Analyzer’s accuracy is critical to ensure the antenna that is manufactured within the product’s limits. In this paper the same approach definition applies in the two ports Vector Network Analyzer measurement for transmission and reflection. To calculate the measurement uncertainty, the associated contributor must be established which will affect the calibration. Such calibration would give the antenna manufacturer a source of uncertainty in the calibration report associated with an absolute measurement [4]. This uncertainty reported in the calibration reports consists of the Type A and Type B [5] uncertainty calculation from the calibration provider. Type A uncertainty consist of repeatability [6] and Type B uncertainty consists of product error such as reflection coefficient [7]. The calibration report will be used in a subsequent evaluation of uncertainty or other words names as “imported uncertainty”.
This paper will implement a calibration of the 3 decibel (dB) fixed attenuator defined as a half power loss in the radio frequency transmission line [8]. The half power loss is the best case for simulating radio frequency components as measured in the Vector Network Analyzer in terms of transmission and reflection. It is a passive device and high stability in repeating measurement compare to other active device such as antenna, amplifier, mixer and filters in the production floor. These products manufactured in the production floor would own the wider specification, tolerance and low stability. It is not a good sample for Vector Network Analyzer to perform the calibration and measurement uncertainty analysis because wider specification and tolerance contribute inaccurate measurement. At the same time, it will cause the Vector Network Analyzer measured in low accuracy, low precision and high uncertainty in calibration. Evaluation of type A uncertainty required a high stability system upon repeated measurement. This is for achieving the optimal measurement of type A uncertainty. Meanwhile, uncertainty of type B would allow a well-known good Vector Network Analyzer to perform the calibration of the transmission and reflection. This paper will demonstrate through calibration process associated with expanded uncertainty to the 3 dB fixed attenuator measurement. The key advantage is the same technique often used for the process of calibration of power sensors, radio frequency cables and connectors. The evaluation of uncertainty measurement in calculation from 300 kHz to 8.5 GHz will be applied if the same PXIe-5632 Vector Network Analyzer remains.
This paper is an extension of the work originally presented in the 2016 7th International Conference on Mechanical, Industrial, and Manufacturing Technologies [9] and Journal of Engineering Science and Technology Vol. 14, [10]. The limitation of this paper is frequency bandwidth from 300 kHz until 8.5 GHz only and frequency response transmission tracking analysis did not perform.
At the end of this paper the effects of measuring uncertainty will be compared with the other well-known manufacturer of the Vector Network Analyzer. It is to compare the estimation of the expanded uncertainty in measurement with the specific frequency bandwidth range. Improvements for future research can be established from the comparison.
2. Evaluation of Uncertainty Measurement
2.1. Type A Evaluation of Uncertainty
Evaluation of measurement uncertainty classified into two categories Type A and Type B. Type A evaluation evaluates the uncertainty resulted from the statistical study. The statistical analysis may be an undergrowth series of repeated measurements of the same process. The series of repeated measurements will fill in a standard deviation of mean. Type B evaluates uncertainty other than statistical analysis. The uncertainty is based on the manufacturer published specification.
Estimation of Type A evaluation of uncertainty can be applied when a set of measurement was recorded under the same condition with minimum 2 repeated measurement. An example of a quantity Y input with N statistically independent (N > 1) observed as (where j = 1, 2, 3, …, n). The estimation of quantity of Y is , arithmetic mean wrote as equation (1) or applying the function of Average in Excel shown by equation 1 [11].
The arithmetic mean of is evaluated in equation 2 or applying the function of VAR.S in Excel to estimate the variance of probability distribution define as shown by equation 2 [11].
After estimation of arithmetic mean and variance had been calculated, the experimental standard deviation for Type A uncertainty was calculated in equation 3 by applying the function of STDEV in Excel shown by equation 3 [12].
The Type A standard uncertainty associated with the initial set of measurement repeated is the experimental standard deviation formula in equation 3. The standard uncertainty calculation is applying the same formula in equation 3. In order to differentiate the standard uncertainty and standard deviation, shown by equation 4. Type A standard uncertainty share the same formula in equation 3.
The main purpose of repeated measurement is to disperse the data into a statistical waveform. This study obtains 5 repeated measurements to fill in the Type A measurement uncertainty.
Table 1: PXIe-5632 Type B contributors
| Frequency Range | 300 kHz to <5 GHz | 5 GHz to 8.5 GHz | Unit |
| Directivity | 0.0106 | 0.020 | dB |
| Source Match | 0.0125 | 0.0195 | dB |
| Reflection Tracking | 0.1 | 0.1 | dB |
| Transmission Tracking | 0.12 | 0.12 | dB |
| Load Match | 0.0048 | 0.0114 | dB |
| Power Step Resolution | 0.01 | 0.01 | dB |
| Trace Noise | 0.0060 | 0.0060 | dB |
2.2. Type B Evaluation of Uncertainty for PXIe-5632
Type B contributor to the uncertainty was based on the product specification of the PXIe-5632 Vector Network Analyzer. It is necessary to list as many as which aspect of the system will lead to the error. Table 1 describing seven types of contributors.
Vector Network Analyzer directivity is the relation between the leakage signal and the reflected signal. The lower directional leakage signals the better measurement quality. Source match define as the internal reflection error between the Vector Network Analyzer generator and device under test. Reflection tracking is the loss from the test port, cable and connection at port 1 and port 2 independently at the network analyzer. Transmission tracking is the loss from the test port, cable and connection from port 1 to port 2 at the network analyzer. Load match is the error occur from the device under test to the receiver of network analyzer. Power step resolution refer to the most sensitivity resolution setting in the Vector Network Analyzer. Trace noise is the stability of the power when making the measurement across the bandwidth [13] swept in the network analyzer.
In the practical to perform a complete test and calibration set up shown by Figure 1 is a full two port characteristic calibration. This set up consists of a NI PXIe-1071 chassis, NI PXIe-8135 Controller, NI PXIe-5632 Vector Network Analyzer, a pair of gore cable and NI Automatic VNA Calibration Module 70 kHz until 9 GHz.
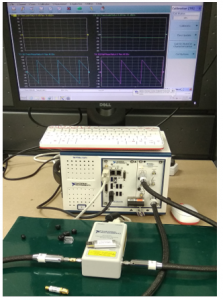
Figure 1 : A set up of PXIe-5632 Calibration
There are other variables that may contribute to the Type B uncertainty other than the 7 contributors mentioned in Table 1. The performance of the equipment would be degraded over time. In the product specification, some manufacturer may mention the aging or drift. It is up to engineers to either estimate the drift relative to the maximum or minimum specification limits or included as another Type B uncertainty component. One way of solving this problem is by calibrating the entire device shown in Figure 1. The manufacturer recommended one-year calibration interval for Vector Network Analyzer and Automatic Calibration Module. It is to ensure the absolute reading measured from this system is traceable to the International System of Units.
Once the calibration had been completed in Figure 1, this system is ready to measure a wide range of radio frequency devices such as antenna, amplifier, attenuator, splitter, filters and many more. In this paper, a 3 dB fixed attenuator manufacturer by Mini-Circuit with model VAT-3+ had been selected as shown by Figure 2.
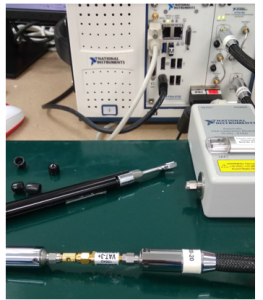
Figure 2: A 3 dB Fixed Attenuator under full two ports calibration
The 3 dB Attenuation L(X) to be calibrated was obtain shown by equation 5.
![]()
Where:
δLm = Correction to mismatch loss
δLk = Correction for leakage for signal between input and output
δLr = Resolution of the network analyzer
The 3 dB Attenuation L(X) will be measured in the Vector Network Analyzer from 300 kHz until 8.5 GHz are known as absolute reading. These absolute reading will associate with estimated measurement uncertainty at the end of this paper. In order to measure the 3 dB Attenuation, there are 3 factors contribute to the measurement. It is identified as correction to mismatch loss, correction for leakage for signal between input and output and resolution of the network analyzer.
Correction to mismatch loss define as the calibration system consists of NI PXIe-5632 Vector Network Analyzer, a pair of gore cable and NI Automatic VNA Calibration Module 70 kHz until 9 GHz to perform the characteristics impedance calibration. Where the characteristics impedance calibration accuracy traceable to the NI Automatic VNA Calibration Module.
Correction for leakage for signal between input and output is define as the power dissipate along the transmission line from the Vector Network Analyzer port 2 to port 1 (forwards transmission S21) and port 1 to port 2 (reverse transmission S12).
Resolution of the network analyzer refer to least significant digit measured from the Vector Network Analyzer. The least significant digit refers to the lowest digit from the display.
3. Uncertainty Analysis for PXIe-5632 Network Analyzer
Uncertainty analysis for PXIe-5632 Vector Network Analyzer required to combine Type A and Type B contributors. The Type A uncertainty had been completed in previous study. Refer to Table 2, there are 7 Type B contributors and 1 Type A contributor in the uncertainty analysis. Each of the Type A and B contributors required to identify the distribution type. Distribution type segregate by Normal Distribution, U-shape, Triangle or Rectangular.
Table 2: Uncertainty component’s unit, evaluation and distribution type
| Uncertainty Component | Units | Evaluation Type | Distribution Type |
| Directivity | dB | B | U Shape |
| Source Match | dB | B | U Shape |
| Reflection Tracking | dB | B | Normal |
| Transmission Tracking | dB | B | Normal |
| Load Match | dB | B | U Shape |
| Power Step Resolution | dB | B | Rectangular |
| Trace Noise | dB | B | U Shape |
| Repeatability | dB | A | Normal |
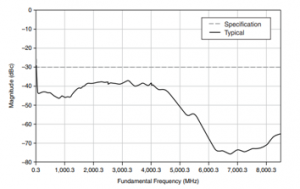
Figure 3 : PXIe-5632 Source Second Harmonics
Directivity, Source Match, Load Match and Trace Noise are identified as U-Shape distribution. The 4 contributors are mainly generated from the Vector Network Analyzer internal generators and receivers. It is systematic errors in the Vector Network Analyzer. An example PXIe-5632 generator second harmonic recorded in the product specification [14] as shown by Figure 3. The trend of the source second harmonics does not populate in Normal Distribution, Rectangular or Triangle distribution. The source distribution type is populating close to U-Shape.
Reflection and Transmission Tracking were classified as normal distribution since uncertainty values recorded in dB were taken from the manufacturer specification. Element of repeatability uncertainty is normal distribution type. Table 3 will extend each of the uncertainty components calculation in divisor, standard uncertainty, degree of freedom and combine uncertainty.
Table 3: Uncertainty calculation from 300 kHz to <5 GHz
| Uncertainty Component | Divisor | Standard Unc. | Degree of Freedom | Combine
Unc. |
| Directivity | 1.4142 | 0.0107 | 1000 | 0.0076 |
| Source Match | 1.4142 | 0.0195 | 1000 | 0.0138 |
| Reflection Tracking | 2 | 0.0200 | 1000 | 0.0100 |
| Transmission Tracking | 2 | 0.0700 | 1000 | 0.0350 |
| Load Match | 1.4142 | 0.0048 | 1000 | 0.0034 |
| Power Step Resolution | 3.4641 | 0.0100 | 1000 | 0.0029 |
| Trace Noise | 1.4142 | 0.0060 | 1000 | 0.0042 |
| Repeatability | 1 | 0.0176 | 4 | 0.0176 |
| Combined Standard Uncertainty | 0.0432 | |||
| Effective Degree of Freedom | 135.8664 | |||
| Coverage Factor | 1.96 | |||
| Expanded Uncertainty | 0.085 | |||
| Unit | dB | |||
For each variable, Table 3 calculates 4 contributors which were divisor, standard uncertainty, degree of freedom and combined uncertainty. Each part of the uncertainty was defined as the same element measured in dB. In this case, no conversion is necessary in order to convert to the same base unit. The sensitivity factor [15] for each contributor is equal to 1. U-Shape distribution divisor is 1.4142. The manufacturer reported standard uncertainty for reflection and transmission tracking are 0.02 dB and 0.07 dB respectively. Reflection and transmission tracking divisor are 2. Rectangular distribution divisor is 3.4641 [16].
The degree of freedom for the 7 Type B contributors are calculate as infinite. It is because the uncertainty contributors were based on the product specification. Which means the 7 Type B contributor are the worst-case [17] standard uncertainty. When a worst-case uncertainty contributor taken from the product specification, the values involved in the calculation was infinite.
Combined uncertainty [18] applied shown by equation 6.
![]()
Where:
δUs = Standard uncertainty contributor
δUd = Distribution type of divisor
δUf = Sensitivity Coefficient
Combined Standard Uncertainty U(s) [19] applied shown by equation 7.
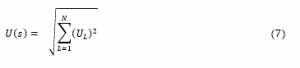
Where:
UL = Uncertainty Components
Effective Degree of Freedom V(eff) [20] applied shown by equation 8.
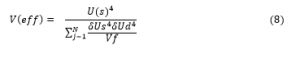
Where:
U(s) = Combined Standard Uncertainty
δU(s) = Standard uncertainty contributor
δUd = Distribution type of divisor
Vf = Degree of Freedom
Coverage factor refer to Effective Degree of Freedom in Table 3. It was calculated as 135.8664. Refer the value 135.8664 in Student T table. From Student T table, it was located between 100 and 1000 as shown by Figure 4. Choose the round up value at 95% confidence level as 1.962.
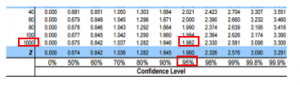
Figure 4 : Student T Table
Expanded Uncertainty E(u) [21] applied shown by equation 9.
![]()
Where:
U(s) = Combined Standard Uncertainty
Cf = Coverage Factor
From Table 3, it was concluded that the Expanded Uncertainty from 300 kHz until 5 GHz reported at 0.085 dB. The same methodology applied from 5 GHz to 8.5 GHz frequency range as shown by Table 4.
Coverage factor refer to Effective Degree of Freedom in Table 4. It was calculated as 115.2108. Check the calculated reading 115.2108 from Student T table. From the Student T table, it was located between 100 and 1000 as shown by Figure 5. Choose the round up value at 95% confident level as 1.962.
Table 4: Uncertainty calculation from 5 GHz to 8.5 GHz
| Uncertainty Component | Divisor | Std Unc. | Degree of Freedom | Combine
Unc. |
| Directivity | 1.4142 | 0.0200 | 1000 | 0.0141 |
| Source Match | 1.4142 | 0.0195 | 1000 | 0.0138 |
| Reflection Tracking | 2 | 0.0200 | 1000 | 0.0100 |
| Transmission Tracking | 2 | 0.0700 | 1000 | 0.0350 |
| Load Match | 1.4142 | 0.0227 | 1000 | 0.0161 |
| Power Step Resolution | 3.4641 | 0.0100 | 1000 | 0.0029 |
| Trace Noise | 1.4142 | 0.0060 | 1000 | 0.0042 |
| Repeatability | 1 | 0.0212 | 4 | 0.0212 |
| Combined Standard Uncertainty | 0.0495 | |||
| Effective Degree of Freedom | 115.2108 | |||
| Coverage Factor | 1.96 | |||
| Expanded Uncertainty | 0.097 | |||
| Unit | dB | |||
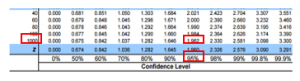
Figure 5 : Student T Table
From Table 4, it was concluded that the Expanded Uncertainty from 5 GHz until 8.5 GHz reported at 0.097 dB. The expanded uncertainty evaluation was reported respected to its frequency points as shown by Table 5. Forwards transmission (S21) and reverse transmission (S12) was the magnitude of absolute measurement associate with expanded uncertainty. The expended uncertainty should report in 2 decimal points.
Table 5: An Example of Calibration Report with Expanded Uncertainty
| DUT Calibration Report | ||||
| Frequency (GHz) | S21 | Uncertainty | S12 | Uncertainty |
| 0.0003 | -2.939 | 0.084 | -2.951 | 0.085 |
| 1 | -3.092 | 0.084 | -3.111 | 0.085 |
| 2 | -3.154 | 0.084 | -3.168 | 0.085 |
| 3 | -3.189 | 0.084 | -3.195 | 0.085 |
| 4 | -3.29 | 0.084 | -3.297 | 0.085 |
| 5 | -3.239 | 0.084 | -3.242 | 0.085 |
| 6 | -3.379 | 0.093 | -3.395 | 0.097 |
| 7 | -3.408 | 0.093 | -3.425 | 0.097 |
| 8 | -3.497 | 0.093 | -3.498 | 0.097 |
| 8.5 | -3.553 | 0.093 | -3.562 | 0.097 |
4. Discussion
In this paper the measurement uncertainty calculation was referred to the process flow of ISO / IEC Guide 98-1 to quantify the measurement uncertainty as Figure 6.
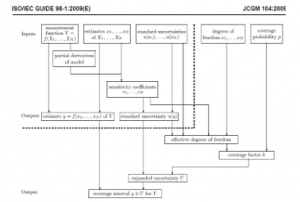
Figure 6 : ISO/IEC Guide 98-1 Uncertainty Calculation Process Flow
The flow diagram was divided into two major groups. It is input and output. In this paper, Tables 1 and 2 represent input. Whereas Tables 3, 4 and 5 reflect output. All tables describe the flows necessary to calculate the measurement uncertainty. There are total 6 systematic errors in reflection and transmission were found in the Vector Network Analyzer. It is identified as directivity, source match and frequency response reflection tracking for reflection. Transmission measurement generate another 3 systematic errors identified as isolation, load match and frequency response transmission tracking. The limitation from this paper to calculate the measurement uncertainty is without isolation taking into the consideration.
However, the vector Network Analyzer and Calibration Kits were used in the calculation of measurement uncertainty will undergo the process of validation to ensure whether the hardware meets the minimum specification as discuss in 4.1.
4.1. Vector Network Analyzer Directivity Validation by Using Anritsu Mechanical Verification Kits
The reading of Directivity and Source Match in Table 1 was released by the manufacturer as product specification. Validation is necessary to ensure the Vector Network Analyzer complies with the specification. To perform the validation, verification kits are expected using the airline, as shown in Table 6.
Table 6: Directivity and Source Match Experimental Test
| Experimental | Directivity | Source Match |
| 300 kHz to
5 GHz |
Anritsu SC7953 Super Termination | Anritsu 23K50 Male Short |
| 5 GHz to
8.5 GHz |
Anritsu SC4808
20 dB Offset Termination and Anritsu SC7594 Airline |
Anritsu 23KF50 Female Short and Anritsu SC7594 Airline |
Directivity is load test and source match is short test. Both directivity and source match sharing the same Anritsu SC7594 airline in high frequency. Either the validation of the directivity or the source match is enough to justify the efficiency of the Vector Network Analyzer, and the calibration kits comply with the specification specified in Table 1. In this paper the validation of the directivity was chosen to compare against the product specification. This is because the vector network analyzer uses the directional couplers or bridges to make reflected measurements. When the Vector Network Analyzer calibrated with the calibration kits, a small amount of incident signal leakage through the directional couplers or bridges into the receiver. This incident happens on both ports 1 and 2 of the Vector Network Analyzer. The leakage signal will affect the accuracy and precision of the Vector Network Analyzer. The leakage signal in directivity validation could be validated using the SC7953 super termination and SC4808 20-dB offset termination attachment to Anritsu SC7594 airline as shown in Figure 7.
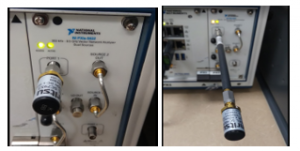
Figure 7 : Directivity Validation by Using Anritsu Verification Kit from 300 kHz to 5 GHz (left) and 5 GHz to 8.5 GHz (right)
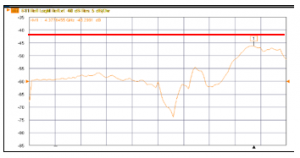
Figure 8 : PXIe-5632 Port 1 Directivity Validation Results Measured from 300 kHz to 5 GHz
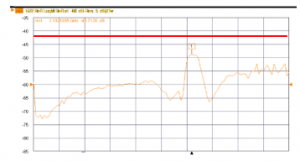
Figure 9 : PXIe-5632 Port 2 Directivity Validation Results Measured from 300 kHz to 5 GHz
Once the Anritsu SC7953 super termination attach to the ports 1 and 2 at the Vector Network Analyzer, the SC7953 super termination will absorb the power transmitted from the Vector Network Analyzer generator. The results of this test shown by Figure 8 for port 1 and Figure 9 for port 2 of the Vector Network Analyzer respectively measured at -46.29 dB and -48.21 dB.
The maximum product specification is -42 dB from 300 kHz until 5 GHz. This experiment shows that the Vector Network Analyzer performed better than the specification required.
Figures 10 and 11 demonstrate the ports 1 and 2 directivity test measured from 5 GHz until 8.5 GHz. The maximum accepted ripples are 3.1dB. The Vector Network Analyzer was found within the product specification.
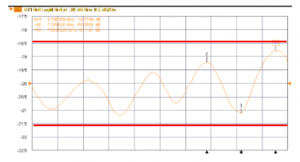
Figure 10 : PXIe-5632 Port 1 Directivity Validation Results Measured from 5 GHz to 8.5 GHz
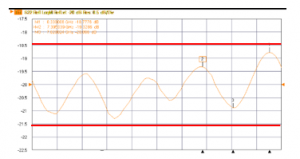
Figure 11 : PXIe-5632 Port 2 Directivity Validation Results Measured from 5 GHz to 8.5 GHz
In this validation experimental, the Vector Network Analyzer directivity measurement swept from 300 kHz to 8.5 GHz concludes the Vector Network Analyzer was performed better than the required specification. Since the directivity of the PXIe-5632 Vector Network Analyzer performed better than the warranted specification, directivity component listed in Table 1 is validated.
4.2. Vector Network Analyzer Mismatch Validation with 3 dB Fixed Attenuator Product Specification
The Anritsu Verification kit used to measure the Directivity and Source Match ripples. The ripples measured from the Vector Network Analyzer would be the Type B contributor respected to its frequency bandwidth. Meanwhile the Load Match from Table 1 was determined from below criteria as Table 7.
Table 7: Fixed Attenuator and VNA Mismatch Calculate in dB
| Frequency | 3 dB Attenuator | VNA | Mismatch (%) | dB |
| 300 kHz to 5 GHz | 1.15 | 1.016 | 0.1107 | 0.0048 |
| 5 GHz to 8.5 GHz | 1.5 | 1.032 | 0.5256 | 0.0227 |
From Table 7, the voltage standing wave ratio for 3 dB attenuator measure at 1.15 and 1.5 were taken from the manufacturer specification. The voltage standing wave ratio for Vector Network Analyzer measured at 1.016 and 1.032 was conversion from the product specification Load Match 42 and 36 dB respectively. To calculate the Load Match from the Vector Network Analyzer together with the fixed attenuator VAT-3+ by applying the mismatch formula [22]. The calculated mismatch was in percentage. It is required to convert the mismatch in percentage to dB [23].
Table 2 used to determine the distribution type for each contributor. The main reason why reflection and transmission tracking did not category as U-Shape distribution type because from the product datasheet it was provided the info as uncertainty in typical. The uncertainty value reported in typical is identical to 2 sigma uncertainty. In order to calculate the Type B contributor for reflection and transmission tracking correctly, it is normal distribution type. If both reflection and transmission tracking identified as U-Shape distribution type, the expanded uncertainty will be increased as Tables 8 and 9. The uncertainty will be increased from 0.085 to 0.111 and 0.098 to 0.122. The expended uncertainty in Tables 8 and 9 could not classified incorrect expended uncertainty calculation because it is meet the ISO/IEC Guide 98-1 method. The only disadvantage for Tables 8 and 9 is the calculated expanded uncertainty approximately 30% increase from the initial calculation in Tables 3 and 4 respectively.
Table 8: Effect of Reflection and Transmission Distribution Type Changed from 300 kHz to 5 GHz
| Uncertainty Component | Distribution Type | Divisor | Std Unc. | Combined | ||
| Directivity | U | 1.4142 | 0.0107 | 0.0076 | ||
| Source Match | U | 1.4142 | 0.0195 | 0.0138 | ||
| Reflection | U | 1.4142 | 0.0200 | 0.0141 | ||
| Transmission | U | 1.4142 | 0.0700 | 0.0495 | ||
| Load Match | U | 1.4142 | 0.0048 | 0.0034 | ||
| Power Step | Rectangular | 3.4641 | 0.0100 | 0.0029 | ||
| Trace Noise | U | 1.4142 | 0.0060 | 0.0042 | ||
| Repeatability | Normal | 1 | 0.0176 | 0.0176 | ||
| Combined Standard Uncertainty | 0.0565 | |||||
| Effective Degree of Freedom | 337.94 | |||||
| Coverage Factor | 1.96 | |||||
| Expanded Uncertainty | 0.111 | |||||
| Unit | dB | |||||
4.3. Vector Network Analyzer Reflection and Transmission Improvement
Distribution type identification for each contributor in table 2 is very important. We need to understand and identify the distribution type for each contributor correctly in order to compute the lowest expended uncertainty. The lower expended uncertainty calculated, the better system it is.
Table 9: Effect of Reflection and Transmission Distribution Type Changed from 5 GHz to 8.5 GHz
| Uncertainty Component | Distribution Type | Divisor | Std Unc. | Combined | ||
| Directivity | U | 1.4142 | 0.0200 | 0.0141 | ||
| Source Match | U | 1.4142 | 0.0195 | 0.0138 | ||
| Reflection | U | 1.4142 | 0.0200 | 0.0141 | ||
| Transmission | U | 1.4142 | 0.0700 | 0.0495 | ||
| Load Match | U | 1.4142 | 0.0227 | 0.0161 | ||
| Power Step | Rectangular | 3.4641 | 0.0100 | 0.0029 | ||
| Trace Noise | U | 1.4142 | 0.0060 | 0.0042 | ||
| Repeatability | Normal | 1 | 0.0212 | 0.0212 | ||
| Combined Standard Uncertainty | 0.0614 | |||||
| Effective Degree of Freedom | 251.7565 | |||||
| Coverage Factor | 1.98 | |||||
| Expanded Uncertainty | 0.122 | |||||
| Unit | dB | |||||
4.4. PXIe-5632 Vector Network Analyzer Limitation and Improvement for Future Work
A comparison against the calibration and measurement capability for transmission S21 with other manufacturer had been completed in Table 10. The purpose of the comparison is to measure the gap analysis between other Vector Network Analyzer manufacturers and this study.
Table 10: Transmission S21 Comparison With other Manufacturer
| Transmission S21 | Study | OEM1 | OEM2 |
| Calibration and Measurement Capability in dB | 0.086 to 0.094 | 0.057 | 0.029 to 0.056 |
| VNA system in use | NI PXIe-5632 | HP 8753ES | MS 462xx |
The calibration and measurement capability for OEM1 and OEM2 were downloaded from Accredited body website. The manufacturer published the best capability in Transmission S21 measurement. The differences between this OEM1 and this study is approximate 33.7% better in measurement capability. Meanwhile the gap analysis between OEM2 and this study was approximate 66.2% better in measurement. Both OEM1 and OEM2 delivered the better number in expanded uncertainty calculation because both OEM1 and OEM2 select the higher accuracy of the Vector Network Analyzer. To improve this study, we need to focus at the main contributors is Tables 3 and 4 in order to enhance the system.
From Tables 3 and 4, it was found that Transmission Tracking and Repeatability contribute more than half of the expended uncertainty calculation. To improve the Transmission Tracking uncertainty contributor, we need a calibrated 3 dB attenuator from National Measurement Laboratory becomes a reference attenuator to calibrate the NI PXIe-5632 Vector Network Analyzer. A calibrated 3 dB attenuator from United Kingdom National Measurement Institute, National Physical Laboratory (United Kingdom Accreditation Service number 0478) could carry the reflection and transmission uncertainty as low as 0.01 dB and 0.0012 dB respectively. The known attenuation value calibrated from National Physical Laboratory could overwrite the NI PXIe-5632 Vector Network Analyzer product specification in reflection and transmission Tracking accuracy by 2 time and 58 times improved respectively calculated in Tables 11 and 12.
Table 11: Reflection and Transmission Tracking Uncertainty With Reference Attenuator from 300 kHz to 5 GHz
| Uncertainty Component | Standard Uncertainty | Combined |
| Directivity | 0.0107 | 0.0076 |
| Source Match | 0.0195 | 0.0138 |
| Reflection | 0.0100 | 0.0071 |
| Transmission | 0.0012 | 0.0008 |
| Load Match | 0.0048 | 0.0034 |
| Power Step | 0.0100 | 0.0029 |
| Trace Noise | 0.0060 | 0.0042 |
| Repeatability | 0.0176 | 0.0176 |
| Combined Standard Uncertainty | 0.0243 | |
| Effective Degree of Freedom | 14.4105 | |
| Coverage Factor | 1.96 | |
| Expanded Uncertainty | 0.048 | |
| Unit | dB | |
Table 12: Reflection and Transmission Tracking Uncertainty With Reference Attenuator from 5 GHz to 8.5 GHz
| Uncertainty Component | Standard Uncertainty | Combined |
| Directivity | 0.0200 | 0.0141 |
| Source Match | 0.0195 | 0.0138 |
| Reflection | 0.0100 | 0.0071 |
| Transmission | 0.0012 | 0.0008 |
| Load Match | 0.0227 | 0.0161 |
| Power Step | 0.0100 | 0.0029 |
| Trace Noise | 0.0060 | 0.0042 |
| Repeatability | 0.0212 | 0.0212 |
| Combined Standard Uncertainty | 0.0343 | |
| Effective Degree of Freedom | 27.2742 | |
| Coverage Factor | 1.98 | |
| Expanded Uncertainty | 0.068 | |
| Unit | dB | |
Nevertheless, the significant improvement in reflection and transmission tracking accuracy also will help to recalculate the Type A repeated uncertainty contributor to a smaller number in uncertainty are based on theory and for future study.
4.5. Summary of Discussion
Table 13 is the summary of improvement calibration technique applied the 3 dB reference attenuator into the NI PXIe-5632 Vector Network Analyzer calibration system. When this technique applied in the NI PXIe-5632 calibration system, the calibration and measurement capability performance is like other manufacturer Vector Network Analyzer and the investment is the lowest among the others.
Table 13: Summary of Improvement Calibration Technique NI PXIe-5632 With Reference Attenuator
| Transmission S21 | Study | OEM1 | OEM2 |
| Calibration and Measurement Capability in dB | 0.086 to 0.094 | 0.057 | 0.029 to 0.056 |
| VNA system in use | NI PXIe-5632 With 3dB Reference Attenuator | Agilent 8753ES/ E5071C | Anritsu MS462x |
| Investment | Low – USD 20k | High -USD 50k | Medium- USD 35K |
5. Conclusion
In this paper, an evaluation of measurement uncertainty for NI PXIe-5632 Vector Network Analyzer from 300 kHz to 8.5 GHz is calculated. This frequency bandwidth is widely used in telecommunications particularly in the calibration system for the 5 G sub-6GHz. This paper clarified the extended uncertainty measurement applied in the Vector Network Analyzer, valued to specific calibration techniques. A complete mathematical review shows the effects in each step involve changes to the contributor of uncertainty. This paper could help improve the scattering of parameters for commercial laboratories to extend the calibration potential in the new sector. The calibration technique of the 3 dB fixed attenuator also helps the commercial calibration laboratory explore existing measuring capacities and increase the degree of competence in the laboratory. In the discussion, it is explained different Vector Network Analyzer techniques applied in the NI PXIe-5632 could generate different expanded uncertainty in calculation. Based on the laboratory budget planning, the laboratory is free to choose which calibration technique would apply in the new scope. A part of the limitation of this paper is that isolation does not take into the estimation of measurement uncertainty calculation. It is because the manufacturer did not specify the specification for the isolation, but the systematic error of isolation could be established by validation or experimental. As future of this work, the first development is to increase the frequency from 8.5 GHz to 50 GHz. The second development is extending to Vector Network Analyzer Scattering Parameters port 1 (S11) and port 2 (S22). The calculation of the reflections S11 and S22 involved only port 1 or port 2. In addition, a measure of the test uncertainty ratio may also be added in future to satisfy the requirements of ANSI / NCSL Z540.
6. Acknowledgements
This work was supported in part by the Malaysian Ministry of Higher Education under the MyBrain15 program and Universiti Teknikal Malaysia Melaka.
- National Instruments, Calibration Procedure PXIe-5632 8.5 GHz Vector Network Analyzer, National Instruments USA, 2018.
- Agilent, Fundamentals of RF and Microwave Power Measurements (Part 1), Agilent Technology USA, 2003.
- M. Andreas, Chandramouli, M. Baker, Devaki, “5G Evolution: A View on 5G Cellular Technology Beyond 3GPP Release 15,” in IEEE Access PP(99):1-1, 2019 https://doi.org/10.1109/ACCESS.2019.2939938
- Mini-Circuits, Fixed attenuators help minimize impedance mismatches, Mini-Circuit USA, 2015.
- Metrology, ISO/IEC Guide 98-1 Uncertainty of Measurement, Switzerland: ISO, 2009.
- G. G. Jing, “How to measure test repeatability when stability and constant variance are not observed” International Journal of Metrology and Quality Engineering, vol. 9, Article 10, 2018. https://doi.org/10.1051/ijmqe/2018007
- Agilent, Fundamentals of RF and Microwave Power Measurements (Part 4), Agilent Technologies USA, 2006.
- T. J. Rouphael, Wireless Receiver Architectures and Design Antennas, RF, Synthesizers, Mixed Signal, and Digital Signal Processing, Academic Press, 2015
- M.H. Tan, B.H Ahmad Yusairi, S. Mohd Rizal, “An Analysis for 2.4mm-2.4mm RF Connector Insertion Loss Measure From 45MHz Until 50GHz by Using Electronic Calibration Module and Mechanical Calibration kits in a Network Analyzer,” in MIMT 2016, Cape Town South Africa. https://doi.org/10.1051/matecconf/20165403006
- M.H. Tan, B.H Ahmad Yusairi, “Radio Frequency Connector Insertion Loss Measured From 300 kHz Until 8.5 GHz By Using Network Analyzer And Meachnical Calibration Kits,” in Journal Of Engineering Science and Technology, 1587-1600, 2019. https://doi.org/10.5281/zenodo.3590276
- D.A. Nix, A.S. Weigend, “Estimating the mean and variance of the target probability distribution,” in ICNN’94, 374138, 1994. https://doi.org/10.1109/ICNN.1994.374138
- X. Wan, W. Wang, J. Liu, T. Tong, “Estimating the sample mean and standard deviation from the sample size, median, range and/or interquartile range,” in BMC Medical Research Methodology, vol. 14, Article 135, 2014. https://doi.org/10.1186/1471-2288-14-135,
- Agilent, Fundamentals of RF and Microwave Power Measurements (Part 2), Agilent Technologies USA, 2006.
- National Instruments, Specifications PXIe-5632 8.5 GHz Vector Network Analyzer, National Instruments USA, 2018.
- Mills et. Al, Study of Proposed Internet Congestion Control Mechanisms, NIST Special Publication 500-282 USA, 2010.
- S. Bell, Beginner’s Guide to Uncertainty of Measurement, National Physical Laboratory UK, 2001.
- Agilent, Fundamentals of RF and Microwave Power Measurements (Part 3), Agilent Technologies USA, 2003.
- S. Bell, Good Practice Guide No. 11 The Beginner’s Guide to Uncertainty of Measurement, National Physical Laboratory Issue 2 UK, 2001.
- Kuyatt, B. N. Taylor, E Chris, Guidelines for Evaluating and Expressing the Uncertainty of NIST Measurement Results, National Institute of Standards and Technology USA, 1994.
- G. L. Harris, Selected Laboratory and Measurement Practices and Procedures to Support Basic Mass Calibrations, National Institute of Standards and Technology USA, 2019.
- D. Flack, Measurement Good Practice Guide No. 130 Co-ordinate measuring machine task-specific measurement uncertainties, National Physical Laboratory UK, 2013.
- R. Lindsay, Understanding Measurement Uncertainty in Power Measurement, Anritsu Company USA, 2015.
- Jones, G. Davis, Ralph, Sound Reinforcement Handbook Second Edition, Hal Leonard Corporation USA, 1989.
Citations by Dimensions
Citations by PlumX
Google Scholar
Scopus
Crossref Citations
- J. E. Basurto Rangel, M. F. J. Cepeda Rubio, G. D. Guerrero López, J. I. Hernández Jácquez, F. Flores García, R. H. Sandoval Rodríguez, A. Vera Hernández, L. Leija Salas, "Comparison of a High-Precision and a Low-Cost VNA for Breast Cancer Ablation Studies." In 2025 Global Medical Engineering Physics Exchanges/ Pan American Health Care Exchanges (GMEPE/PAHCE), pp. 1, 2025.
- Tan Ming Hui, Ahmad Yusairi Bani Hashim, Mohd Rizal Salleh, "Evaluation of Type A Uncertainty in a Network Analyzer From 300 kHz to 8.5 GHz." Advances in Science, Technology and Engineering Systems Journal, vol. 5, no. 3, pp. 226, 2020.
No. of Downloads Per Month
No. of Downloads Per Country