
Review on Smart Electronic Nose Coupled with Artificial Intelligence for Air Quality Monitoring
Volume 5, Issue 2, Page No 739-747, 2020
Author’s Name: Rabeb Faleh1,a), Souhir Bedoui2, Abdennaceur Kachouri2
View Affiliations
1Computer and Engineering Networks Department, College of Computer and Information Sciences, Jouf University, Sakaka, Saudi Arabia
2Laboratory of Electronics and Information Technologies, Department of Electrical Engineering School of Engineering of Sfax, Sfax University, Sfax, Tunisia
a)Author to whom correspondence should be addressed. E-mail: rfhmidi@ju.edu.sa
Adv. Sci. Technol. Eng. Syst. J. 5(2), 739-747 (2020); ![]() DOI: 10.25046/aj050292
DOI: 10.25046/aj050292
Keywords: E-nose, Artificial intelligence algorithms, Gas sensors, Pollution detection, Ensemble classifier

Export Citations
With the advent of the Internet of Things Technologies (IOT), smart homes, and smart city applications, E-Nose was created. Almost of gas sensors consisting the electronic nose system suffer from cross sensitivity and lack of selectivity. Coupling smart gas sensors with artificial intelligence algorithms can thus empower conventional gas sensing technologies and increase accuracy in gas detection. This study describes the overall types of smart gas sensors used in air quality control, signal pre-processing and extraction features. Also it presents pattern recognition methods used in E-nose applications including linear methods such as Linear Discriminant Analysis LDA, K-Nearest Neighbors KNN and Non-linear such as algorithms Support vector Machine SVM and Artificial Neural Network ANN and their impact on improving accuracy rate for gas detection. Finally, this paper summarizes by providing directions for about how to leverage the benefits of combining these classifiers which is known as Data fusion approach and ensemble classifiers.
Received: 13 February 2020, Accepted: 10 April 2020, Published Online: 20 April 2020
1. Introduction
Nowadays, with the advent of the Internet of Things (IOT), Society is interconnected with smart cities and the smart industry due to smart sensor growth. Among these sensors, smart gas sensors have been growth in many applications: food quality testing [1], environmental safety monitoring [2], Disease diagnosing [3], detecting the fresh vegetables freezing time [4].Also, smart gas sensors corporate with smart home and building application such as gas leakage [5].
One of the most issues in our life which is hazardous to our health is air pollution. Many works based on this field and created new instruments for monitoring the air quality [6], [7]. Due to its low cost, small size, robustness, the electronic nose approach is considered the most promising method among gas detection methods in several fields.
Electronic nose (E-nose) is mimicking the human olfactory system [8]. The e-nose system consists of two important elements: the hardware component that is an array of gas sensors coupled with the software component that is pattern recognition methods. They are one of the most relevant artificial intelligence systems. The gas sensor array is made from different materials including thin metal oxide films, nanowires, and nanotubes. For each gas each sensor gives a different response. The collection of signals emitted by sensors that are exposed to the sample is called “cross selectivity” of the sensors, allowing a “fingerprint” to be formed and also called signature. All of the signatures constitute a database. Instead, these signatures demand that data processing methods be used to group gases into different groups. The gas identification process can be divided into four successive stages: Signal preprocessing, dimensionality reduction, classification, and validation. The preprocessing stage is often used to specify a certain number of parameters which are descriptive sensor response array [9]. Though pre-processing is based on the underlying sensor technology. At this point there are three general steps: simple manipulation, compression and normalization [10].Principal Component Analysis is used for dimensionality reduction. This method is widely used in gas identification system and olfaction machine [11].
On the other hand, enhancing smart electronic nose performance is heavily dependent on the pattern recognition scheme in use. Artificial intelligence and machine learning algorithms are used to achieve successful discrimination, and pollutant gas detection.
Some machine learning models have recently been explored in E-Nose applications. They can be divided into two categories. The first one is linear such as k-nearest neighbor (KNN) [12], linear discriminant analysis (LDA) [13]. The second one is nonlinear classification models such as the multilayer perceptron (MP) [14], radial basis function neural network (RBFNN) [15] and decision tree (DT) [16]. Support vector machine (SVM) is a promising classifier that has been widely applied in gas identification due to its kernel functions which solve non-linear problems [17].
In addition to individual classifiers, classifier ensemble has attracted considerable attention for E-nose pattern recognition [18].Classifiers combination takes advantages of used individual classifiers to improve gas identification accuracy.
This review provides a summary of recent classification algorithms used in gas detection coupled with E-nose approach and the pertinent researches published in recent years in this field. The remainder of this paper is organized as follows: Section 2 presents a literature review on smart technologies for air quality monitoring and artificial intelligence algorithms. Section 3 exhibits related works about gas sensors and data preprocessing. Section 4 presents finding and discussion. Section 5 is a conclusion to summarize smart electronic nose investigation.
2. Literature review
Smart Cities applications are an important field of interest. Such technologies will be categorized into different categories by Smart Energy, Smart Lighting, Smart Transportation, Smart Parking, Smart Driving, Smart Buildings and Towns, Smart Grid, Smart Health and Smart Environment.
The notion of dedicated and non-dedicated sensors in smart city was introduced by authors in [19]. The first sort of compound sensors dedicated to a particular mission, including ambient sensors. Non-dedicated sensors are called embedded smartphone sensors such as accelerometer, gyroscope, GPS, microphone, and camera. The last form can be used for various applications. Derek Doran et al. described how people can be in use as human sensors to provide specific sources of information for smart cities. Authors developed a methodology to show how human sensors can support smartphones and other mobile devices through the provision of data streams [20].
For example, the authors in [21] identified an approach to energy sensing for Smart Buildings and Houses. The attitude consisted of voltage noise signatures or voltage signatures to categorize the operation of various devices and to note the similarity or difference between the harmonics ‘spectral envelope and existing templates.
In this paper we will concentrate on Smart Environment sensing technologies more precisely pollution sensing technologies.
Regarding the harmful effects of polluting air, environmental control remains a significant challenge. This control involves expensive and fairly complex techniques. Hence the idea of designing an electronic nose is also called an artificial nose. Among smart sensing technologies, electronic nose (e-nose) can greatly enhance human quality of life. E-nose is an instrument capable of detecting odors and of distinguishing them. It consists of odor-sensitive sensors, a signal conditioning system and applications for data processing [22].
As shown in Figure 1, Gardner et al [23] identified an electronic nose as four main components. Next, a diffusion device that transfers air inside the instrument to be checked from the outside, then a chamber that contains the sensors, a signal processing device and a simple software for identification and classification.
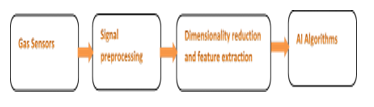 Figure1. Smart electronic nose system structure diagram
As seen in the figure1, Sensor array is the key component in electronic nose. Choice of materials is very important. The most used type is metal oxide MOX gas sensors [24]-[28] for different reasons. In fact MOX sensors have a very high sensitivity to various gases [29].
2.1. Feature extraction and dimensionality reduction
The most adopted data analysis method for reduction dimensionality is principal component analysis (PCA) which ps linear and unsupervised method [30]. PCA is a statistical tool allowing simple visualization of all related information. The PCA pathway includes as follows five phases [31]:
We typically have a data matrix of n observations on p correlated variables
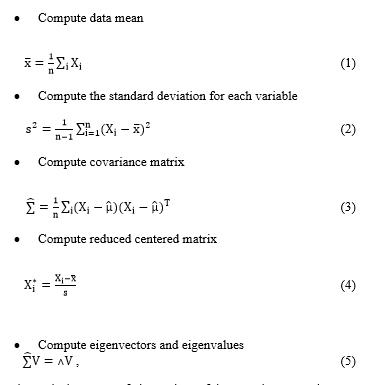 where˄ is the vector of eigenvalues of the covariance matrix.
Order eigenvalues in descending order λ1>……>λP
We note PC1, PC2…, PCk… PCq the main component principal such that each has a linear combination of the original X1… Xp
![]() The ujk coefficients are calculated in such a way that all PCk is 2-2 uncorrelated variance and a maximum decreasing significance.
The ujk coefficients are calculated in such a way that all PCk is 2-2 uncorrelated variance and a maximum decreasing significance.
Main component characteristics are defined as follows: The first factor extracted in a main factor analysis typically accounts for a large amount of total variance in the observed variables. The second component will reflect a certain amount of variance in the data set which was not taken into account by the first component. It is going to be uncorrelated to the first part too. Components 1 and 2 are designed to have a zero association. The two axes obtained after running PCA, called main components, correspond to the highest individual values and contain most of the information. The main components contain the greatest variance of data, and are orthogonal.
Therefore, the percentage of the data variance expressed by each main component is determined using the corresponding own value.
The new set of data obtained with the linear orthogonal transformation was drawn in two or three dimensions, with the most important data set. Thus, PCA avoids consistency of the data and reduces the high dimensionality to smaller dimensions. However this method can’t discriminate between gases classes. For this reason, we remedy this problem by using different AI algorithms.
2.2. AI algorithms and pattern recognition
After extracting from the sensor signal the most significant parameters, the data generated by a sensor array is grouped into a set of semi-, which are the output of the sensor array and a set of dependent variables. This data will be used by pattern recognition methods to identify detected gases [32].Initially, electronic nose algorithms consist of three stages: drift calibration algorithms, preprocessing and extraction characteristics of signal, and methods for data analysis and classification with artificial intelligence algorithms [33].
Artificial intelligence algorithms can be divided into linear /non-linear algorithms considering that classification methods are supervised. The unsupervised methods are used for feature extraction and selection.
The methodology for the supervised multivariate analysis involves the labeling of the observations; a priori all the easily determined results are known. It is composed of two separate processes [34]:
- Training stage: This process is often carried out in the lab. It consists of building the prediction model with known X data, independent of the sensor response and the corresponding measured Y data.
- Evaluation test: In this step only the variables Y are computed. The X variables are calculated using the model that was constructed during the learning process. They test the exactness and efficiency of the model.
2.2.1. Linear classification methods
Linear classification methods include linear discriminant analysis LDA, k-Nearest Neighbors (KNN) and Support vector machine (SVM) can train and identify high dimensional samples in gas recognition.
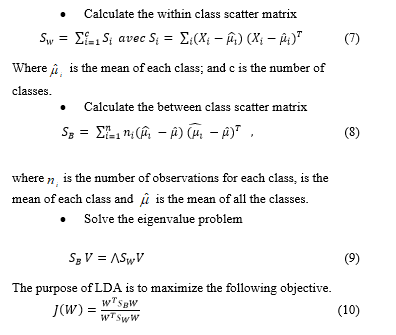
Like Principal Component Analysis (PCA), Linear Discriminant Analysis LDA is a dimension reduction factorial tool for exploring explanatory variables. It is used to view individual classes in an optimized graphic form. It is based upon Fisher’s work in 1936.
Unlike PCA, LDA is a supervised dimension reduction process, which is based on each individual’s quest for membership in a class specified a priori. The variables that classify individuals are a fortiori quantitative variables, while a qualitative variable defines the classes. LDA is in fact proposing two approaches: the first is concise. The second is predictive; it consists of deciding the class of allocation of n new individuals as defined by the same explaining variables.
Basic steps involved in the LDA algorithm:
 Implementing a K-Nearest Neighbors (KNN) classification model is simple, since it does not implement any learning function. The only metrics involved are the number K of the closer elements and the distance between the elements which we desire to classify [35]. It is necessary to choose distance so that the device works properly. The simplest distances allow for the achievement of satisfactory results. Euclidean distance, or Manhattan distance, is widely used to measure training sample similarity X = {X1, X2, X3… Xn} to forecast data x = {x1, x2, x3… xn}.
- Support vector machine (SVM) is intended primarily for binary forecasting, i.e. two-class discrimination. Multi-class models were therefore built to understand more complex cases involving more than two classes. It is based on “kernel methods,” which allow optimum separation of the data.
- SVM algorithms are very powerful for the identification of classesSVM determines the optimal hyperplan split between the groups to optimize the margin. There are two cases presented: linearly separable and nonlinear. Basic steps in the SVM algorithm; For the linearly separable case, the hyper plan has Equation (1).
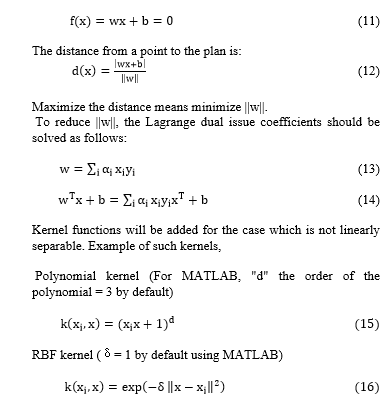 Kernel functions will be added for the case which is not linearly separable. Example of such kernels,
Polynomial kernel (For MATLAB, “d” the order of the polynomial = 3 by default)
RBF kernel (δ= 1 by default using MATLAB)
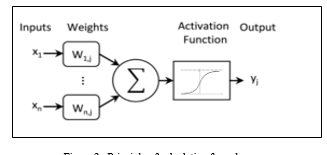 Figure 2. Principle of calculating formal neuron
2.2.2. Non-linear classification methods
Many researchers have created the Artificial Neural Network (ANN) because of its benefits of enhanced Big Data. It imitates the human brain, and solves several practical problems in different fields [36]. ANN performs its tasks as follows: As shown in Figure 2, each neuron receives and adds the signal from the previous layer that has a weight relation, compares weighted sum to threshold values and generates outputs by activation function such as sigmoid function, radial basis [37]. There are two simple separate single layer and multilayer versions. All essential layers are interconnected in the first one. Within the second model, which is the multilayer structure, is divided into a layer of input, hidden layer, and layer of output. The number of hidden layers affects precision in classification and prediction [38].
For quantitative discrimination, MLP was used in many researches. V. Krivetskiy et al. [39] demonstrated in their research the identification of individual gasses by a single sensor, combined with methods for pattern recognition. Supervised learning algorithms were used to solve the classification problem: random forest, vector support machines (SVM), multilayer perceptron (MLP), (with one or two hidden layers). Only MLP had been used to solve the quantification problem. As an ANN disadvantage this requires a long period of training. To solve this problem, an algorithm named ELM has been proposed [40]. This is an algorithm of fast learning to feed the neural networks (SLFNs) into a single hidden layer. Instead of iterative tuning the output weights are generated randomly by the hidden node parameters. ELM’s run time is therefore fast and demonstrates dominance over other classifiers [41]. The classification efficiency is clearly influenced by the parameters of the algorithm. Meanwhile, ELM’s randomly generated input weights and hidden layer biases can make the algorithm unstable. Chao Peng et al[42] proposed an ELM-based Kernel Extreme Learning Machine (KELM) in combination with kernel functions for VOC detection to solve this problem. It was compared against SVM, KNN, and LDA. The results show that the KELM achieves the highest precision performance of about 95%.
Supervised methods are dedicated to quantitative classification such as the Linear Discriminant Analysis (LDA), Support Vector Machine (SVM) and the K-Nearest Neighbor method (KNN). It remains to be noted that artificial neural networks (ANN) are the most complex methods in terms of execution time and ease of implementation. ANN has been especially effective in predicting and classifying complex gas mixtures. In [43], researchers use ANN to model fuel-gas methanol output. A comparison of the main algorithms used for gas detection has been given in table1.
Table 1: Sample Table
| parameters | Classification algorithm | |||
| LDA | KNN | SVM | ANN | |
| Interpretation simplicity | + | ++ | ++ | – |
| Ease of impelmentation | + | ++ | ++ | – |
| Execution Time | + |
++ |
+ | — |
| Classification quality | ++ |
+ |
++ | ++ |
Very poor (–); poor (-); good (+); strongly good (++)
3. Related works
The main component for an electronic nose is a gas sensor array. A sensor for MOX gas is composed of many layers. First of all, a silicone substrate is mounted on which is the dielectric membrane. The silicon oxide layer [44] or silicon oxide and silicon nitride bilayer will make up this membrane [45, 46]. His function is to thermally insulate between the substrate and the sensitive layer [47]. Then the micro hotplate enables the detection of gaseous substances to exceed high temperatures. [48]. A Silicon Oxide passivation layer is deposited to separate the micro hotplate from the sensitive layer. The function of Sensitive layer is to react with the gaseous material. Tin oxide (SnO2), tungsten oxide (WO3) and zinc oxide (ZnO) are the most common and widely used metal oxides [49, 50].
Tungsten oxide (WO3) is very suitable for gas controlling applications [51, 52]. Take this latter material, for example, which is especially sensitive to ozone [53], A large number of researchers developed and tested a WO3 gas sensor to detect various gases, such as NO2, where it was shown that the optimum working temperature for detecting this gas was approximately 225 ° C [54] and H2 where the best annealing temperature was just about 500 °C [55].
In [56], Joy Dutta et al proposed an Air Quality Monitoring System AQMD for tracking urban air pollution. They used two MQ135 and MQ7 air quality sensors, connected to an Arduino board that interacted with the Bluetooth module HC-05. Data were then moved to smartphones. Collected information from various users of smartphones then shaped the city’s air quality index map for the outdoor and indoor environments.
Authors at [57] studied over a 20-day period the relationship between human activity and environment. Data from environmental monitoring stations and mobile networks is compiled to assess the air quality and weather. Consequently, authors demonstrated that stronger environmental analysis was achieved by incorporating information from various sources into sensing.
Persaud et al [58]’s application is to use a system that consists of polymer gas and quartz microbalance sensors to monitor the air quality in real time. This smart gas pump has been demonstrated for years to achieve and to detect complex mixtures of volatile substances.
The number of smart city electronic nose network applications is growing ever more. In 1995[59] Hodgins evacuated the first electronic nose research with the purpose of separating ethanol, dimethyl sulfide and diacetyl from water mixtures using CP sensors.
Authors in [24] studied an electronic nose response based on SnO2 thin dioxide sensors to identify the presence of various gases such as CO, CH4, ISBU and EtOH with different concentrations ranging from 100ppm to 1000ppm. Results showed that the system can detect and recognize gasses with an error of less than 15%.
The ability of the electronic nose to identify and distinguish concentrations as low as 20 ppm for NO2 and 5 ppm for CO was demonstrated in [25]. The main objective was to perform the indoor air quality control IAQ. Authors proposed an electronic nose based on an integrated gas sensor array and highly efficient pattern recognition techniques for the quantification of carbon monoxide and nitrogen dioxide in mixtures of relative humidity and volatile organic compounds. The unit was composed of a metal oxide resistive sensor array, due to its low power consumption at high temperature and high sensitivity. Authors used a flimsy logic system. The goal was to extract the notable information from the response of the sensor array. The machine was able to distinguish and classify the presence of each pollutant in the test area, as well as their mixture.
Features selection is the key step in the classification scheme, which selects a subset from the original functions. In this context, Principal component analysis method was severely applied in the area of pollution monitoring.
For example, the overall objective of [60] was to apply a main component analysis (PCA) to air pollution data in order to provide a comprehensive definition of components that can be interpreted in terms of various air pollution sources and to investigate whether cause-specific daily mortality can be attributed to specific air pollution sources.
In [61] Wu and Kuo used data on air quality collected from eight automated air quality monitoring stations in central Taiwan and examined the connection between air quality variables and statistical analysis in an attempt to accurately represent the difference in air quality observed by each monitoring station and to create a suitable air quality classification system for the whole of Taiwan. The authors in[62] suggested a framework for defining and allocating sources of air pollution in an urban site in France. Using the key component analysis, the identification of the source profiles was achieved. In [63], PCA was used to compare air pollutions profiles of cities. PCA was applied in a study by [64].
However this method can’t discriminate between gases classes. For this reason, we remedy this problem by using different AI algorithms.
For the pattern recognition stage, Hui et al [65], used LDA to detect and identify four different industrial gases, which achieved high classification rate and satisfactory predictive ability.
Researchers at [66] have used fishery LDA to classify mutton duck adulteration. For qualitative and quantitative analysis this approach was used. Mahdi Ghasemi et al.[67] suggested LDA as one of the discriminating methods for distinguishing and classifying various varieties of both grown and wild black caraway and cumin. The results show that LDA displays the highest precision performance near 100%.
In [68], wavelet energy has been extracted from the responses of e-nose and e-tongue for the classification of different grades of Indian black tea. Results confirm that classification rate using KNN have improved reaches 99.75%.
Researchers at [69] built on the Zynq platform a quick prototyping of the KNN-based gas identification system. For k = 1 and k = 2 the best results were obtained with a classification accuracy of 97.91 percent and 98.95 percent respectively. For example, a good k can be chosen via various heuristic techniques, such as cross-validation[70]. The value of k should be chosen on the basis of which classification error is minimised.
In comparison, KNN’s biggest drawback is that after the training stage it is considered a slow learner. It does need an extensive test level, though. In order to address this problem, Mehmet Aci et al[71] proposed a hybrid classification system of k closest neighbour, Bayesian methods and genetic algorithm to solve these drawbacks by removing data that makes learning difficult.
Researchers in [72] have implemented hybrid KNN (HBKNN) classification approaches, which perform classification in high-dimensional space on the datasets with noisy attributes.
According to some researchers, they are outperforming many of the common methods of gas classification [73, 74]. Kyu-Won Jang et al[75] implemented a pairing plot scheme to classify gas form with SVM more effectively to detect CH4 and CO. Apart from the classification task, the difficulty of machine learning methods is to estimate gas concentration or unknown gas concentration. In this context, researchers [76] applied Least-Squares Support-Vector-Machine-based (LS-SVM-based) nonlinear regression to determine the gas concentration of each constituent in a mixture.
SVM presents a considerable attention in gas classification in real time [77, 78]. R Faleh et al [52] showed in their research that successful classifications have been reached in the discrimination of three kinds of oxidizing and reducing gas using support vector machine.
In their research, Helli et al[26] used an electronic nose consisting of six Tagushi Gas Sensors for metal oxide (TGS-800, -813, -822, -825, -832, -2105) to track two gas forms: a reducing gas H2S and an oxidizing gas NO2. By applying Discriminant Factorial Analysis (DFA), they researched the capability of the sensor networks to detect the presence of these two gases in mixture or alone. This approach was applied to a complex reference atmosphere containing CO2 and some humidity levels. DFA has proved to be a strong discriminator between different groups (H2S, NO2 and H2S / NO2 mixtures) and even between different concentrations for a single group.
The main research goal in [27] was to build an electronic nose containing five gas sensors (TGS 822, TGS 2442, TGS 813, TGS 4160, TGS 2600), a temperature sensor, a humidity sensor, and wind speed measurements to monitor carbon monoxide, carbon dioxide (CO, CO2) gasses for three different regions of Alexandria-Egypt along the Corniche River and two different rivers. The sensor array had been attached to a 16F628A microcontroller. After that, data clustering was implemented to investigate the relation between measurements from different sensors. Variance analysis (ANOVA) has been used to track critical variables which are to be inserted into the regression equation. Results showed that the electronic nose was able to prove that the Corniche Street was the least polluted place while the most polluted was Abukir Street.
In research[79] Loutfi et al combined mapping of gas distribution with the definition of odors. The system is fitted with two electronic noses gathered into a handheld robot. The classification performance of ethanol and acetone in indoor experiments ranged from 88 to 100 per cent was very high.
In [80], authors analyzed the performance of the three electronic nose systems based solely on semi-conducting gas sensors (TGS880, TGS2600, and TGS1331), amperometric gas sensors (H2S-B4, CO-B4, 7SH CiTiceL) and both types of outdoor air quality sensors. They then compared the predictive potential of the e-noses gas concentration of four environmental gases, namely nitrogen dioxide, sulphur dioxide, ozone and carbon monoxide, with reference data from the air control system’s stationary station. They concluded that the best results for prediction are obtained by integrating both types of sensors.
4. Findings and discussion
In the above subsections, we have provided a detailed overview of individual classifiers such as SVM, KNN, ANN and ELM. Each of these algorithms has their problems. However, by combining certain processes, we can maximize the full benefits.
The data fusion or mixture of data is implemented to a wide variety of fields. To take an example: the human body, the human brain permanently merges knowledge from an object in order to determine its property.
In general, data fusion methods can be classified into three levels; low abstraction level, intermediate level and high level.
In order to determine the accuracy of agricultural and industrial olive oil samples, Natale et al.[81] have introduced two electronic nose systems based on specific sensor technologies (quartz resonators and metal oxide chemoreceptors). Researchers indicated that data fusion for the two abstraction levels: high (fusion of the key components) and low (fusion of sensor data) indicates that cooperation was formed from commercial samples between the two matrixes of animal product detection outcomes.
Pardo et al.[82] simultaneously used MOX sensors to measure more than one sensor property (i.e., conductivity and surface potential) with other types of sensor gases. This included the use of various types of sensors (so-called hybrid matrix) to reduce the linearity of the response and, therefore, achieve better discrimination.
A hybrid electronic nose (6 voltammetric and 15 potentiometric sensors) was used by Gutierrez et al.[83] to differentiate beer forms using data fusion and pattern recognition methods (PCA and LDA). They indicated that in comparison with the simple E-tongue, the performance of hybrid E-language systems using the latest approach of data fusion from different sensor types is more accurate.
Ensemble classifier is considered a mixture of a high level; an overall decision is made by merging the decisions of the classifiers used. This combination of classifiers can improve classification. Fusion requires modification of a learning ensemble to promote better classification accuracy. In other words, it is desirable to design and build a classification system using various combination classifiers to boost the overall classification accuracy.
Lijun Dang et al [84] have proposed a new fusion approach that carries out an efficient weighted base classifier process called an enhanced support vector machine ensemble (ISVMEN). Results show that the average accuracy of classification was increased from less than 86 % to 92.58% percent relative to that of base classifiers.
A novel hybrid approach to solving the problem of cross-selectivity of gases in electronic nose (E-nose) using the combination classifiers of support vector machine (SVM) and k-nearest neighbor (KNN) methods was proposed in research by R.Faleh et al [85]. The new coordinates calculated by PCA were used as inputs for classification by the SVM method. Finally, the classification achieved by the KNN method was carried out to calculate only the support vectors (SVs), not all the data. The proposed fusion approach has been shown to lead to the highest classification rate relative to the accuracy of the individual classifiers: KNN, SVM-linear, SVM-RBF, and SVM-polynomial.
The combination of SVM, PNN and LDA was shown a high accuracy rate compared to classification results obtained with individual classifiers [86]. Experimental findings show that the optimized Adaboost. M2 model, which solves a multi-class identification problem for Chinese herbal medicine, combined with SVM, PNN and LDA, achieves the best 91.75 %accuracy, compared to 87.62 % of the best single classifier SVM.
The above discussion shows that using multiple classifiers together lead to get maximum benefits in various applications.
5. Conclusion
Health and environmental effects whose origin is liability to air pollution requires monitoring and controlling air quality parameters. In this way we present this review summarizing various sensing technologies for air quality supervising. This paper was devoted primarily for Electronic nose technology. Metal oxide Gas sensor was then presented with different layers consisting a gas sensor. Signal processing for feature extraction based on PCA was then introduced. In addition, gas pattern recognition technology based on machine learning were detailed and compared. Finally, ensemble classifier notion was discussed as a solution to improve classification accuracy.
- Apetrei,C; VirginiaBounegru,V,” Electronic Noses and Traceability of Foods”, Reference Module in Food Science, 2020
- Chen ,K; Gao W; Emaminejad S, et al. “Printed carbon nanotube electronics and sensor systems”. Adv Mater, 2016,Vol.28, 4397, doi:10.1002/adma.201504958
- Wilson, A. “Application of electronic-nose technologies and VOC-biomarkers for the noninvasive early diagnosis of gastrointestinal diseases”. Sensors 2018, 18, 2613,doi: 10.3390/s18082613
- Liu, L.; Li, X.; Li, Z.; Shi, Y. “Application of Electronic Nose in Detection of Fresh Vegetables Freezing Time Considering Odor Identification Technology”. Chem. Eng. Trans. 2018, 68, pp.265–270
- Zampolli ,S; Elmi ,I; Ahmed, F et al. An electronic nose based on solid state sensor arrays for low-cost indoor air quality monitoring applications. Sens Actuators B, 2004, 101, 39,doi: 10.1016/j.snb.2004.02.024
- Pangestu,E; Wonohardjoa, Gede Putra Kusumaa,” Air Pollution Mapping using Mobile Sensor Based on Internet of Things”, Procedia Computer Science , ,2019,Vol.157,pp.638–645,doi: 10.1016/j.procs.2019.08.224
- Harrou, F.; Dairi, A.; Sun, Y.; Kadri, F. “Detecting Abnormal Ozone Measurements With a Deep Learning-Based Strategy”. IEEE Sens. J. 2018, 18, 7222–7232, doi:10.1109/JSEN.2018.2852001
- W. Gardner and P.N. Barlett “A brief history of the electronic noses” Sensors and Actuators B 18-19 (1994) 211-220,doi: 10.1016/0925-4005(94)87085-3
- Pardo, M.; Sberveglier, G. “Comparing the performance of different features in sensor arrays”, Sensors and Actuators B (2007) pp 437–443,doi: 10.1016/j.snb.2006.09.041
- O.Duda,P.E.Hart and D.G.Stork,Pattern Classification,John Wiley&Sons,INc,New York,2000
- Grandjean et al. EXAFS and XANES,” study of a pure and Pd doped novel Sn/SnO xnanomaterial”,.J. Phys. Chem. B, (2004), pp. 8876- 8887,doi: 10.1021/jp0370627
- Ali, A.A.S.; Akbar, M.A.; Amira, A.; Bensaali, F.; Benammar, M.; Hassan, M.; Bermak, A. Fast Prototyping of KNN Based Gas Discrimination System on the Zynq SoC. Qatar Found. Annu. Res. Conf. Proc., 2016, ICTOP1832, 10.5339/qfarc.2016.ICTOP1832
- Xiong, Y.; Xiao, X.; Yang, X.; Yan, D.; Zhang, C.; Zou, H.; Lin, H.; Peng, L.; Xiao, X.; Yan, Y.”Quality control of Lonicera japonica stored for different months by electronic nose”. J. Pharm. Biomed. 2014, 91, 68–72, 10.1016/j.jpba.2013.12.016
- Fayçal Benrekia , Mokhtar Attari and Mounir Bouhedda, “Gas Sensors Characterization and Multilayer Perceptron (MLP) Hardware Implementation for Gas Identification Using a Field Programmable Gate Array (FPGA)”, Sensors 2013, 13, 2967-2985; doi:10.3390/s130302967
- Saraoglu, H.M.; Selvi, A.O.; Ebeoglu, M.A.”Electronic nose system based on quartz crystal microbalanceb sensor for blood glucose and HbA1c levels from exhaled breath odor”. IEEE Sens. J. 2013, 13, 4229–4235,doi: 10.1109/JSEN.2013.2265233
- Jung Hwan Cho, Pradeep U. Kurup,” Decision tree approach for classification and dimensionality reduction of electronic nose data”, Sensors and Actuators B: Chemical Volume 160, Issue 1, 15 December 2011, Pages 542-548,doi: 10.1016/j.snb.2011.08.027
- Acevedo F., Maldonado S., Dominguez E., Narvaez A., Lopez F. Probabilistic support vector machines for multi-class alcohol identification. Sens. Actuators B Chem. 2007;122:227–235. doi: 10.1016/j.snb.2006.05.033
- Dietterich, T.G. (2000), “Ensemble methods in machine learning”, 1st International Workshop On Multiple Classifier Systems, Springer, Cagliari, pp. 1-15.
- HadiHabibzadeh, Zhou Qin, TolgaSoyata and BurakKantarci, Large Scale Distributed Dedicated- and Non-Dedicated Smart City Sensing Systems, doi: 10.1109/JSEN.2017.2725638, IEEE Sensors Journal
- Derek Doran, SwapnaGokhale and Aldo Dagnino, Human Sensing for Smart Cities, 2013 IEEE/ACM International Conference on Advances in Social Networks Analysis and Mining, ASONAM’13, August 25-29, 2013, Niagara, Ontario, CAN Copyright 2013 ACM 978-1-4503-2240-9 /13/08 .
- Froehlich, J.; Larson, E.; Gupta, S.; Cohn, G.; Reynolds, M.; Patel, S. Disaggregated End-Use Energy Sensing for the Smart Grid. IEEE Pervasive Comput.2011, 10, 28–39.
- Bedoui et al. Electronic Nose System and Principal Component Analysis Technique for Gases IdentificationAdvances in Systems, Signals and Devices, Volume 6, 2018, pp. 167-180. https://doi.org/10.1515/9783110448375-011
- Gardner, J.W.; Bartlett, P.N. A brief-history of electronic noses. Sens. Actuators B Chem. 1994, 18, 211–220.
- Negri, R.M.; Reich, S. Identification of pollutant gases and its concentrations with a multisensory array. Sens. Actuators B Chem. 2001, 75, 172–178. doi:10.1016/S0925-4005(01)00543-3
- Zampolli et al. An electronic nose based on solid state sensor arrays for low-cost indoor air quality monitoring applications/ Sensors and Actuators B 101 (2004) 39–46. doi:10.1016/j.snb.2004.02.024
- Helli, O.; Siadat, M.; Lumbreras, M. Qualitative and quantitative identification of H2S/NO2 gaseous components in different reference atmospheres using a metal oxide sensor array. Sens. Actuators B Chem. 2004, 103, 403–408. doi:10.1016/j.snb.2004.04.069
- IMAN MORSI, Electronic Noses for Monitoring Environmental Pollution and Building Regression Model, 978-1-4244-1766-7/08/$25.00 ©2008 IEEE
- Ozmen Edward J. Wolfrum,∗, Robert M. Meglen, Darren Peterson, Justin Sluiter, “Metal oxide sensor arrays for the detection, differentiation, and quantification of volatile organic compounds at sub-parts-per-million concentration levels”, Sensors and Actuators B 115 (2006) ,pp.322–329, 10.1016/j.snb.2005.09.026
- Wang, C., Yin, L., Zhang, L., Xiang D. and Gao. R., “Metal Oxide Gas Sensors: Sensitivity and Influencing Factors”, Sensors, Vol: 10, No: 3, pp. 2088-2106, 2010,doi: 10.3390/s100302088
- Ozmen A, Dogan E. “Design of a portable e-nose instrument forgas classifications”. IEEE Trans InstrumMeas, 2009, 58, 3609, 10.1109/TIM.2009.2018695
- W. Gardner and P.N. Barlett “A brief history of the electronic noses” Sensors and Actuators B 18-19 (1994) 211-220
- Simon M. Scott, David James, and Zulfiqur Ali, “Data analysis for electronic nose systems,” Phil. Microchim Acta 156, 183–207 (2007)
- Zhesi Chen et al , “Smart gas sensor arrays powered by artificial intelligence”, Journal of Semiconductors, 2019, 40, 111601,doi: 10.1088/1674-4926/40/11/111601
- FALEH Rabeb, BEDOUI Souhir, KACHOURI Abdennaceur, SAMET Mounir “An electronic nose for detection pollutant odorant and olfaction classification using neural network”, 14th international conference on Sciences and Techniques of Automatic control & computer engineering -pp 174-178, , 2013M. Young, The Technical Writer’s Handbook. Mill Valley, CA: University Science, 1989.
- O.Duda,P.E.Hart and D.G.Stork,Pattern Classification,John Wiley&Sons,INc,New York,2000
- Casey, J.G.; Collier-Oxandale, A.; Hannigan, M. Performance of artificial neural networks and linear models to quantify 4 trace gas species in an oil and gas production region with low-cost sensors. Sens. Actuators Chem.
- 2019, Vol.283,pp. 504–514,doi: 10.1016/j.snb.2018.12.049 Shaobin Feng et al,” Review on Smart Gas Sensing Technology”, Sensors 2019, 19, 3760,pp. 10.3390/s19173760
- Casey, J.G.; Collier-Oxandale, A.; Hannigan, M. Performance of artificial neural networks and linear models to quantify 4 trace gas species in an oil and gas production region with low-cost sensors. Sens. Actuators Chem. 2019, 283, 504–514,doi: 10.1016/j.snb.2018.12.049
- Krivetskiy et al,”Selective detection of individual gases and CO/H2 mixture at low concentrations in air by single semiconductor metal oxide sensors working in dynamic temperature mode”,Sensors and Actuators B: Chemical ,Vol. 254, 2018, pp. 502-513, 10.1016/j.snb.2017.07.100
- Huang, G.B.; Zhu, Q.Y.; Siew, C.K. Extreme learning machine: Theory and applications. Neurocomputing 2006, 70, 489–501,doi: 10.1016/j.neucom.2005.12.126
- Qiu, S.; Gao, L.; Wang, J. Classification and regression of ELM, LVQ and SVM for E-nose data of strawberry juice. J. Food Eng. 2015, Vol.144,pp.77–85,doi: 10.1016/j.jfoodeng.2014.07.015
- Chao Peng et al ,” Enhancing Electronic Nose Performance Based on aNovel QPSO-KELM Model”,Sensors 2016, 16, 520,doi: 10.3390/s16040520
- Ye, J. Artificial neural network modeling of methanol production from syngas. Pet. Sci. Technol. 2019, 37, 629–632
- Saxena, G., and Paily, R., “Performance improvement of square microhotplate with insulation layer and heater geometry”, Microsystem Technologies. Vol: 21, No: 11, pp. 2331-2338, 2015.
- Rossi, P. Temple-Boyer, D. Estève, Sens. Actuators A Phys. 64, 241–245 (1998). https ://doi.org/10.1016/S0924-4247(97)01627 -0
- S. Lee, Y.H. Choi, M.Y. Jun, in Sensors, 2012 IEEE (2012). doi:10.1109/icsen s.2012.64114 04
- Bedoui, S. Gomri, H. Charfeddine Samet, A. Kachouri, in International Multi Conference on Systems, Signals & Devices (SSD) (2016). https doi:10.1109/SSD.2016.74737 12
- Kumar., K.K. Sing., N. Sood., A. Kumar. And R.K. Mittal.,“Design and Simulation of a Micro Hotplate for MEMS Based Integrated Gas Sensing System,” 978-1-4799-2179- 9/14/$31.00 ©2014 IEEE.
- Ahuja, R. Talwar, B. Prasad, Rev. ICRTEDC 1(2), 67–70 (2014)
- D. Kim, B.J. Kim, J.H. Yoon, J.S. Kim, J. Korean Phys. Soc. (2007). doi:10.3938/jkps.51.2069
- S. Lee, S. D. Han, J. S. Huh, and D. D. Lee, Sens. Actuat. B Chem., 60, 57 (1999). Doi:10.1016/S0925- 4005(99)00244-0]
- Rabeb Faleh ; Mehdi Othman ; Sami Gomri ; Khalifa Aguir ; Abdennaceur Kachouri,” A Transient Signal Extraction Method of WO3 Gas Sensors Array to Identify Polluant Gases”, IEEE Sensors Journal ,Volume: 16 , Issue: 9 , May1, 2016 ,doi: 10.1109/JSEN.2016.2521578
- Bendahan, R. Boulmani, J. L. Seguin, and K. Aguir, Sensor Actuat B-Chem., 100, 320 (2004). Doi:10.1016/ j.snb.2004.01.023]
- F. George, M.C. Leon, A. Ayo, B. Russell, Sensors (2010). doi:10.3390/s1006 05469
- Wongchoosuk, A. Wisitsoraat, D. Phokharatkul, A. Tuantranont, T. Kerdcharoen, Sensors (2010). Doi:10.3390/s1008 07705
- Joy Dutta, ChandreyeeChowdhury, Sarbani Roy, AsifIqbalMiddya, FirojGazi, Towards Smart City: Sensing Air Quality in City based on Opportunistic Crowd-sensing. ICDCN ’17, January 04-07, 2017, Hyderabad, India © 2017 ACM .ISBN 978-1-4503-4839-3/17/01…$15.00 doi:10.1145/3007748.3018286
- Sagl, G.; Blaschke, T.; Beinat, E.; Resch, B. Ubiquitous Geo-Sensing for Context-Aware Analysis: Exploring Relationships between Environmental and Human Dynamics. Sensors 2012, 12, 9800–9822,doi: 10.3390/s120709800
- C. Persaud, A. M. Pisanelli, S. Szyszko, M. Reichl, G. Horner, W. Rakow, H. J. Keding, and H. Wessels, “A Smart Gas Sensor for Monitoring Environmental Changes in Closed Systems: Results from the MIR Space Station,” Sensors and Actuators B: Chemical, vol. 55, 1999,doi: 10.1016/S0925-4005(99)00168-9
- Hodgins, D. The development of an electronic nose for industrial and environmental applications. Sens. Actuators B Chem. 1995, 27, 255–258,doi: 10.1016/0925-4005(94)01597-B
- CM Quant, PH Fischer, E Buringh, CB Ameling, DJM Houthuijs, FR Cassee “Application of principal component analysis to time series of daily air pollution and mortality ” RIVM report 650010035 /2003
- Edward Ming-Yang Wu and Shu-Lung Kuo “A Study on the Use of a Statistical Analysis Model to Monitor Air Pollution Status in an Air Quality Total Quantity Control District” atmosphere ISSN 2073-4433, 2013
- zegorzJasinski et al, Evaluation of the Electronic Nose Used for Monitoring Environmental Pollution, 2018 XV International Scientific Conference on Optoelectronic and Electronic Sensors (COE), 978-1-5386-4107-1/18/$31.00 ©2018 IEEE
- Marie Chavent, Herv_e Guegan, Vanessa Kuentz, Brigitte Patouille, Jérome Saracco “PCA and PMF based methodology for air pollution sources identi_cation and apportionment ” Environmetrics, Wiley-Blackwell, 20, pp.928-942. 2009
- Voukantsis1 , K. Karatzas1, J. Kukkonen, T. Räsänen, A. Karppinen, M. Kolehmainen “Inter-comparison of air quality data using principal component analysis, and forecasting of PM10 and PM2.5 concentrations using artificial neural networks, in Thessaloniki and Helsink” Published in Science of The Total Environment, 2011, 409(7), 1266- 76.
- Hui Li et al, “Classification and Identification of Industrial Gases Based on Electronic Nose Techonology”,Sensors 2019, 19, 5033; doi:10.3390/s19225033
- ang, Qe t al,” Adulterant identification in mutton by electronic nose and gas chromatography-mass spectrometer”. Food Control 2019, 98, 431–438.
- Mahdi Ghasemi-Varnamkhasti et al,“Differentiation of cumin seeds using a metal-oxide based gas sensor array in tandem with chemometric tools”,Talanta, doi:10.1016/j.talanta.2017.08.024
- Mahuya Bhattacharyya Banerjee et al, « Black Tea Classification Employing Feature Fusion of E-Nose and E-TongueResponses”,journal of food engineering JFOE 9409,2019, doi:10.1016/j.jfoodeng.2018.09.022
- Ali, A.A.S.; Akbar, M.A.; Amira, A.; Bensaali, F.; Benammar, M.; Hassan, M.; Bermak, A. Fast Prototyping of KNN Based Gas Discrimination System on the Zynq SoC. Qatar Found. Annu. Res. Conf. Proc. 2016
- Gutierrez-Osuna, R.; Nagle, H.T. A method for evaluating data-preprocessing techniques for odour classification with an array of gas sensors. IEEE Trans. Syst. Man Cybern. Part (Cybernetics) 1999, 29, 626–632
- Mehmet Aci, Cigdem _ Inan, Mutlu Avci,”A hybrid classification method of k nearest neighbor, Bayesian methods and genetic algorithm,Expert Systems with Applications, (2010) Vol. 37,pp. 5061–5067, 10.1016/j.eswa.2009.12.004
- Yu, Z.; Chen, H.; Liu, J.; You, J.; Leung, H.; Han, G. Hybrid k-nearest neighbor classifier. IEEE Trans. Cybern.2016, Vol.46, pp.1263–1275,doi: 10.1109/TCYB.2015.2443857
- Wang, K.; Ye, W.; Zhao, X.; Pan, X. A support vector machine-based genetic algorithmmethod for gas classification. In Proceedings of the 2nd International Conference on Frontiers of Sensors Technologies (ICFST), Shenzhen, China, 14–16 April 2017; pp. 363–366
- Laref, R.; Losson, E.; Sava, A.; Siadat, M. Support Vector Machine Regression for Calibration Transfer between Electronic Noses Dedicated to Air Pollution Monitoring. Sensors 2018, Vol.18, 3716,doi: 10.3390/s18113716
- Kyu-Won Jang, Jong-Hyeok Choi, Ji-Hoon Jeon and Hyun-Seok Kim,” Combustible Gas Classification Modeling usingSupport Vector Machine and Pairing Plot Scheme”,Sensors 2019, Vol.19, 5018,doi: 10.3390/s19225018
- Łukasz Lentka et al,”Determination of gas mixture components using flufctuation enhanced sensing and th LS-SVM regression algorithm”, Metrol. Meas. Syst., Vol. XXII (2015), No. 3, pp. 341–350,doi: 10.3390/s19225018
- BhaskarNavaneeth,M.Suchetha ,” PSO optimized 1-D CNN-SVM architecture for real-time detection and classification applications”,Computers in Biology and Medicine ,Volume 108, May 2019, Pages 85-92
- Yu Song a, Shaodong Xie , Yuanhang Zhang , Limin Zeng, Lynn G. Salmon , Mei Zheng “Source apportionment of PM2.5 in Beijing using principal component analysis/absolute principal component scores and UNMIX” Science of the Total Environment 372 (2006) 278–286
- Loutfi, A.; Coradeschi, S.; Lilienthal, A.J.; Gonzalez, J. Gas distribution mapping of multiple odour sources using a mobile robot. Robotica 2009, Vol.27, pp.311–319. doi: 10.1017/S0263574708004694
- YeongGwangOh et al,” Adaptive SVM-based real-time quality assessment for primer-sealer dispensing process of sunroof assembly line”,Reliability Engineering & System Safety,Volume 184, April 2019, Pages 202-212
- Natale, D., et al., Comparison and integration of arrays of quartz resonators and metaloxide semiconductor chemoresistors. Sens. Actuators B 78, pp 303-309, 2001,doi: 10.1016/S0925-4005(01)00830-9
- Pardo, M., Kwong, L.G., Sberveglieri, G., Brubaker, K., Schneider, J.F., Penrose,W.R.,et al., 2005. Data analysis for a hybrid sensor array. Sens. Actuators B 106, pp136-143,doi: 10.1016/j.snb.2004.05.045
- Gutierrez-Capitan, M., Santiago, J., Vila-Planas, J., Llobera, A., Boso, S., Gago, P., Martinez, M., Jimenez-Jorquera, C., 2013. Classification and characterization of differentwhite grape juices by using a hybrid electronic tongue. J. Agric. FoodChem. 61 (39), pp 9325-9332,doi: 10.1021/jf402960q
- Lijun Dang et al,” A novel classifier ensemble for recognition of multipleIndoor air contaminants by an electronic nose”,Sensors and Actuators A 207 (2014) ,67–74,doi: 1016/j.sna.2013.12.029
- Rabeb Faleh, Sami Gomri, Mehdi Othman,Khalifa Aguir and Abdennaceur Kachouri,” Enhancing WO3 gas sensor selectivity using a set of pollutant detection classifiers”,Sensor Review Journal, 2018, Vol. 38 No. 1, pp. 65-73,doi: 10.1108/SR-12-2016-0273
- XiyangSun et al,” An optimized multi-classifiers ensemble learning for identification of ginsengs based on electronic nose”, Sensors and Actuators A: Physical Volume 266, 15 October 2017, Pages 135-144,doi: 10.1016/j.sna.2017.08.052