
Evaluation of Mini-Hydro Power for Off Grid Electrification in Rural/Isolated Areas in Africa
Volume 5, Issue 2, Page No 703-710, 2020
Author’s Name: Ogbuefi Uche Chinweoke1, Ene Princewill Chigozie2,a), Kenneth Chijioke Chike3
View Affiliations
1Africa Centre of Excellence (ACE-SPED), University of Nigeria Nsukka, Enugu State, Nigeria
2Department of Electrical Engineering, Enugu State University, Nigeria
3Department of Electrical Engineering, University of Nigeria, Nsukka, Enugu State, Nigeria
a)Author to whom correspondence should be addressed. E-mail: eneh.princewill@esut.edu.ng
Adv. Sci. Technol. Eng. Syst. J. 5(2), 703-710 (2020); ![]() DOI: 10.25046/aj050287
DOI: 10.25046/aj050287
Keywords: Mini-Hydro Power, Rural/Isolated dwellers, Output power, Small Hydro Power, Renewable energy resources

Export Citations
Rural electrification and sustainable energy services to the less privileged is à major challenge faced in Nigeria. Off-grid power generation via small hydropower plant would mitigate this challenge. This Paper discusses the awareness and assessment of small hydro power for off-grid electrification in rural/isolated areas in Nigeria. In this research, the method of onsite data collection and evaluation was used. Data was measured and collected at water fall of 21 meters high. The velocity of the water and flow rate were measured and calculated respectively. From the onsite analysis carried out for a one-year period, the result shows output power generated in each month. The analytical observation revealed that the output power generated in the rainy season was higher than that of dry season. The data were compiled and plotted using Excel spreadsheet. The output power generated from the rainy season in Nigeria is higher than that of dry season. August has the highest output power (110.728867 kW), while December has the least output power (101.125352 kW). From the output power gotten we can term it a micro hydropower plant. With this each of the monthly generated power can serve 5 villages in rural/isolated areas with average connection of 200houses, assuming 100W compact power supply to each house hold. Nigeria as a developing country will gain a lot from Small Hydro Power (SHP) and it has minimal environmental hazard.
Received: 13 December 2019, Accepted: 04 April 2020, Published Online: 20 April 2020
1. Introduction
Access to electrical energy is an essential enabler for economic and social economic development of any nation [1]. International Energy Agency (IEA) indicated that 95% of population without access to electricity are located either in sub-Saharan African or developing Asia and 84% are in rural areas making these locations stagnant and backward from developed world [2] . Taking a closer look at Small Hydro Power (SHP) system is one of the renewable energy technologies for generating electricity and mechanical power. The current technology of harnessing SHP uses potential energy in water as a result of presence of head in the river to drive the water turbine. SHP can be classified into pico, micro, mini and small systems, most first world counties rate is classes as follows; pico as a system that generate less than 10kW, micro has capacity of more than 10kW but less than 100kW, mini system has an installed capacity within the range of 100kW but less than 1MW and small systems between the range of 1MW but less than 10MW [3]. SHP is a very robust issue than Photovoltaic system. SHP installed systems are placed to support diverse electrical needs ranging from institutional, community and even serving rural communities. SHP possess different benefits such it is environmentally friendly, it can fast track the provision of adequate, reliable, affordable and sustainable power to rural areas for socioeconomic growth. [4]. The levelized cost of Electricity (LCOE) of hydro $0.057. Although the initial cost of setting up a hydro station is huge the running cost is very low [5].Small hydro power (SHP) generation system is among a viable renewable energy technology and its suitable for rural electrification in Nigeria because majority of these isolated environments have rivers, streams and run-off waters which have potential to generate hydroelectric energy [6]. Development of energy from small, mini and micro hydropower projects are being encouraged worldwide because of its relative advantage as compared to other means of energy sources. The Hydropower is 29% as compared to petroleum which is 60%, natural gas is 9%, and coal is 2%. Figure 1 shows a pictorial view of them. They are safe and clean renewable source of energy also not expensive in terms of running cost [7].
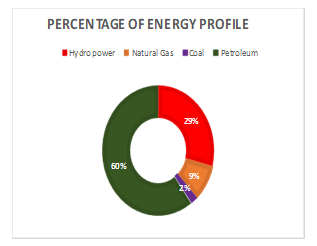 Figure 1: Profile for energy (in percentage)
Nigeria as a country is faced with an epileptic electrical energy supply. The country has numerous natural resources for generation of electrical energy to all its citizen such as the conventional fossil fuels of crude oil, tar sands, natural gas, coal as well as numerous renewable resources but still suffer from dwindling/unreliable energy supply with high tariffs rate paid by consumers of electricity, numerous grid collapse year in year out [8]. The world economic forum report 2020 revealed that high pollutant emission and its effect on climate is a major issue in the world [8, 9]. In order to tackle this backdrop the paper wishes to look at the possible solution to electrification problem in a selected community through small hydro power (SHP).
2. Energy Statistical Survey
2.1. Enugu Precipitation Rate
The zone has a tropical climate. In Enugu, the average annual temperature is 26.3oc in a year, the average rainfall is 1730mm (9). Table 1 shows the historical weather data for Enugu while Figure 2 shows a bar chart representation.
Table 1. Historical weather data for Enugu
| Month | Average Temp. ( 0C) | Precipitation rate(mm) |
| January | 26.8 | 13 |
| February | 27.7 | 20 |
| March | 28.4 | 76 |
| April | 27.9 | 137 |
| May | 26.8 | 224 |
| June | 25.3 | 241 |
| July | 24.8 | 246 |
| August | 24 | 220 |
| September | 25.3 | 298 |
| October | 25.8 | 216 |
| November | 26.8 | 30 |
| December | 26.4 | 9 |
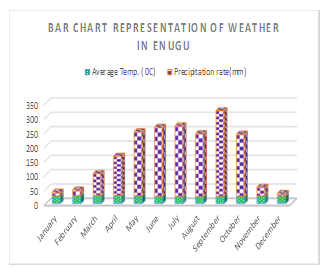 Figure 2. Bar chart representation
There exists a difference of 289mm of precipitation between the driest and wettest months with temperature variation of 4.4oC throughout the year [9].
2.2. Hydroelectric Power Distribution
As the world attempts to stall climate change by cutting emissions and dependence on fossil fuels, energy from renewable sources has become an integral part of global strategies. Table 2 shows different countries and hydroelectricity power generation. But hydroelectric power, despite being an important energy source in many nations around the world, is often overlooked. Figure 3 shows 2012 data taken from the US Energy Information Administration (EIA), which provides independent national and international energy statistics [10]
Table 2: Independent national and international energy statistics
| Country | Billion kwh |
| China | 856.35 |
| Brazil | 411.19 |
| Canada | 376.71 |
| United States | 276.24 |
| Russia | 164.42 |
| Norway | 140.47 |
| India | 124.57 |
| Venezuela | 81.19 |
| Sweden | 78.14 |
| Japan | 74.73 |
2.3. Economics of SHP
The major advantage of hydroelectricity is elimination of fuel cost. The cost of operating a hydroelectric plant is nearly immune to increases in the cost of fossil fuels such as oil, natural gas or coal, and no imports are needed, hence it is rarely affected by global economic and political changes. It is also worthy of note that hydroelectric plants also tend to have longer economic lives than fossil-fuel-fired plants. Operating/labor costs are also usually low, as plants are automated and have few personnel on site during normal operation.
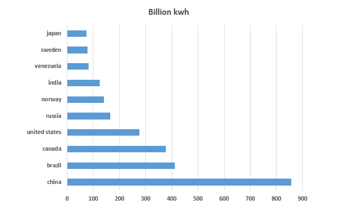 Figure 3: Energy statistic
It is also a fact that small hydro units in the range of 1MW to 3OMW are often available from multiple manufacturers and that using standard “water to wire” packages, a single contractor can provide all the generator, ancillary switchgears, selecting from several standard designs to fit the site conditions [11].
2.4. Small Hydropower Overview potential in Nigeria
Recent studies show that hydropower potential sites are distributed in 12 states and in the river basin. However, SHP potential sites exist in virtually all parts of Nigeria [3]. There are over 278 unexploited sites with total potentials of 734.3 MW. About eight small hydropower stations with aggregate capacity of 37.0MW has been installed in Nigeria by private companies and the government as shown in Table 3. Some around Jos Plateau, where there is 2MW station at Kwall fall on N’Gell river (river Kaduna) and 8MW station at Kurra fall, which was developed by a private company (NESCO) more than 75 years ago [3].
Table 3: Small hydropower stations installed in Nigeria by private companies and government
| S/n | River | State |
Installed Capacity(MW) |
|
| 1 | Bagel(I) (II) | Plateau | 1.0 , 2.0 | |
| 2 | Kurra | Plateau | 8.0 | |
| 3 | Lere(I) (II) | Plateau | 4.0, 4.0 | |
| 4 | Bakalor (I) | Sokoto | 3.0 | |
| 5 | *Tiga | Kano | 6.0 | |
| 6 | *Oyan | Ogun | 9.9 |
There is varying information on the potential of small hydropower in Nigeria. According to UNIDO regional Centre on small Hydropower, the gross small hydropower potential (for plants up to 10MW) is 720 MW, the technical feasible potential is 605 MW and the economically feasible potential is 498.4MW. A study from 2006 identified 278 yet underdeveloped sites for small hydropower production with a total of 734.2MW (with a capacity of up to 30MW). Table 4 summarize the identified small hydro power potentials in Nigeria [3].
|
Table 4: Some feasible small hydro power in Nigeria
|
||||||||||||||||||||||||||||||||||||||||||||||||||||||||||||||||||||||
Nigeria as of today generates less than 4GMW of electricity but has the capability of increasing her generation through small hydropower (SHP) considering unharnessed potentials in the country as discussed in [11]. In other to increase the percentage contribution of hydroelectricity to the total energy mix and to extend electricity to rural and remote areas, we need to consider the economic, social and environmental benefits. Interpreted in [12], most of countries have access to large amounts of water through rivers and canal. With this hydro energy sources, electricity can be generated without polluting the environment. Electricity demand is on the everyday increase; it is therefore paramount to estimate the future potential of hydro power in Nigeria. Construe in [13], hydropower that is large and small, remains by far the most important of the “renewable energy” for electrical power production worldwide providing 19% of the planets electricity. Small-scale hydro is in mostly “run-of-river”, with no dam or water storage, and is one of the most cost-effective and environmentally benign energy technologies to be considered for rural electrification in less developed countries [14]. For development of such small hydro-power plants, simple and generally applicable procedures and methods for the design are lacking. The interest in small hydro-power resources is increasing but few published guidelines for project design. [14] outlined the merits of hydropower over fossil fuels, operating and maintenance costs are in favor of SHP development in Nigeria, being the lowest when compared with the situation in European countries. Challenges in locating a good site for the project which is essential to the success of the scheme with respect to sufficient flow rate and good head of water narrated in [3]. It should be known that flow rate is very essential for hydropower generation since the head at a proposed site is practically constant while the available flow is highly variable depending on the season (rainy or dry). The sole aim of this project is to check the potential energy that can be generated from SHP in Eziagu Water fall in Enugu State, Nigeria.
3. Proposed Scheme
In order to harness energy from the waterfall, certain design and
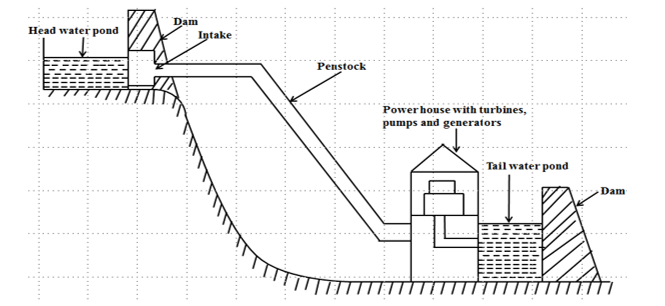 Figure 4. Schematic diagram of small hydro power plant
Parameters must be put in place to obtain a good result. A schematic diagram of small hydro power plant is depicted in Figure 4.
Figure 4 shows the Components of the SHP technology which include: head water pond, dam, intake, head race, penstock, and water turbine and generator: considering a modular design for low water flow and short descent, the under listed materials are to be used: Generator: For this design, a low speed and large diameter generator will be employed. Turbine: Kaplan turbine head ranging from 0 – 70m was employed. Penstock: Polyethylene (PE) or welded steel pipe of diameter of 1500mm was employed. Generator speed governor: Since Kaplan turbine is an axial-flow rotor with variable-pitch blade for variable load operation, speed governor is necessary for speed regulation of the generator to meet the load variation. Civil work for dam construction and power house is also a major phase of the SHP design that cannot be overlooked.
3.1. Ezeagu waterfall
Ezeagu is situated in south eastern part of Nigeria. The area possess much waterfalls, springs, streams, lakes and rivers within this Areas, but not all of them are suitable to set up a micro-hydro power station [15]. Ezeagu is located an hour thirty minutes’ drive from state capital Enugu. The waterfall rushes down the cliff with a thunderous sound that can be heard from a distance [15].
4. Materials and Method
One important hurdle to overcome for the successful analysis to be conducted is data collection. The data was collected from the site over a period of one year covering the two major seasons in Nigeria. The Ezeagu water fall has a measured head of water of 21m. Making use of a reference distance of 21m, the parameters were calculated as in designed parameters. Figure 5 shows a pictorial view of the reference distance been measured whereas Figure 6 shows the site of the water fall. The average time for the month of June is calculated to be 3.047 seconds while the average time for the month of July was calculated to be 2.99seconds. Using this two parameters, Velocity was calculated. For June, Velocity was 6.89 ms-1, and that of July 7.02 ms-1 .
 Figure 5. Measurement of distance with measuring tape
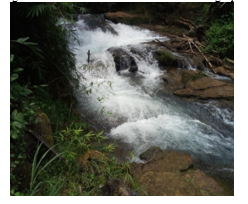 Figure 6. Flowing water from the fall at Ezeagu
4.1. Design Parameters
To get the actual power that will be harvested from the assessment of this small hydro power, the following parameters are used; power output equations, overall efficiency, area, acceleration rate. They are defined and calculated as follows:
The Output Power equation for Hydro Power Plant is:
Pout = Pgross x ƞ (1)
But ƞ is the overall efficiency of the Hydro Power Scheme
Pgross = gHQ (2)
Putting equation (2) into equation (1), we have:
Pout = gHQ ƞ (3)
But ƞ = ƞTƞG (4)
ƞT is the efficiency of the turbine; ƞG is the generator efficiency. Putting (4) into (3), we obtain:
Pout = gHQƞTƞG (5)
Where: g =Acceleration of free flow in m/s2;
H= Gross Head in meters, Q = Design flow in m3/s,
ƞT = Efficiency of the turbine, ȠG = Efficiency of the generator, Pout = Output Power in KW, and
Pgross = Gross Power in KW.
Alternatively, flow rate, Q, can be calculated using the equations below:
A = πr2h (6)
Q = πr2h x V (7)
Where: A is the area of the penstock, h is the height of penstock, t is time in Seconds,
V is the velocity of the following river in ms-1.
d is the diameter of the penstock in meter, whereas g and H remain as defined above.
d = 2.69 ^0.1875 (9)
Where: L is the length of the penstock in meters and n is the manning coefficient.
L = (10)
tg is water acceleration constant in the pipe in seconds
V is velocity in ms-1.
The output power equation for turbine is:
Pmaxoutput = gHQƞmaxturbine (11)
Since the design is for low head, we make the following assumptions:
Height of penstock (h) = 30m, Penstock diameter = 2000mm = 2m, Generator efficiency = 0.9, Turbine efficiency = 0.9, acceleration of free flow = 9.81 m/s2, radius of Penstock, r = 1m
Table 5: Time interval for first half of the year
| January | February | March | ||||||||
| Interval | Time (Secs.) | Status (Stopwatch) | Interval | Time (Secs.) | Status (Stopwatch) | Interval | Time (Secs.) | Status (Stopwatch) | ||
| First Interval | 3.23 | Measured | First Interval | 3.21 | Measured | First Interval | 3.18 | Measured | ||
| Second Interval | 3 | Measured | Second Interval | 3.12 | Measured | Second Interval | 3.1 | Measured | ||
| Third Interval | 3.25 | Measured | Third Interval | 3.25 | Measured | Third Interval | 3.11 | Measured | ||
|
Average |
3.16 | 3.193333 | 3.13 | |||||||
| April | May | June | ||||||||
| Interval | Time (Secs.) | Status (Stopwatch) | Interval | Time (Secs.) | Status (Stopwatch) | Interval | Time (Secs.) | Status (Stopwatch) | ||
| First Interval | 3.08 | Measured | First Interval | 3.12 | Measured | First Interval | 3.09 | Measured | ||
| Second Interval | 3.15 | Measured | Second Interval | 3.12 | Measured | Second Interval | 3.05 | Measured | ||
| Third Interval | 3.09 | Measured | Third Interval | 3.1 | Measured | Third Interval | 3 | Measured | ||
|
Average |
3.106667 | 3.113333 | 3.046667 | |||||||
Table 6: Time interval for second half of the year
| July | August | September | ||||||||
| Interval | Time (Secs.) | Status (Stopwatch) | Interval | Time (Secs.) | Status (Stopwatch) | Interval | Time (Secs.) | Status (Stopwatch) | ||
| First Interval | 3 | Measured | First Interval | 2.98 | Measured | First Interval | 3.03 | Measured | ||
| Second Interval | 3 | Measured | Second Interval | 2.99 | Measured | Second Interval | 3 | Measured | ||
| Third Interval | 2.97 | Measured | Third Interval | 2.97 | Measured | Third Interval | 3 | Measured | ||
| Average | 2.99 | 2.98 | 3.01 | |||||||
| October | November | December | ||||||||
| Interval | Time (Secs.) | Status (Stopwatch) | Interval | Time (Secs.) | Status (Stopwatch) | Interval | Time (Secs.) | Status (Stopwatch) | ||
| First Interval | 2.98 | Measured | First Interval | 3.1 | Measured | First Interval | 3.24 | Measured | ||
| Second Interval | 3 | Measured | Second Interval | 3 | Measured | Second Interval | 3.26 | Measured | ||
| Third Interval | 2.97 | Measured | Third Interval | 3.24 | Measured | Third Interval | 3.29 | Measured | ||
| Average | 2.983333 | 3.113333 | 3.263333 | |||||||
Table 7: Calculated results.
| Month | Average Time (s) | Velocity (m/s) | A = πr^2 * h (m2) | Q= AV (m3/s) | Power (W) | Power(kW) |
| January | 3.16 | 6.6455696 | 94.26 | 626.4114 | 104421.5 | 104.4215263 |
| February | 3.193 | 6.5768869 | 94.26 | 619.9374 | 103342.3 | 103.342319 |
| March | 3.13 | 6.7092652 | 94.26 | 632.4153 | 105422.4 | 105.422372 |
| April | 3.107 | 6.7589314 | 94.26 | 637.0969 | 106202.8 | 106.202775 |
| May | 3.113 | 6.7459043 | 94.26 | 635.8689 | 105998.1 | 105.99808 |
| June | 3.047 | 6.8920249 | 94.26 | 649.6423 | 108294.1 | 108.294067 |
| July | 2.99 | 7.0234114 | 94.26 | 662.0268 | 110358.5 | 110.358536 |
| August | 2.98 | 7.0469799 | 94.26 | 664.2483 | 110728.9 | 110.728867 |
| September | 3.01 | 6.9767442 | 94.26 | 657.6279 | 109625.3 | 109.625257 |
| October | 2.983 | 7.0398927 | 94.26 | 663.5803 | 110617.5 | 110.617507 |
| November | 3.113 | 6.7459043 | 94.26 | 635.8689 | 105998.1 | 105.99808 |
| December | 3.263 | 6.4357953 | 94.26 | 606.6381 | 101125.4 | 101.125352 |
5. Results and Discussion
The investigation of velocity of the river, the flow rate, and the time in second to cover the reference distance was experimentally obtained and the results recorded. The velocity of the river was measured each month, with a distance of 21 meters as reference distance. During the experiment, the investigation was done three times which we denoted as: first interval, second interval and third interval; and their respective time in seconds were gotten using a stopwatch. The results recorded for the first half of the year and the second half of the year are shown in Tables 5 and 6. Results were obtained for a period of one year constituting the two seasons of Nigeria (Rainy and dry Season).
From Tables 5 and 6, it can be seen that it takes lesser time for the empty plastic water can to cover the reference distance of 21meters during the rainy season. The month with the least time to cover the reference distance is August with an average time interval of 2.98 seconds. While December with an average time interval of 3.26 seconds, as the highest time it took to cover the reference distance. It should be noted from the table that the time it took the plastic can to cover the reference distance was less in rainy season as compared to the dry season.
Table 7 shows the calculated results. Average time interval of each month was used for the calculation. To demonstrate how Table 7 was obtained, the output power for the month of August would be analyzed. The Average time of the month of August was gotten from
Average Time
To get the velocity of the water fall, equation 8 was used. Substituting into equation 8, we have Velocity as 7.0469799 m/s
Substituting into equation 6 also gives the area as 94.26 m2. The flow rate, Q, was gotten from equation 7 as: 664.2483 m3/s. Substitution into equation 5 yields the output power as: 110728.9 W. or 110.728867 KW.
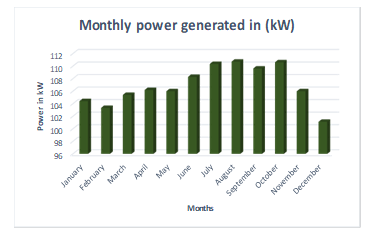 Figure 7: Monthly output Power.
The rest of the month was gotten in similar manner and Table 7 was completed with their respective results, while Figure 7 was gotten from the monthly output power.
Table 7 shows the velocity of the water fall, the flow and calculated output power of each month. It is obvious from Table 7 and Figure 7 that August has the highest value of velocity (7.0469799m/s), flowrate (664.2483 m3/s) and output power (110.728867 kW); while December has the lowest value of these quantities – 6.4357953m/s for the velocity, 606.638m3/s and 101.125352 kW for power output. It is worthy to note that the difference between the output power generated in rainy and dry season is not much. This is because, the water fall has almost equal rate of flow for all the months. Each of the monthly generated power can serve 5 villages in rural areas with average connection of 200houses, assuming 100W compact power supply to each house hold.
From the results in Table 7, the output power generated from the rainy season’s month in Nigeria which is between months of June to October have the highest generated power with August having the highest output power of 110.728867 kW. December with an output power of 101.125352 kW has the least output power in dry season. From the output power gotten for each month we can term it a micro hydropower plant.
6. Conclusion
Result from the examined site shows that the site falls in the range of mini hydropower generation. As a way out to solve the epileptic nature of electrical supply mini hydropower could be used where site has a potential ability of generating power to the community thereby relieving the grid network from stress. There is a lot to gain from SHP because of little or no environmental hazard produced which is in line with recommendation of the World Economic Forum, Davos 2020 and also eradicating poverty in the rural communities
- Darfur Solar Electrification Project, project report, Khartoum, Feb. 2016 (Available online:7._darfur_solar_electrification_project_final_for_signature_0.pdf. Accessed on 24 July 2018).
- UNDP Discussion Paper, “An integrated approach to tackle the challenge of rural development by bringing access to renewable energy for income generation and social development”, Aug 2014. (Available online: 140901_Integrated%20Rurl%20Electrification_FINAL.pdf. Accessed on 20 July 2018).
- S. Kaunda, Z. Kimambo, K. Nielsen “Potential of Small-Scale Hydropower for Electricity Generation in Sub-Saharan Africa”, International Scholarly Research Network, vol. 2012, Article ID 132606, pp. 1-16.
- W. S. Ebhota, P. Y. Tabakov, “The Place of Small hydropower electrification Scheme in Socioeconomic Stimulation of Nigeria”, International Journal of Low-Carbon Technologies, vol. 13, 2018, pp. 311- 319.
- “How can developers use Levelised Cost of electricity to compare technologies?”, United States Department of Energy (DOE) Energy Information Administration (EIA), 2017.
- O. O. Fagbohun, “Studies on small hydro-power potentials of itapaji dam in Ekiti State, Nigeria”, International journal of Engineering science invention, vol. 5 issue 1, 2016, pp. 28-36
- J. A. Otun, J. I. Onemano, A. W. Alayande, “Assessment of the hydropower potential of kangimi reservoir in Kaduna State Nigeria”, Nigeria Journal of Technology, vol. 31, No. 3, 2012, pp. 300 -307
- Woes of power in Nigeria by FisayoAkinduro ,http://thehopenewspapers.com/2016/03/woes-power-nigeria/ , accessed on 19thjuly 2017
- “Climate: Enugu”, content://com.sec.android.app.sbrowser/readi/0720083850.mhtml, accessed on 19th July,2018
- S. Mishra, S. K. Signal, D.K. Khatod, “Optimal installation of small hydropower plant-A review”, Renewable Sustainable Energy Reviews, vol. 15, 2011, pp 3862-3869.
- H. S. Sachdev, A. K. Akella, N. Kumar, “Analysis and evaluation of small hydropower plants: A bibliographical survey” Renewable Sustainable Energy Reviews vol. 51, 2015, pp 1013-1022
- C. P. Jawahar, P. A. Michael, “A review on turbines for micro hydro power plant”, Renewable Sustainable Energy Reviews, vol.72, 2017, pp 882-887.
- E. I. Igweonu, R. B. Joshua, “Small hydropower (SHP) development in Nigeria: issues, challenges and prospects” Global Journal of Pure and Applied Science, vol 18, No. 1&2, 2012, 53-58
- S. O. Ohunakin, J. S. Ojolo, “Small Hydropower (SHP) Development in Nigeria: An assessment”, Renewable Sustainable Energy Reviews, vol. 15, 2011 Doi:10.1016/j.rser.2011.01.003
- “Ezeagu tourist complex Enugu State”, https://www.nigeriagalleria.com/Nigeria/State¬_Nigeria/Enugu/Ezeagu-Tourist-complex.html, accessed on 20th, July2018.