Neural Network-based Efficient Measurement Method on Upside Down Orientation of a Digital Document

Adv. Sci. Technol. Eng. Syst. J. 5(2), 697–702 (2020);
 DOI: 10.25046/aj050286
As many digital documents are required in various environments, paper documents are digitized by scanner, fax, digital camera and specific software. In the case of a scanned document, we need to check whether the document is right sided or upside down because the orientation of the scanned document is determined by the orientation in which the paper document is placed. It is time-consuming for a person to check all the documents whether they are upside down. We propose an algorithm that can automatically determine upside down documents. The proposed artificial neural network-based method shows a high accuracy and efficiency in time for general documents. In addition, OCR-based method and CNN-based method were used to compare with the performance of the proposed method.
1. Introduction
Recently the use of digital documents has increased in various environments, such as the automation of business processes and factory system. The documents are digitized by scanner, fax, digital camera and specific software. The document may be scanned upside down because a person could put the paper in that way to the scanner without noticing it. If the scanned papers are in large quantity, there’s no way to find out all the papers upside down other than doing it manually. In that case, we have to consume expensive time and cost for the checking process. Therefore, there are several studies to automatically determine the orientation of a digitized document without human checking when there is a large amount of non-digitized documents to be scanned.
The document orientation can be categorized into three categories [1]: landscape, portrait, and upside-down orientation. A few previous studies [1]-[5] have successfully developed some algorithms for determining document orientations from any angle. However, these studies have some limitation such that they cannot recognize the document orientation in special case of upside down [2, 3] or take high computational burden even though they can recognize the upside down [1, 4, 5]. The determination between landscape and portrait is usually done based on the skewed angle [2, 4]. Such studies based on the skewed angle may not determine between upside down and right sided when the orientation of the text inside the document is over 180 degrees. Thus, a different approach is required to detect the orientation of documents that belong to these cases.
Some previous studies [4]-[9] shows efficient detection method for document orientation with English alphabet characters based on the ascender-descender (typography) ratio of text. Since the ascenders are usually more frequent than descenders, these methods rely on counting the numbers of ascenders and descenders in the text to make a decision on its orientation. Specifically, they extracted characters using OCR (Optical Character Recognition) engine and parsed the ‘bbox value of the hOCR file with Beautifulsoup’ [10]. And, they defined coordinate value information for each word obtained through the bbox tag of hOCR.
In OCR-based algorithm, Tesseract OCR [11] and Beautifulsoup [10] are usually used to determine whether the document is upside down or right sided through the coordinate value information of each word in hOCR.
In this paper, more efficient method is proposed to handle many documents immediately. For the small amounts of information for time efficiency and high recognition accuracy, structural information of the document and artificial neural network (ANN) [12] are used to determine between upside down and right sided without recognizing or analyzing characters.
Also, performance is verified by comparing between the proposed (ANN-based) method and the previous OCR-based method.
2. OCR (Optical Character Recognition)-based measurement method
Let us assume there are n-lines in an image and each line consists of k-words. The W of each word is defined as the summation of minimum and maximum coordinate values (min_x, min_y, max_x, max_y) for each word obtained through the bbox tag of hOCR. Li is defined as the summation of Wi for every words in each line.
Wi = min_x + min_y + max_x + max_y for each word i ·················· (1)
Lj =W1 +W2 +…+Wk for each line j ····················································· (2)
The document is determined as right sided if the value of Lj increases, but upside down if it decreases. The following is the pseudo code for this the algorithm (Figure 1).
 Figure 1. The pseudo code of OCR-based measurement algorithm
3. Artificial neural network (ANN)-based measurement method
3.1. Basic Idea
Many documents are written from left to right and top to bottom direction although titles, pictures, charts and so on may make exceptions. When the document can be separated as areas as shown in Figure 2, the ratio of the upper half non-background area to the lower half non-background area (defined as Top-to-bottom ratio), and the ratio of the left half non-background area to the right half non-background area (defined as Left-to-right ratio) may be able to distinguish whether the document is upside down or right sided. Actually, the Top-to-bottom ratio and the Left-to-right ratio of three different types of documents are calculated as shown in Table 1. And for these documents (not for all documents), when Top-to-bottom ratio is greater than 1 or the Left-to-right ratio is greater than 1, we can see that the orientation is right sided.
 Figure 2. Sketch of basic idea
Table 1. Top-to-bottom ratios and Left-to-right ratios of three document samples
| Document | State | Top-to-bottom ratio | Left-to-right ratio |
| Doc. 1 | right sided | 9.282392 | 7.849178 |
| upside down | 0.107731 | 0.127402 | |
| Doc. 2 | right sided | 3.941437 | 1.16777 |
| upside down | 0.253715 | 0.856333 | |
| Doc. 3 | right sided | 1.253945 | 1.446367 |
| upside down | 0.797483 | 0.691387 |
However, experiments with 50 more documents with 10 different types have shown that if Top-to-bottom ratio and the Left-to-right ratio are less than 2, the distribution was scattered and not linearly separable as shown in Figure 3. So we have designed an algorithm based on ANN that can effectively and efficiently distinguish the upside down documents as shown in Section 3.2.
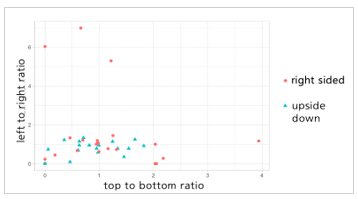 Figure 3. Feature plot for upside down and right sided state
3.2. Proposed algorithm
Artificial neural network (ANN)-based measurement method, it calculates the ratio of the upper half non-background area and the lower half non-background area. Similarly, it also calculates the ratio of the left half non-background area and the right half non-background area. These are used as feature values for training ANN to classify the upside down or not. And the recognition process of ANN gives the status of upside down automatically.
3.2.1 Feature extraction
We assumed that the characters are black and the algorithm for feature extraction is as follows:
Step1. Read the RGB color values of pixels from a scanned BMP image file for the given digital document.
Step2. Transform to the grayscale image and do thresholding with the threshold value, 33.
Step3. Calculate the number of black pixels at the upper half non-background area and the number of black pixels at the lower half non-background area. Subsequently, divide the number of black pixels in the top part by the number of black pixels in the bottom part like the below Eq. (3)
Top-to-bottom ratio …….…. (3)
Step4. Calculate the number of black pixels on the left half non-background area to the number of black pixels on the right half non-background area. Thereafter, the number of black pixels on the left is divided by the number of black pixels on the right like this Eq. (4)
Left-to-right ratio ….………….. (4)
Step5. Extract the input feature data for artificial neural network with the form of vector (‘Top-to-bottom ratio’, ‘Left-to-right ratio’, {‘right sided’ / ‘upside down’})T.
3.2.2 Artificial neural network (ANN)
We have got the datasets of Top-to-bottom ratios and Left-to-right ratios from the section 3.2.1. To find appropriate structure of ANN, we tried 9 different structures by varying the number of hidden layers with 1, 2, 3 layers and the number of hidden nodes with 1, 3, 5 nodes as shown in table 2. By the results in Table 2, we decided the structure of ANN. The number of hidden layers is 1 and the number of hidden nodes are 5, whose structure shows the lowest error rate.
Table 2. Error rates of various ANN structures
| #of hidden layers
# of hidden nodes |
1 layer | 2 layers | 3 layers |
| 1 node | 8.00 | 5.91 | 5.73 |
| 3 nodes | 6.22 | 5.41 | 5.58 |
| 5 nodes | 4.73 | 4.99 | 4.73 |
The artificial neural network system consisting of one hidden layer with five nodes calculates as in Figure 4.
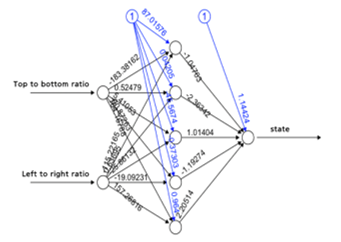 Figure 4. Proposed ANN Structure
Figure 5 shows the min_thresh value of neuralnet function in R neuralnet library [13] according to the number of iterations to show the convergence of learning error. During the initial period up to 7,000 iterations, the min_thresh value decreases rapidly but the value becomes almost constant from 30,000 iterations.
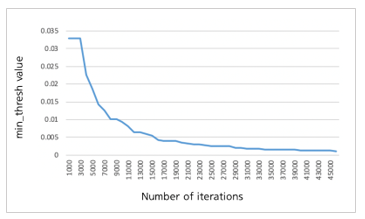 Figure 5. Error plot of ANN
The final decision can be derived by applying the input feature data to the trained artificial neural network. The trained ANN will decide whether the given document is right sided or upside down. The following Figure 6 explains the pseudo code of the trained ANN-based measurement method.
4. Convolutional neural network (CNN)-based measurement method
To extract the pattern information of pixels that are laid out in the document, we have used convolutional neural network (CNN) because it has shown a high performance in understanding images [14, 15]. The used CNN model in this paper has four hidden layers with different number of nodes for each corresponding layer as shown in Table 3 which showed superior results compared to other models. Activation function and 2D max_pooling is applied followed by the first hidden layer. Then the output nodes of first hidden layer are fed into the second hidden layer. After applying activation function and 2D max_pooling, the output is flattened and an activation function is applied for linear operation. Then in the third hidden layer, drop_out is done to avoid overfitting and to get rid of 30 % of the total number of nodes for generalization. After that, the last hidden layer with 1026 nodes are fed forward to the output layer.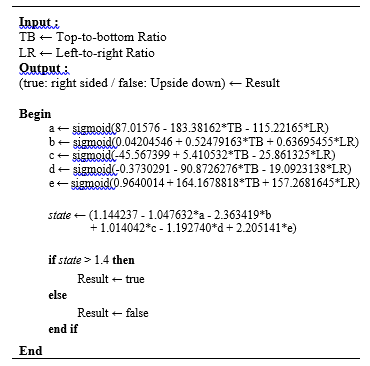 Figure 6. The pseudo code of the trained ANN-based measurement Algorithm
Table 3. Used CNN structure
| Layer Type | Output Shape | # of Params |
| conv2d_1 (Conv2D) |
(None, 60, 60, 32) | 832 |
| activation_1 (Activation) | (None, 60, 60, 32) | 0 |
| max_pooling2d_1 (MaxPooling2) | (None, 30, 30, 32) | 0 |
| conv2d_2 (Conv2D) |
(None, 30, 30, 64) | 51264 |
| activation_2 (Activation) | (None, 30, 30, 64) | 0 |
| max_pooling2d_2 (MaxPooling2) | (None, 15, 15, 64) | 0 |
| flatten_1 (Flatten) | (None, 14400) | 0 |
| activation_3 (Activation) | (None, 14400) | 0 |
| dense_1 (Dense) | (None, 512) | 7373312 |
| dropout_1 (Dropout) | (None, 512) | 0 |
| activation_4 (Activation) | (None, 512) | 0 |
| dense_2 (Dense) | (None, 2) | 1026 |
| activation_5 (Activation) | (None, 2) | 0 |
For CNN training process, adam is used for the optimizer which is known to give better results compared to SGD (stochastic gradient descent) optimizer [16]. The error rates are measured with categorical cross entropy and the results are shown as in Figure 7. As for Figure 7, the error rate decreases as the training progresses along with the number of epochs.
 Figure 7. Categorical Cross Entropy per number of epochs in the trained CNN
5. Experimental Results and Analysis
5.1. Experimental Setup
There are many types of documents and we have categorized into 4 groups such as general document, picture-oriented document, free style document and miscellaneous. The general document is a formal document composed of almost all characters. Almost all previous researches [1]-[8] were done with this kind of documents. The picture-oriented document such as the fairy tale book contains not only characters but also some pictures in many pages. The free style document and miscellaneous have no formats or styles. Table 4 shows 4 categories and 10 types of documents in each category.
Table 4. 4 categories and 10 types of documents
| Category | No. | Document Type |
| General document | 1 | Culture book |
| 2 | Technical book | |
| 3 | Paper | |
| Picture-oriented document | 4 | Document consisting of more than half of pictures |
| 5 | Fairy tale book | |
| Free style document | 6 | Magazine |
| 7 | Leaflet | |
| Miscellaneous | 8 | Comic book |
| 9 | Tabular document | |
| 10 | Book cover |
The general document and picture-oriented document have a basic format and a certain number of characters. Others are free in their character size, deployment of characters and the number of words in a document. Table 5 shows some examples of 10 types of documents.
Table 5. Examples of each document type
| 1 | Culture book | 2 | Technical book | 3 | Paper |
| 4 | Picture book | 5 | Fairy tale book | 6 | Magazine |
| 7 | Leaflet | 8 | Comic book | 9 | Tabular doc. |
| 10 | Book cover | ||||
A total of 50 documents were used as training data. It is composed of 5 documents for each document type. 25 of the training data were right sided and the others were upside down. The documents are written in Korean or English. For the test, 100 documents were used as 10 images for each type of document. And 50 of the test data were right sided and the others were upside down.
We have implemented both OCR-based algorithm (See Figure 1) and ANN-based algorithm (See Figure 6) for whole documents. We have analyzed them with each category data and compared the ANN-based result with OCR-based result in each category. In addition, we have also implemented CNN-based algorithm (See Table 3) for the comparison with the ANN-based algorithm. To deal with various image size especially for the CNN-based algorithm, all input document images are converted to 64 * 64 pixels. And the three-dimensional RGB array of the input image is converted into one dimensional array using gamma compression [17] giving weights according to the relative luminance of each pixel value. In addition, the time measured for the CNN-based algorithm is the elapsed time of the program including the time required for reading images but the training time.
5.2. Experimental Results
Experimental results of the general document are shown in Table 6 and the results of the picture-oriented document are in Table 7.
Table 6. Result of Category 1(General document)
| Document type | OCR-based method | ANN-based method | CNN-based method | |||
| Accuracy | Average Time (s) | Accuracy | Average Time (s) | Accuracy | Average Time (s) | |
| 1 | 90% | 2.580 | 90% | 0.118 | 80% | 1.049 |
| 2 | 80% | 3.889 | 90% | 0.071 | 90% | 0.349 |
| 3 | 100% | 4.700 | 90% | 0.046 | 80% | 0.368 |
| All | 90% | 3.723 | 90% | 0.078 | 83% | 0.589 |
Table 7. Result of Category 2(Picture-oriented document)
| Document type | OCR-based method | ANN-based method | CNN-based method | |||
| Accuracy | Average Time (s) | Accuracy | Average Time (s) | Accuracy | Average Time (s) | |
| 4 | 90% | 1.773 | 70% | 0.050 | 50% | 0.992 |
| 5 | 70% | 2.140 | 80% | 0.190 | 70% | 1.883 |
| All | 80% | 1.957 | 75% | 0.120 | 60% | 1.438 |
Table 8. Result of Category 3(Free style document)
| Document type | OCR-based method | ANN-based method | CNN-based method | |||
| Accuracy | Average Time (s) | Accuracy | Average Time (s) | Accuracy | Average Time (s) | |
| 6 | 100% | 3.480 | 40% | 0.042 | 70% | 0.430 |
| 7 | 70% | 1.724 | 40% | 0.033 | 90% | 0.391 |
| All | 85% | 2.602 | 40% | 0.038 | 80% | 0.411 |
Table 9. Result of Category 4(Miscellaneous document)
| Document type | OCR-based method | ANN-based method | CNN-based method | |||
| Accuracy | Average Time (s) | Accuracy | Average Time (s) | Accuracy | Average Time (s) | |
| 8 | 90% | 0.784 | 40% | 0.030 | 40% | 1.063 |
| 9 | 90% | 2.209 | 50% | 0.030 | 60% | 0.758 |
| 10 | 100% | 0.794 | 60% | 0.026 | 50% | 0.562 |
| All | 93.3% | 1.247 | 50% | 0.029 | 50% | 0.794 |
5.3. Discussion
In general documents (category 1 in Table 6) such as cultural books, technical books, and papers, both OCR-based algorithm and ANN-based algorithm have similar high accuracy in Table 6. But ANN-based algorithm shows tremendous time reduction. The ANN-based algorithm we proposed will have a high efficiency for checking a large number of documents automatically.
In picture-oriented documents (category 2 in Table 7) such as picture books and fairy tale books, OCR-based algorithm is a little better than ANN-based algorithm in accuracy (See Table 7). But the result is also seen that the time in ANN-based algorithm is shortened. This may be occurred by the reason that the result depends on our small number of experimental documents and it could be improved if we apply our algorithm with much more data. The thresholding method we used to be based on the fixed value. If the thresholding value can be adaptively changed as the given input image, then the performance could be enhanced.
In free style documents and miscellaneous documents (category 3 and 4 in Table 4) such as magazines, leaflets, comic books, tabular documents and book covers, OCR-based algorithm is better than ANN-based algorithm in accuracy (See Table 8 and 9). This may be occurred by the reason that there is a no formal document structure in the document type 6, 7, 8, 9. And, in case of book cover, there are more non-black characters than black characters. If the system can recognize all colors of characters exactly in high speed, then the performance could be enhanced.
The performance of ANN-based algorithm was also compared with that of CNN-based algorithm. Basically, the performance of CNN-based algorithm has less accuracy than ANN-based algorithm (See Table 6 and 7). This is based on the reason that the number of training data is limited to 50 documents for the comparison with other algorithms, and the image was resized into 64*64 pixels by the complex structure of the CNN-based algorithm and as a result, the character was very distorted and became small. In the case of category 3 (See Table 8), CNN-based algorithm has better accuracy than ANN-based algorithm. It may be from the reason that many of the documents in category 3 include more non-black characters than black characters.
6. Conclusion
As a result, OCR-based algorithm shows high accuracy by the power of character recognition, but it takes more time because all words should be recognized in advance. CNN-based algorithm shows very limited power especially for the document type 2 and 7 due to the limited number of training data and resized image.
In contrast, ANN-based algorithm calculates two feature values derived from the document structure and can determine the orientation of the document immediately. ANN-based algorithm can greatly reduce the time using small information and can obtain high accuracy using the power of artificial neural network.
Additionally, we have conducted the experiments on the relatively free form of documents such as leaflets and magazines (category 3), comic books, tabular documents, and book covers (category 4). ANN-based algorithm determines the document structure immediately but the accuracy was significantly lower for these special cases.
Conflict of Interest
The authors declare no conflict of interest.
Acknowledgment
This research was partially supported by the MIST (Ministry of Science and ICT), Korea, under the national program for excellence in SW supervised by the IITP (Institute for Information & Communications Technology Promotion) (2016-0-00017), partially supported by the KIAT(Korea Institute for Advancement of Technology) grant funded by the Korea Government(MOTIE : Ministry of Trade Industry and Energy) (No. N0001884, HRD program for Embedded Software R&D) and partially supported by the KIAT(Korea Institute for Advancement of Technology) grant funded by the Korea Government (MSS : Ministry of SMEs and Startups). (No. S2755615, HRD program for Enterprise linkages R&D).
- S. Lu, C. L. Tan, “Automatic document orientation detection and categorization through document vectorization” in Proceedings of the 14th ACM international conference on Multimedia, Santa Barbara, CA, USA, 2006. http://doi.org/10.1145/1180639.1180673
- F. Hones, J. Lichter, “Layout extraction of mixed mode documents” Mach. Vision Appl., 7, 237–246, 1994.
- M. Ali, “An object/segment oriented skew-correction technique for document images” in Proceedings of the 4th International Conference on Document Analysis Recognition, Ulm, Germany, 1997. https://ieeexplore.ieee.org/document/620591/
- A. Hrishikesh, “A generic method for determining up/down orientation of text in roman and non-roman scripts” Pattern Recognition, 38(11), 2114-2131, 2005. https://doi.org/10.1016/j.patcog.2004.12.011
- S. J. Lu, J. Wang, C. L. Tan, “Fast and accurate detection of document skew and orientation” in Proceedings of the International Conference on Document Analysis and Recognition, Vol.2, 684–688, 2007. https://doi.org/10.1109/ICDAR.2007.4377002
- R. S. Caprari, “Algorithm for text page up/down orientation determination” Pattern Recognition Letters, 21, 311-317, 2000. https://doi.org/10.1016/S0167-8655(99)00161-0
- B. T. Avila, R. D. Lins, “A fast orientation and skew detection algorithm for monochromatic document images” in Proceedings of the ACM symposium on Document engineering, 118–126, 2005. https://doi.org/10.1145/1096601.1096631
- J. V. Beusekom, F. Shafait, T. M. Breuel, “Resolution independent skew and orientation detection for document images” in Proceedings of the SPIE Electronic Imaging: Document Recognition and Retrieval, Vol.7247, 72470K–72470K, 2009. https://doi.org/10.1117/12.807735
- M. Kim, S. Yim, Y. Lee, M. Kim, J.-W. Jung, “A study on automated checking for upside down printed materials based on Optical Character Recognition” in Proceedings of the 2018 International Conference on Fuzzy Theory and Its Applications (iFUZZY), 2018. https://doi.org/10.1109/iFUZZY.2018.8751690
- L. Richardson, Beautiful Soup Documentation, Crummy. https://www.crummy.com/software/BeautifulSoup/bs3/documentation.html
- R. Smith, “An overview of the Tesseract OCR engine” in Proceedings of the IEEE 9th International Conference on Document Analysis and Recognition (ICDAR 2007), Vol. 2, 2007. https://doi.org/10.1109/ICDAR.2007.4376991
- M. T. Hagan, H. B. Demuth, M. Beale, Neural Network Design, Boston Pws, 1996.
- R Documentation. https://www.rdocumentation.org/packages
/neuralnet/versions/1.44.2/topics/neuralnet - M. F. Aydogdu, M. F. Demirci, “Age Classification Using an Optimized CNN Architecture” in Proceedings of the International Conference on Compute and Data Analysis, Lakeland, FL, USA, 2017. https://doi.org/10.1145/3093241.3093277
- M. A. Shibli, P. Marques, E. Spiridon, “Artificial Intelligent Drone-Based Encrypted Machine Learning of Image Extraction Using Pretrained Convolutional Neural Network (CNN)” in Proceedings of the 2018 International Conference on Artificial Intelligence and Virtual Reality, Nagoya, Japan, 2018. https://doi.org/10.1145/3293663.3297155
- D. P. Kingma, J. Ba, “Adam: A Method for Stochastic Optimization” in Proceedings of the 3rd International Conference for Learning Representations, San Diego, 2015.
- ITU-R, Studio encoding parameters of digital television for standard 4:3 and wide-screen 16:9 aspect ratios. https://www.itu.int/dms_pubrec/itu-r/rec/bt/R-REC-BT.601-7-201103-I!!PDF-E.pdf