
Evaluation of Vapor Jet Refrigeration Cycle Driven by Solar Thermal Energy for Air Conditioning Applications: Case Study
Volume 5, Issue 2, Page No 646-652, 2020
Author’s Name: Ishaq Sider, Khaled Sidera)
View Affiliations
Mechanical Engineering Department, Palestine Polytechnic University, Palestine
a)Author to whom correspondence should be addressed. E-mail: ksider@ppu.edu
Adv. Sci. Technol. Eng. Syst. J. 5(2), 646-652 (2020); ![]() DOI: 10.25046/aj050280
DOI: 10.25046/aj050280
Keywords: Air Conditioning, EES Software, Evacuated Tube, Solar Collector, Solar Thermal Energy, TRNSYS Software, Vapor Jet Refrigeration, Cycle

Export Citations
The need for air conditioning in rural areas where there is no source of electricity, leads to look for alternative solutions. Usage of Solar thermal system drive vapor jet refrigeration cycle (VJRC) instead of the traditional air conditioning systems, contributes in the reduction of the Global Worming and Ozone Depletion. The main objective of this paper is to test the visibility of using VJRC driven by solar thermal energy in rural areas to cover the cooling load demand of a typical movable house unit (TMH). After the mathematical modeling of the VJRC, the characteristic curves and tables where obtained by using engineering equation solver (EES) software assuming a constant evaporator temperature and various generator and condenser temperatures. TRNBuild subsystem in TRNSYS software was used to emulate TMH cooling load demand using weather data for two selected locations (Hebron and Jericho cities). TRNSYS software was used to investigate the validity of the proposed system in summer (May to September) for the two suggested locations. Three main parameters were studied in the proposed system, location, evacuated tube solar collector (ETC) area and hot storage tank volume. The results of the overall simulation of the proposed system indicated that the system efficiency in Hebron city was much higher than Jericho city due to climate and design conditions. In addition, it is found that there were many options for the system size can be selected to provide a percentage of the human comfort.
Received: 03 March 2020, Accepted: 31 March 2020, Published Online: 14 April 2020
1. Introduction
The growing demand for human comfort has directed to a speedy increase in the use of the cooling system and, as a result, the demand for electricity especially in rural areas. Where the overall consumption from buildings, due to air conditioning systems, reach up to 40% in developed countries [1]. Palestine weather is considered an eligible candidate for the deployment of Renewable energy resources because Palestine allocated at the high sunny area where the annual average solar incident radiation is 5.4 kWh/m2/day. Deployment of a thermal refrigerator using solar energy, would provide a reasonable solution for such rural areas with advantage of decrease of energy consumption. Between the numerous technologies for the thermal refrigeration techniques, VJRC driven by solar thermal energy appear the most hopeful alternative to the vapor compression refrigeration cycle [2]. VJRC is simple to construct, robust, low operating maintenance and has no mechanical moving segments making it a highly unfailing system which is capable of running low temperature heat from solar energy or other substitute like waste heat, which can create a cheaper operation of the cooling system.
Constant pressure mixing ejector is more popular and efficient than constant area mixing ejector [3]. VJRC uses water, as a refrigerant which makes the system completely safe. Such systems were tested with high success in refrigeration in the early years of the last century. When using water as refrigerant, temperature attained is not enough for refrigeration applications but it is more efficient and satisfactory for air-conditioning, cooling, or chilling applications [4]. Water usage in VJRC has many advantages compared with other refrigerants, water is available and inexpensive, has a high latent heat, and has no environmental impacts such as ozone depletion and global warming.
Le Blanc and Parson the VJRC was first ones to develop the VJRC in early 1900. The deployment of VJRC was widespread in early 1930’s for air-conditioning systems in large buildings [5], The 1-D model of constant-pressure mixing ejector was initially developed in 1950 by Keenan et al [6]. In this model, the pressure of secondary and primary fluid is equivalent at the outlet of the nozzle. Where the two fluids mixing begins with constant pressure to reaches the inlet of the throat section. These concepts are still considered an effective for constant pressure mixing ejector. Several theoretical studies was carried out on operation conditions of the cycle such as the generator, condenser and evaporate temperature. Al-Khalidy [7], Rani [8] and Tashtoush et al [3] noted that the performance of the system decreased by increasing condenser temperature and decreasing evaporator and generator temperatures .Eames et al [9], Chunnanond et al [10] and Ruangtrakoon et al [11] experimented on a fixed geometry ejectors refrigerator Noticed that when the generator temperature increased the performance of the system decreased. Experimental results by Xiaoli Ma [12] using the water as refrigerant, Selvaraju [13] using R134a noted that the performance of the system increased up to maximum value at a certain generator temperature and then the performance goes to decreasing, and also [13] studied more than one ejector geometry and dimensions, and he noted that every ejector has an optimum and maximum performance at a certain value of generator temperature. Sun [14] study carried out on the variable geometry ejectors, it was noted that, with the variable geometry ejector. There are no limitations of the performance value of the system, when the generator temperature increased the performance increased without optimum generator temperature Thus, variable geometry ejectors are better than the of fixed geometry ejectors, which variable geometry ejector have a wide range of operation conditions to make it more flexible and reliable more the fixed geometry ejectors and more performance value. Variable geometry ejector can be achieved by using high industrial technology or by using more than one ejector in parallel in the same cycle, and only one ejector are used according to the performance of the system in the instant conditions .All the theoretical and experimental studies [7-14] concluded that the performance of the cycle increased when the evaporator temperature increased and the condenser temperature decreased.
Alexis and Karayiannis [15] studied the overall performance of the VJRC operated by solar energy and R134a as working fluid in the city of Athens along a period of 5 months from the beginning May until the end of September. It was found that the performance of the proposed system varied from 0.035 to 0.199 based on the operation conditions in which the generator temperature, condenser temperature and evaporator temperature varied. The temperatures were chosen between (82–92 ͦC), (32–40 ͦC) and (-10–0 ͦC) respectively. Where the overall system performance varied from 0.014 to 0.101 with the same operation conditions in July. Kursad Ersoy et al [16] worked on a simulation study with R123 as working fluid, ETC as collector in Turkey climates. The performance of the VJRC and the evacuated tube collector were hourly varied by solar radiation and weather temperature. The maximum performance of the system occurred in the noon time. Tashtoush et al [17] simulation study using R134a as working fluid and 7 kW cooling load at Jordan climate noted that increasing the hot storage tank size could improve the amount of solar collector useful energy gain. Many researchers used TRNSYS software for studying solar thermal cooling systems and refrigeration systems. Pridasawas and Lundqvist [18] tested the effect of the operation conditions and solar collector types on the VJRC performance they used iso-butane as a refrigerant. Tashtoush et al [17] simulate the solar collector angle and area ,he was study the performance of VJRC for the climatic conditions of Jordan with R134a as a refrigerant. Both of the aforementioned research were simulated in TRNSYS software. In addition, Ahmed et al [19], and Asim et al [20] used TRNSYS to simulate the absorption cooling system under climate of Egypt and Pakistan respectively.
This research aims to to use the TRNSYS software to simulate the VJRC under two different locations in Palestine; one in Hebron city which has a moderate weather and the second in Jericho city which has a very hot weather in summer. In addition, to estimate the possibility of compensate the cooling load demand of the TMH. Three main parameters were studied in the overall system, location, solar collector area and the storage tank volume.
2. Methodology
2.1. Location and Climate Description
Hebron city is located south of west bank at latitude 31.32°N and longitude 35.06°E. Hebron has relatively medium mean temperatures. The meteorological station is 1005 meters above sea level and the mean temperature is estimated 17.36 °C in 2015 according the Palestinian Meteorology (PAL MET) Agency [21]. Jericho city is located east of west bank at latitude 31.51°N and longitude 35.27°E. It is located in a relatively high mean temperature regions with summer temperatures rise up to 45 °C. The meteorological station is 260 meters below sea level and the mean temperature is estimated 24.77 °C for 2015 [21]
Figure. 1 shows the distribution of the ambient temperatures in the two cities, where the maximum ambient temperature in Hebron and Jericho cities reached to 38.7 °C and 45 °C respectively. Figure. 2 shows the distribution of the global horizontal solar radiation for the two cities, where the maximum hourly global horizontal solar radiation in Hebron city is 1157 W/m2, and the maximum hourly global horizontal solar radiation in Jericho city is 1180 W/m2.
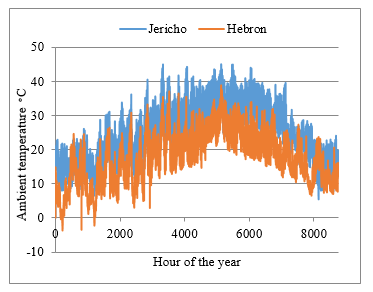 Figure.1. Annual distribution of ambient temperatures for Hebron and Jericho cities.
2.2. System Description
The proposed test system consists of three subsystems; VJRC subsystem, building cooling load subsystem and solar thermal subsystem. Figure. 3 shows the Schematic diagram of the overall proposed system. The solar energy that collected by solar collector was converted into heat in the solar thermal subsystem and then used by the generator to operate the power cycle in the VJRC subsystem. The refrigeration load that produced by the VJRC subsystem was used to compensate the cooling load demand in the TMH unit to achieve the human comfort.
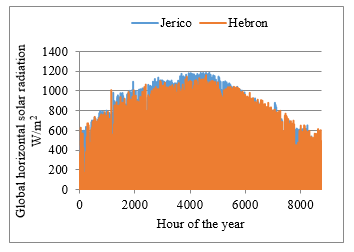 Figure. 2. Annual distribution of global horizontal solar radiation for Hebron and Jericho cities W/m2
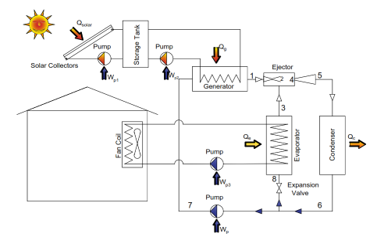 Figure.3. Schematic diagram of the proposed system.
2.2.1. VJRC description
Based on Figure. 3, it can be noticed that the VJRC subsystem consists of two cycles, the power cycle that consists from ejector, generator, condenser and circulation pump, and the refrigeration cycle that consists from ejector, evaporator, expansion valve and condenser. In the power cycle the primary fluid is vaporized by adding heat to the generator at high pressure, this fluid then passes through a supersonic ejector. In the ejector, the fluid velocity increased more than Mach number through the supersonic nozzle, and the pressure decreased to the evaporator pressure. The reduction in the pressure that occurs in the nozzle entrains the secondary fluid vapor from the evaporator. The two fluids then mix completely in the mixing chamber of the ejector and then enter the diffuser section where the mixed fluid velocity back decreases below Mach number and the pressure increased to reach the condenser pressure. The mixed fluid then flows to the condenser where it is reject heat to the ambient and condensed into liquid.
A portion of the liquid that leaving the condenser goes to a circulation pump where it will be pumped to the generator to complete the power cycle, the other part enters and expands in the expansion valve and enters to the evaporator in the refrigeration cycle as a mixture. In the evaporator, the refrigerant evaporates producing a refrigeration load, and the resulting vapor is then sucked by the primary fluid into the ejector to complete the refrigeration cycle.
2.2.2. Building description
The reference TMH that has been selected in this study was produced by Alamour Company for industrial and trading in Bedya-Jeneen. It is rectangular shape 8m*3m, and ceiling height is 2.6 m. It consists of two bedrooms, Kitchen and bathroom. Number of occupants are 3 persons. The sketch of TMH in Figure. 4 shows the architecture design, orientation and the zones dimensions.
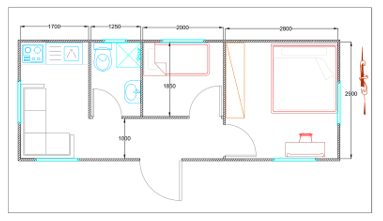 Figure.4. Architecture design of the TMH
2.2.3. Solar thermal subsystem
The ETC is the major component of the solar thermal subsystem, which collects the incident solar radiation from the sun, converts it into a heat, then transfers this heat to a heat transfer fluid (HTF), the energy which was collected then is carried by a circulated HTF to be used in a thermal energy storage tank.
2.2.4. Simulation
The current simulation study consists from three subsystems as mentioned. The VJRC was simulated by EES Software by with water as working fluid. The mathematical model and equations that used in this study are similar to the system used by Sun [14] for one-dimensional model of constant-pressure mixing ejector, which based on the steady flow energy equation, momentum and continuity equations [14]. In this subsystem the Mathematical model was carried out at various design conditions (generator, and condenser temperature), characteristic curves and tables for the VJRC were found where the generator temperature changed from 80°C to 150°C and the condenser temperature changed from 25°C to 50°C according to the weather and climate variations. The evaporator temperature was selected 10°C as fixed value. Characteristic tables for the cycle were created as an excel sheet table to be used as input file in the TRNSYS software, where the generator and condenser temperature were varied with step of 1 °C and 0.5 °C respectively.
The building cooling load subsystem was hourly simulated using the TRNBuild subsystem in TRNSYS software.the cooling load demand of the TMH was simulated according to the weather data for the two locations. As the TRNBuild view, the cooling load into the building arises from both radiative heat flow to the windows and walls and convective heat flow to the air node . Where the convection heat transfer comes from infiltration, ventilation, gains due to the convectional air flow from zones, internal surface gains and internal heat gains from people, equipment, illumination, radiators, etc. while the radiation heat transfer comes from, long wave radiation exchange between walls and all other walls, internal gains received by walls and windows, and solar radiation through zone windows and walls. [22]
The building prototype demonstrates the cooling load over the study period. The prototype is created in TRNBuild, Then the generated TRNBuild model is executed to TRNSYS simulation Studio as an input files by type 56 (multi-zone building). Noted that all the physical properties of the envelop constructions were taken according the Palestinian code for efficient buildings [23].
The overall solar thermal cooling system was hourly simulated by using the TRNSYS simulation studio that consist from VJRC subsystem as TRNSYS / Excel Coupling file (type 62) and the cooling load of the house by using Multi-zone building file(type 56), the overall simulation consider the solar energy collected by ETC at fixed optimum tilt angle 15 deg -based on the maximum amount of the total incident solar radiation for the study period[24], constant HTF flow at 0.02kg/s [25] and used hot energy storage tank to store the excess thermal energy for peak times or in the times where the sun radiation is absence. This energy delivered to the generator in the VJRC and used to operate the cycle and produce cooling effect in the evaporator. The cooling energy then delivered to a cooling coil to cover the cooling load demand of the house. Figure. 5 illustrated the overall TRNSYS simulation where the black solid lines represent the flow of system information, while the blue dotted lines show the flow of weather data Information, flow of control information and the flow of the output information from the simulation. In addition, Table 1 Shows the inputs and outputs descriptions of its elements [26].
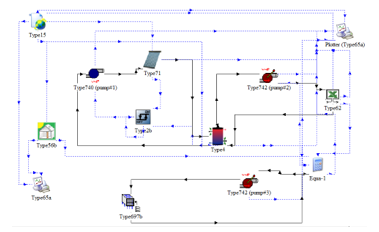 Figure.5. Simulation Studio window components for overall system
Table.1. Components of simulation Studio window and descriptions
| Components | Descriptions |
|
Whether data (type15-3) |
This component supports of reading the weather data from an external weather data file. Type: Energy plus Weather (EPW) format with hourly intervals [21] Location: Hebron and Jericho cities/Palestine |
|
Multi-zone building (type 56) |
Models the thermal behavior of a building Desired inside temperature: 22 °C Area:24m2 Height :2.6 m U-value of walls, roof, door and floor: 0.587 W/m2 °C (50 mm sandwich panel) U-value of window: 2.877 W/m2 °C (3-6-3 double glass aluminum frame window) Number of occupants: 3 persons Ventilation and infiltration :0.8 times per hour Heat gain from electrical equipment is 140 W Heat gain from lighting 10W/m2 Maximum cooling load demand: 5.35 kW Seasonal cooling energy demands: 5749 kWh/season |
|
Plotter (type 65a) |
Plotter is used to display the simulation data and results |
|
Solar Collector; Evacuated Tube (type71) |
Models a single-phase evacuated tube solar collector. η0 =80% [23] a1=1.5[W/(K·m²)] a2 =0.005 [W/(K²·m²)] HTF: THERMINOL 66, operating temperature from 0 °C to 345 °C at atmospheric pressure and the average specific heat of 1.9 kJ/kg.K at 120 °C. Flow rate:0.02kg/s/m2 Tilt angle 15° Azimuth: south. Area: variable (10,20,30,40,50,60 )m2 |
|
Storage Tank (Type4) |
Models of a hot storage tank. HTF: THERMINOL 66 Maximum temperature:160°C U-value: 0.5 W/m2 °C Volume: variable (0.5, 1, 1.5, 2) m3 |
|
Variable speed pump (Type742) |
Models a variable speed pump HTF: THERMINOL 66 |
|
Single speed pump (Type740) |
Models a single speed pump Flow rate:0.02kg/s/m2 collector area HTF: THERMINOL 66 |
|
TRNSYS / Excel Coupling (Type62) |
External model implements a link with Excel.
|
| ON/OFF Differential Controller (Type2) |
Controller with value of 0 or 1. Maximum storage tank set point temperature: 160°C |
|
Cooling Coil (Type697) |
Models an air cooled cooling coil. HTF: Water |
3. Results and Discussion
The characteristic curves for the VJRC obtained from EES are shown in Figure. 6. The Figure. shows that the COP of the cycle increases as the generator temperature increased. The reason for this is that the pressure ratio of the power cycle increase and more secondary flow will be entrained from the evaporator. In addition, it can be seen that the COP decreased remarkably as the condenser temperature increased. This due to low secondary flow will be entrained as condenser temperature increases under high-pressure ratio in the refrigeration cycle. in some cases, the COP equal zero when the generator temperature is low and condenser temperature very high, in this case the ejector system is failure and there is no secondary fluid entrained and flow.
Hourly cooling load demand were simulated using TRNBuild in the two locations and integrated during the study period, Where the maximum cooling load demand during the study period for Hebron and Jericho cities were: 5.35 kW and 7.02 kW respectively; and the total seasonal cooling energy demands were: 5749 kWh/year and 14864 kWh/year respectively, as shown in Figure. 7 .It can be noticed that Hebron city has less cooling load demand than Jericho. This is due to the lower ambient temperatures of Hebron city.
 Figure.6. Characteristic curves for VJRC at 10°C evaporator temperature
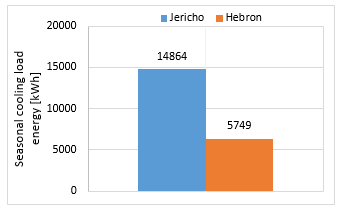 Figure.7. Total seasonal cooling energy demand for Hebron and Jericho cites
As rule of thumb the collector areas were chosen 10 m2 to 60 m2 with 5 m2 step and the storage tank volume from 0.5 m3 to 2 m3 with 0.5 m3 step for Hebron city. While for Jericho city, the collector areas were chosen from 10 m2 to 150 m2 with 10 m2 step and the storage tank from 0.5 m3 to 2 m3 with 0.5 m3 step. Figure. 8 shows the seasonal evaporator cooling energy as a percentage from the cooling energy demand at different collector area 10m2 to 60m2 and storage tank volume from 0.5m3 to 2m3 for Hebron city.
It can be noticed from Figure. 8 that the effect of the collector area has a proportional logarithmical effect on the evaporator cooling energy, where the evaporator cooling energy increased at high rate when the collector area was low and increased slowly after that. Therefore, the storage tank volume has a high impact on the system capacity and evaporator cooling load and energy. Figure. 8 also shows the effect of the storage tank volume on the evaporator cooling energy for Hebron city during the study period. It can be noticed that the relation between storage tank volume and the evaporator cooling energy availability is proportional at high collector areas and inversely proportional at low collector area. It is because the temperature of the storage tank is a function of the tank volume, and it was affected strongly on the cycle COP as shown in characteristic curves.
Finally, from Figure. 8 it is clear that the seasonal evaporator cooling energy changed from 42% at 10m2 collector area and 2m3 storage tank volume to 98.9% at 60m2 collector area and 2m3 storage tank volume. The optimal values of the collector area and the storage tank volume can be selected according to the suitable evaporator cooling energy availability during the study period, also depends on the philosophy of the designer, economics issues and the related standards. From the chart there are more than one case can be selected for the system according to the evaporator cooling energy availability, for example 30 m2 collector area &1.5m3 storage tank volume were selected where the cooling energy available represent is 95.4%, or 35 m2 collector area &1m3 storage tank where the cooling energy available represent is 95.1% ,
 Figure. 8 Percentage of seasonal evaporator cooling energy from the cooling energy demand for Hebron city at different collector area and storage tank volume
For Jericho, the overall system parameters shows in Figure. 9 where the collector area varies from 10m2 to 150m2 and storage tank volume from 0.5m3 to 2m3
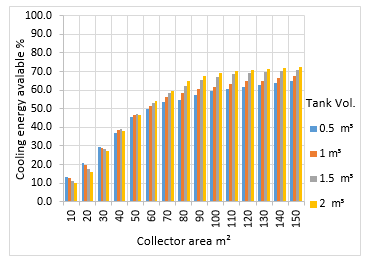 Figure.9. Percentage of seasonal evaporator cooling energy from the cooling energy demand for Jericho city at different collector area and storage tank volume
From Figure. 9 it is shown that the maximum seasonal evaporator cooling energy is reached to only 72.4 % at 150m2 collector area and 2m3 storage tank volume, where this value is very low. In Jericho the performance of the system was very low because the condenser temperature in the VJRC is high, also the cooling energy demand is high because the ambient temperature is high. This causes a very high extreme conditions that cannot be satisfied by the system at these conditions.
The overall efficiency is defined as the amount of cooled energy produces to the solar energy incident on the solar collectors. Figureure 10 shows the system seasonal efficiency for both tested cities. It is noticeable that the overall seasonal efficiency in Hebron was higher than Jericho city in most cases. Also, the efficiency is inversely proportional to the area of the solar collectors as shown in aforementioned Figureure.
 Figure.10. seasonal overall efficiency for Hebron and Jericho cities at different collector area at 1 m3 storage tank volume.
4. Conclusions
The study showed that solar thermal energy can operate the VJRC`s to achieve human comfort as well as reducing the environmental impacts such as global warming and ozone depletion is worth considering spatially in rural areas with moderate ambient temperature. Results showed that the performance of the VJRC depends strongly on the operating conditions, where the cycle COP increases when the generator temperature increases. In addition, the COP decreases with the increasing condensing temperatures. By that, the generator temperature must be high and the condensing temperature should remain low to maintain a good performance for the cycle.
Results showed that the higher surface area of the solar collectors, the value of the cooling energy produced increases logarithmically. For example, in Hebron city the maximum evaporator cooling energy reached 62.1%, 95.4% and 98.9% of the required cooling demand at a surface area of the solar collectors 10, 30 and 60 m2 respectively. While, the maximum evaporator cooling energy reached 14%, 58.8% and 72.4% of the required cooling demand at the surface area of the collector 10, 70 and 150 m2. Moreover, increase in the volume of the storage tank has a negative impact if the surface area of the solar collectors is low and a positive one if the surface area of the solar collectors is large. For example, in Hebron city the value of the evaporator cooling energy was 62.1% to 42% of the required cooling demand at collector surface area 10 m2 when the storage tank volume increased from 0.5 to 2 m3, while at solar collectors’ area of 35 m2 the evaporator cooling energy increased from 87.2% to 95.1%. The overall seasonal efficiency for the system in Hebron was higher than Jericho city in most of different circumstances which was tested.
Finally Using VJRC driven by solar thermal energy in Hebron city is thermally efficient in contrast to Jericho city where the proposed system showed a lake of cooling energy produced because a high condenser temperature. Where, applying this system in Hebron city can be done by the selection of more than one system size according to percentage of the human comfort needed.
- Pérez-Lombard, L., Ortiz, J. and Pout, C., 2008. A review on buildings energy consumption information. Energy and buildings, 40(3), pp.394-398.
- Besagni, G., Mereu, R. and Inzoli, F., 2016. Ejector refrigeration: a comprehensive review. Renewable and Sustainable Energy Reviews, 53, pp.373-407.
- Tashtoush, B., Alshare, A. and Al-Rifai, S., 2015. Performance study of ejector cooling cycle at critical mode under superheated primary flow. Energy Conversion and Management, 94, pp.300-310.
- Dincer, I., 2017. Refrigeration systems and applications. John Wiley & Sons.
- Meyer, A.J., Harms, T.M. and Dobson, R.T., 2009. Steam jet ejector cooling powered by waste or solar heat. Renewable Energy, 34(1), pp.297-306.
- Keenan, J.H., 1950. An investigation of ejector design by analysis and experiment. Journal of Applied Mechanics, 17, p.299.
- Al-Khalidy, N.A.H., 1997. Performance of solar refrigerant ejector refrigerating machine (No. CONF-9702141-). American Society of Heating, Refrigerating and Air-Conditioning Engineers, Inc., Atlanta, GA (United States).
- Rani, S. and Sachdeva, G., 2015. Theoretical Performance Analysis of Vapour Jet Ejector for R 134a. International Journal of Engineering, Management & Sciences, 2, pp.300-310.
- Eames, I.W., Aphornratana, S. and Haider, H., 1995. A theoretical and experimental study of a small-scale steam jet refrigerator. International journal of refrigeration, 18(6), pp.378-386.
- Chunnanond, K. and Aphornratana, S., 2004. An experimental investigation of a steam ejector refrigerator: the analysis of the pressure profile along the ejector. Applied Thermal Engineering, 24(2-3), pp.311-322.
- Ruangtrakoon, N., Aphornratana, S. and Sriveerakul, T., 2011. Experimental studies of a steam jet refrigeration cycle: effect of the primary nozzle geometries to system performance. Experimental Thermal and Fluid Science, 35(4), pp.676-683.
- Ma, X., Zhang, W., Omer, S.A. and Riffat, S.B., 2010. Experimental investigation of a novel steam ejector refrigerator suitable for solar energy applications. Applied Thermal Engineering, 30(11-12), pp.1320-1325.
- Selvaraju, A. and Mani, A., 2004. Analysis of an ejector with environment friendly refrigerants. Applied Thermal Engineering, 24(5-6), pp.827-838.
- Sun, D.W., 1996. Variable geometry ejectors and their applications in ejector refrigeration systems. Energy, 21(10), pp.919-929.
- Alexis, G.K. and Karayiannis, E.K., 2005. A solar ejector cooling system using refrigerant R134a in the Athens area. Renewable Energy, 30(9), pp.1457-1469.
- Raza H. A. et al., “Analysis the effect of 500kv High-Voltage Power Transmission Line on the Output Efficiency of Solar-Panels,” in 2019 International Conference on Electrical, Communication, and Computer Engineering (ICECCE), 2019, pp. 1–6.
- Tashtoush, B., Alshare, A. and Al-Rifai, S., 2015. Hourly dynamic simulation of solar ejector cooling system using TRNSYS for Jordanian climate. Energy conversion and management, 100, pp.288-299.
- Pridasawas, W. and Lundqvist, P., 2007. A year-round dynamic simulation of a solar-driven ejector refrigeration system with iso-butane as a refrigerant. International Journal of Refrigeration, 30(5), pp.840-850.
- AHMED, M.H., MONTAGNINO, F., AMIN, A. and HASSAN, R., Modelling of Solar Absorption Cooling System under Egypt Climate Using TRNSYS. Environment and Financial Science, ISBN: 978-1-61804-361-0.
- Asim, M., Dewsbury, J. and Kanan, S., 2016. TRNSYS simulation of a solar cooling system for the hot climate of Pakistan. Energy Procedia, 91, pp.702-706.
- Palestinian Meteorology (PAL MET) in Palestine. http://www.pmd.ps.
- Klein, S.A., Beckman, W.A., Mitchell, J.W., Duffie, J.A., Duffie, N.A., Freeman, T.L., Mitchell, J.C., Braun, J.E., Evans, B.L. and Kummer, J.P., 2004. Trnsys 16—Volume 6 Multizone Building Modeling with Type 56 and Trnbuild. Solar Energy Laboratory, University of Wisconsin: Madison, WI, USA.
- Palestinian authority, Ministry of local government.2004. Energy Efficient Building Code. .
- Masters, G.M., 2013. Renewable and efficient electric power systems. John Wiley & Sons.
- Viessmann co., Technical Guide-Solar thermal systems 2009. https://www.viessmann.com.
- Klein, S.A., Beckman, W.A., Mitchell, J.W., Duffie, J.A., Duffie, N.A., Freeman, T.L., Mitchell, J.C., Braun, J.E., Evans, B.L. and Kummer, J.P., 2005. Trnsys 16—Volume 3 Standard Component Library Overview. Solar Energy Laboratory, University of Wisconsin: Madison, WI, USA, p.92.