Determinants of Students’ Actual use of the Learning Management System (LMS): An Empirical Analysis of a Research Model

Adv. Sci. Technol. Eng. Syst. J. 5(2), 614–620 (2020);
 DOI: 10.25046/aj050277
This study built and tested a research model to determine the determinants that impact students’ actual use of the learning management system. A survey questionnaire was used to gather data from 148 university students who used LMS in their course of study. The structural equation model was used to analyze quantitative data. The study revealed that (1) performance expectancy, effort expectancy and institutional support positively impacted students’ actual use of LMS, (2) social influence and infrastructure support did not positively impact students’ actual use, (3) gender had a significantly moderated effect on the correlation between institutional support and actual usage of technology. This study added to existing studies on the use of UTAUT in explaining students’ actual use of technology in developing nations. Implications for practice, drawbacks and future directions are discussed.
1. Introduction
Information technology has caused a series of changes in higher institutions by transforming the previous idea of learning [1]. The LMS is among the evolving technological tools that supports e-learning. LMS is a web-based system that facilitates web-based interaction between teachers and students [2], offers educators and trainers kits to develop and present study materials, check student involvement and assess learner performance, provides students with the means of networking with peers via chat, group conversation and video conferencing [3]. The most common LMS used in schools include Modular Object-Oriented Dynamic Learning Environment (MOODLE), Blackboard, WebCT and Desire2Learn [4]-[5]. Several higher learning institutions have spent millions of dollars in ICT facilities to aid the quality of the instruction process [6]-[7]. However, this capital spending will be useless if students do not accept the system [8]. A meta-analysis of LMS acceptance and use in sub-Saharan Africa (SSA) from 2007-2017 by [9], revealed a lack of research on LMS use in SSA. [9] proposed that further study should be conducted on the determinants of LMS use and acceptance in SSA by adopting the Unified Theory of Acceptance and Use of Technology (UTAUT) model [9]. Additionally, [9] suggested that a more rigorous numerical analysis such as the structural equation model (SEM) be used to determine the factors that influence LMS usage. Therefore, it is critical to examine the determinants of LMS use and acceptance in SSA, particularly in Ghana.
This present study was conducted at Pentecost University College (PUC). The University College is found in Accra, Ghana, and has 2,500 students and 100 lecturers. In 2012, the University College implemented MOODLE LMS to supplement its standard face-to-face teaching. The MOODLE offers instructors with attributes such as course and user-management tools, discussion forums, quizzes and announcements to support their coaching experience. It also offers support in the management of the e-learning process by storing learners’ information organized, making course materials accessible to learners, tracking learners’ progress and generating reports, supporting collaboration with learners and providing testing and evaluation tools. It also allows learners to submit assignments. The MOODLE is used to support the teaching and learning process in any subject area. The system supports contents such as text, image, audio, and video to facilitate teaching and learning. Instructors register with the system to use it. After registration, the system validates the instructor’s email address, approves it and activates it. Though MOODLE LMS was introduced to deliver online courses to students in the institution, most of the lecturers and students have not adopted the system. Hence, for the successful use of the LMS, it is important to understand the determinants that impact the real usage of the LMS. Studies have revealed that the real implementation of LMS has not been fully studied in SSA nations [9], and even, the scanty studies on LMS have focused on technical issues ignoring inquiries on the determinants that impact users’ real application of LMS [10]. These identified gaps have motivated the researchers to research into the determinants that affect the learners’ actual application of LMS.
The objectives of this work are in two folds: (1) to explore the determinants that are significant for the use of e-learning system, in precise, the LMS in a Ghanaian university and (2) to build a research model integrating the factors that are directly essential for e-learning usage as well as to determine its efficacy in explaining students’ actual use of LMS.
This manuscript is structured as follows: Initially, the theoretical model is described. Second, the new research model is discussed. Third, hypotheses are developed. Fourth, the research method (population, data collection, measures, and data analysis) is described. Fifth, the results of the study are explained. sixth, the conclusion is drawn. Finally, drawbacks and future studies are discussed.
2. Theoretical Framework
2.1. The UTAUT
The UTAUT model, [11], is prevalent in studies relating to online learning. As shown in figure 1, the UTAUT model consists of four key constructs that influence the users’ use of the technology. These constructs are performance expectancy (PE), effort expectancy (EE), social influence (SI) and facilitating conditions (FC). Additionally, the model consists of four moderating constructs. These are gender, age, experience and voluntariness of use [11]. Regarding the rate of application, UTAUT lags behind Technology Accepted Model (TAM) indicating that for the past decade, UTAUT is yet unpopular in reports in SSA [9]. Furthermore, a current study conducted on the use of technology, revealed that findings from studies using UTAUT might differ in diverse cultural settings [12], hence, it is essential to investigate UTAUT in diverse cultural backgrounds to augment the current literature on UTAUT. Therefore, this study used the UTAUT model to explain the determinants of students’ actual use of LMS in universities in SSA.
3. The New Research Model
The main variables of the new research model were PE, EE, SI, IC and IS. The moderating variables were gender and age. In the new research model, the FC construct was broken into (1) IC and (2) IS. This is to determine the exact variable of facilitating condition construct which impacts students’ actual use of LMS. In the new model, ‘actual use’ was used as an endogenous variable because of students’ real application of LMS. Voluntariness and experience of use variables were excluded as explained by [13]. The introduction of IC, IS and actual use variables differentiate the new research model from the original UTAUT (see Fig 1). Therefore, IC, IS, PE, EE and SI explain the level of the actual use of students’ LMS. The research model for this study is shown in Figure 2 below.
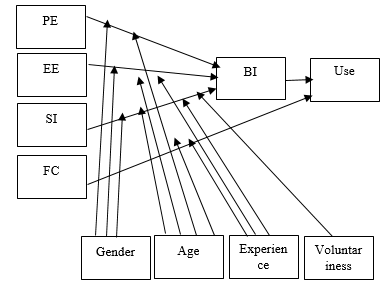 Figure 1: UTAUT model [11]
Note: BI stands for behavioral intention
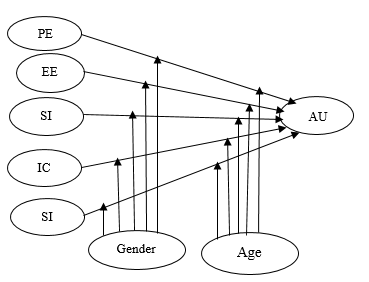 Figure 2: New study model
- PE is the belief that the performance of the user will increase with LMS use. [11].
- EE: is the trust that LMS will be easy to use [11].
- SIis a trust held by important people in the society that LMS in question should be used [11].
- IC is the belief that the technological facilities that support students to use the LMS exist.
- ISis the belief that the technological assistance the institutions offer exist.
- Actual use (AU): students’ realapplication of the LMS.
- Gender: The gender of the student.
- Age: The age of the student.
4. Hypothesis Development
4.1. Performance Expectancy
PE is the belief that the performance of the user will increase with LMS usage [11]. According to [13] PE significantly related to technology usage. Similarly, [14] found that PE substantially related to the usage of a web-based tutoring system. Another study by [15] revealed that PE positively related to technology use. In related studies, it is shown that PE significantly impacts behavioral intention more strongly for men [11], [16]-[18]. Similarly, [11], [17], [19] have found that the older person drifts to use technology minimizes. Considering these pieces of evidence, the following hypotheses were deduced:
H1a: PE would have a significant effect on the AU of LMS.
H1b: The PE significant effect on AU of LMS would be higher when the student is male.
H1c: The PE significant effect on AU of LMS would be higher when the student is younger.
4.2. Effort Expectancy
EE is the trust that the system will be easy to use [11]. According to [20], EE significantly influences the use of technology. Also, [21] revealed that EE significantly related to technology usage. In a related study, [13] found out that EE had a significant effect on students’ use of LMS. In another study, [11], [17] have posited that age and gender play a moderating role in EE and users’ behavioral intention. Based on the literature above, the under-listed hypotheses were developed:
H2a: EE would have a significant effect on the AU of LMS.
H2b: The EE significant effect on AU of LMS would be higher when the student is female.
H2c: The EE significant effect on AU of LMS would be higher when the student is young.
4.3. Social Influence
SI is the extent one deems it important to use technology because a colleague or superior has asked him to use the technology [11]. Researchers, including [22] postulates that LMS usage ought not only to address the high-tech issues but also to consider the social environments where the technology is used. Also, [22] found that there is scant knowledge about the social issues regarding technology application in developing nations. In a similar work, [23] stated that SI positively influenced technology use. Moreover, a study by [24] on learners’ LMS implementation revealed that SI significantly impacted AU. In a comparable work, [25] confirmed that a significant correlation exists between SI and LMS usage intention. Furthermore, [8], [17] have reported that females are more inclined to be influenced by their colleagues to use technology than males. Additionally, [16] found that age moderates significantly on the association that exist between SI and behavioral intention to use technology.
From the evidence outlined above, the hypotheses below were deduced:
H3a: SI would have a significant effect on the AU of LMS.
H3b: The SI significant effect on AU of LMS would be higher when the student is female.
H3c: The SI significant effect on AU of LMS would be higher when the student is older.
4.4. Facilitating Condition (FC)
FC is the level at which one believes that institutional and technical support are present to implement the system [11]. Training, support, institutional policy, ICT infrastructure, and leadership are the key elements considered to affect FC [26]. Many scholars have studied the impact of FC on LMS usage. [27] for instance, found out that technical support and lack of suitable equipment, and other resource availability issues significantly impacted LMS usage. [28] on the other hand, postulated that making computers and computer networks available to students will not necessarily influence usage but also administrative and institutional support should be in place to facilitate the system use. Numerous academicians also have stated the importance of support and training as core FC in e-learning use [29]-[30]. Besides, [9] has confirmed that FC significantly impacts students’ usage of e-learning resources. [16] has also concluded in his study that age and gender significantly moderate FC and users’ intention to use technology. In this study, FC was divided into IC and IS. From the above evidence, the following hypotheses were formulated:
H4a: IC would have a significant effect on the AU of LMS.
H4b: The IC significant effect on AU of LMS would be higher when the student is young.
H4c: The IC significant effect on AU of LMS would be higher when the student is female.
H5a: IS would have a significant effect on AU of LMS
H5b: The IS significant effect on AU of LMS would be higher when the student is female.
H5c: The IS significant effect on AU of LMS would be higher when the student is young.
5. Method
In the present study, a case study approach was adopted based on the recommendation that it is a suitable strategy for studying technological intervention in education [31]. Moreover, [32] states that case studies enable researchers to learn more from a particular situation.
5.1. Population and Data Collection Procedure
A total of 160 students took part in this study. The students were enrolled in undergraduate programs. A simple random sampling procedure was applied to choose the respondents from all the school year levels (Year 1 to Year 4) who were studying Business and Science courses. Before administering the questionnaires to the participants, they were told that their involvement was optional, and their anonymity was guaranteed. Additionally, the respondents were informed of the purpose of the study before administering the online questionnaire to them. The online questionnaires were completed after the respondents had taken a semester course. To enhance the rate of response, students were regularly reminded to complete the online questionnaires. Overall, 148 questionnaires were received. Of the 148 partakers, 69% were males and 31% were females, 23% were in the age range of 17 and 22 whereas 77% were more than 23 years, 40% of students were in Year 3 while 26% were in Year 2 (see Table 1). According to [33], a sample size between 100 and 150 cases is ideal for the Partial least square structural equation model (PLS-SEM). Consequently, a sample size of 148 students in this study was suitable for analysis using PLS-SEM.
5.2. Measures
The variables used in this study were taken from the earlier research works. The observed variables for EE, PE, SI, IS and IC were adapted from [11]. The PE construct contained four items; the EE composed of four variables; the SI had two variables. IC and IS, each comprised of five variables. A 5-point Likert scale was adopted and started from 1 representing “strongly disagree” to 5 representing “strongly agree”. On average, each partaker used at least 30 minutes to complete the questionnaire.
5.3. Data Analysis
PLS-SEM was used to analyze the quantitative data gathered from the respondents. PLS-SEM has been used in a broad array of disciplines such as Information Systems [34]. However, literature is lacking in the application of PLS-SEM in studies relating to LMS usage, particularly, in SSA [9]. Hence the use of PLS-SEM for the data analysis. The two-step approach of [35] was used for the PLS-SEM analysis. The first step measures the measurement model which comprises convergent and discriminant validities. The second step calculates the structural model.
6. Results
6.1. Measurement Model Assessment
6.1.1 Convergent Validity
The convergent validity was calculated on three stages: item reliability, composite reliability (CR) and average variance extracted (AVE) [36]. The item reliability is measured by the factor loading of an item of the construct in the model. [33] posits that a factor loading of a construct is judged reliable if its value is equal to or higher than 0.5. Table 2 shows that the factor loadings of each construct’s items ranged between .56 and .93 confirming [33]’s assertion. Again, [33] postulates that, for a construct to be reliable, both its CA (α), as well as CR, should be greater than 0.7. From Table 2, CA as well as the CR of all the constructs exceeded 0.7, confirming the assertion of [33]. A further test of convergent validity, the AVE was conducted. Table 2 revealed that the AVEs of the constructs surpass 0.5 inferring that the convergent validity is acceptable [36].
Table 1: Demographics of the Respondents
| Item | Type | Count | Proportion |
| Gender | Male | 102 | 69% |
| Female | 46 | 31% | |
| Total | 148 | 100% | |
| Age | 17-22 (Young) | 34 | 23% |
| >=23 (Old) |
114 | 77% | |
| Total | 148 | 100% | |
| School year | First Year | 34 | 23% |
| Second Year | 26 | 18% | |
| Third Year | 59 | 40% | |
| Fourth Year | 29 | 20% | |
| Total | 148 | 100% |
Table 2: Convergent Validity
| AU | EE | IC | IS | PE | SI | CA | CR | AVE | |
| AU1 | .90 | .47 | .21 | .35 | .44 | .22 | .87 | .92 | .79 |
| AU2 | .86 | .34 | .18 | .35 | .38 | .23 | |||
| AU3 | .91 | .47 | .19 | .33 | .39 | .20 | |||
| EE1 | .35 | .76 | .41 | .29 | .46 | .32 | .79 | .86 | .62 |
| EE2 | .31 | .70 | .31 | .15 | .45 | .30 | |||
| EE3 | .41 | .83 | .34 | .35 | .55 | .30 | |||
| EE4 | .43 | .84 | .41 | .34 | .48 | .35 | |||
| IC1 | .16 | .43 | .77 | .45 | .29 | .37 | .72 | .84 | .64 |
| IC2 | .14 | .35 | .78 | .32 | .28 | .31 | |||
| IC3 | .21 | .35 | .84 | .39 | .28 | .28 | |||
| IS1 | .19 | .21 | 32 | .56 | .21 | .33 | .75 | .83 | .50 |
| IS2 | .30 | .31 | .37 | .78 | .20 | .24 | |||
| IS3 | .31 | .30 | .36 | .71 | .22 | .33 | |||
| IS4 | .24 | .19 | .31 | .72 | .16 | .34 | |||
| IS5 | .30 | .27 | .35 | .76 | .17 | .34 | |||
| PE1 | .39 | .54 | .28 | .20 | .78 | .31 | .78 | .86 | .60 |
| PE2 | .26 | .41 | .25 | .12 | .66 | .18 | |||
| PE3 | .41 | .50 | .33 | .25 | .87 | .50 | |||
| PE4 | .31 | .47 | .22 | .24 | .77 | .46 | |||
| SI1 | .24 | .39 | .39 | .43 | .46 | .93 | .79 | .90 | .82 |
| SI2 | .19 | .34 | .31 | .36 | .41 | .88 |
6.1.2 Discriminant Validity
Discriminant validity is measured by the following criteria: (1) Each construct’s loadings should exceed the cross-loadings of all the constructs [37]-[38], (2) the square roots of AVE of each construct should surpass the biggest squared correlations between any other construct [36]. Table 3 depicts the square roots of AVE (in bold) of each construct.
Table 3: Discriminant Validity
| AU | EE | IC | IS | PE | SI | |
| AU | 0.89 | |||||
| EE | 0.48 | 0.78 | ||||
| IC | 0.22 | 0.47 | 0.80 | |||
| IS | 0.39 | 0.37 | 0.48 | 0.71 | ||
| PE | 0.45 | 0.62 | 0.35 | 0.27 | 0.77 | |
| SI | 0.24 | 0.4 | 0.39 | 0.44 | 0.48 | 0.91 |
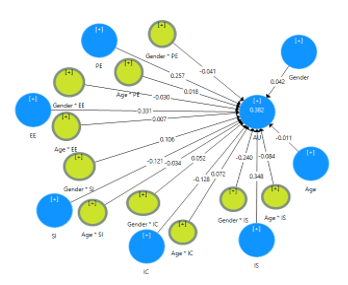 Figure 3: Structural model results
6.2. Structural Model Assessment
The bootstrap method of resampling of 5,000 iterations was performed to test the coefficients of the individual paths of the structural model. According to [39] the structural model’s explanation relies on the coefficient of determination, R2, to explain endogenous variable. The results of the structural model are given in Figure 3.
Table 4: Path Coefficients
| Hypotheses | Path | Path coefficient | t-statistics | p-values | Result |
| H1a | PE -> AU | 0.26 | 2.66 | 0.01 | Confirmed |
| H1b | Gender * PE -> AU | -0.04 | 0.37 | 0.71 | Unconfirmed |
| H1c | Age * PE -> AU | 0.02 | 0.18 | 0.86 | Unconfirmed |
| H2a | EE -> AU | 0.33 | 3.32 | 0.00 | Confirmed |
| H2b | Gender * EE -> AU | -0.03 | 0.32 | 0.75 | Unconfirmed |
| H2c | Age * EE -> AU | 0.01 | 0.07 | 0.95 | Unconfirmed |
| H3a | SI -> AU | -0.12 | 1.31 | 0.19 | Unconfirmed |
| H3b | Gender * SI -> AU | 0.11 | 0.96 | 0.34 | Unconfirmed |
| H3c | Age * SI -> AU | -0.03 | 0.39 | 0.69 | Unconfirmed |
| H4a | IC -> AU | -0.13 | 1.39 | 0.16 | Unconfirmed |
| H4b | Gender * IC -> AU | 0.05 | 0.53 | 0.60 | Unconfirmed |
| H4c | Age * IC -> AU | 0.07 | 0.85 | 0.40 | Unconfirmed |
| H5a | IS -> AU | 0.35 | 3.40 | 0.00 | Confirmed |
| H5b | Gender * IS -> AU | -0.24 | 2.36 | 0.02 | Confirmed |
| H5c | Age * IS -> AU | -0.08 | 0.74 | 0.46 | Unconfirmed |
6.3. Hypotheses Testing
From Table 4, PE had a significant effect on actual use of LMS (β = 0.26, p = 0.01), hence supporting H1a. Also, the effect of effort expectancy on students’ actual use of LMS was significant (β = 0.33, p = 0.00), supporting H2a. Furthermore, IS had significant impact on actual use of LMS (β = 0.35, p = 0.00), supporting H5a. However, SI (β = -0.12, p = 0.19) and IC (β = -0.13, p = 0.16) did not have a significant effect on the actual use of LMS, hence dH3a and H4a were not supported. Regarding the moderating effects of age and gender, gender moderated significantly on the correlation between institutional support and actual use of LMS (β = -0.24, p = 0.02). Moreover, Figure 4 shows that, as institutional support increases the actual use also increases for both males and female, but the increment is higher in females than in males, confirming H5b. However, the hypotheses H1b, H1c, H2b, H2c, H3b, H3c, H4b, H4c, and H5c were all not supported.
The actual use of LMS was significantly explained by PE, EE, SI, IC and IS, and the moderating effects of gender and age at R2 = 0.38, showing the five independent variables and the two moderating variables explained 38% of the change in AU. Moreover, in this work, the value for the standardized root mean square residual (SRMR) was 0.069, suggesting a good model fit. This value confirms [40] assertion that SRMR value less than 0.1 gives an acceptable fit model. The result of the structural model is shown in Figure 3.
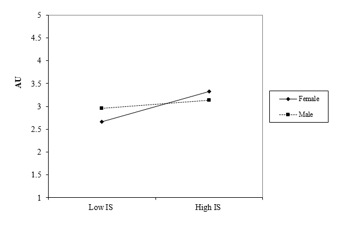 Figure 4: Moderating effect of gender on the correlation between Institutional Support (IS) and Actual Use (AU)
7. Discussions
This study intended to examine the determinants of students’ actual use of the learning management system (LMS). [41] stated that knowing the determinants of an e-learning system is key to acquiring better discoveries and answers [42] also stressed that students and teachers should be encouraged to use the e-learning system. The research model accounted for 38% of the change in students’ actual implementation of LMS, confirming that the new model is suitable in explaining learners’ implementation of LMS.
The association between PE and actual usage of LMS was shown to be significant, implying that the greater the PE of a system, the greater the actual usage. Therefore, administrators should consider the benefits the students will gain from a system when planning to acquire one. This result was in agreement with previous studies [13], [14].
Furthermore, there was a significant correlation between EE and actual, implying that students will be willing to use the LMS if it is flexible, but will refuse to use the system if it is not flexible to use. This finding is in agreement with [11]. Additionally, this study revealed that SI did not significantly relate to actual use. This result is in disagreement with previous studies [23], [24]. This finding could be explained that the students are technology savvy and know the benefits of technology hence they do not need peers or any other entity to influence their use. Also, it was found that the IC did not impact the actual use of LMS. This means that IC singly was not sufficient to stimulate learners’ use of the system.
Finally, it was revealed that IS significantly related to students’ actual use of LMS. This result is in agreement with prior works such as [27] [28]. Moreover, it was reported that as the institutional support increases so as actual usage increases for both males and females, but the increment is more significant in females than in males. This is in agreement with [16] who found out that gender moderated significantly on the correlation between facilitating condition and intention to use technology. According to [29], training and support are significant elements of individuals’ use of technology.
8. Conclusion
The present study contributes to knowledge by providing first-hand data that the research model elucidates the determinants of learners’ technology use. The research model elucidates 38% of the changes in learners’ technology use. This finding has provided empirical data for studying several determinants that impact on students’ actual application of technology. From a research point of view, this study primarily attempted to validate the findings from previous studies by empirically determining learners’ actual implementation of LMS using UTAUT in unindustrialized nations. Future studies should examine other determinants such as technology self-confidence, individual innovativeness, and attitude that influence the usage of technology [43]. Although these may further explain the actual implementation of technology, it cannot assure us that the coefficient of determination of a new framework would be improved. To conclude, this study found that the new model was suitable for explaining the determinants of learners’ actual application of technology.
9. Implication for Practice
PE and EE were found to be strongly related to the actual use. Irrespective of the usefulness of technology, users would be unwilling to use the technology if they find it to be cumbersome and difficult to use. Hence, management should consider the user-friendliness and flexibility of technology, as well as, its usefulness when adopting one. Additionally, educating academicians and learners would promote the use of technology in the instructional process. Furthermore, management in educational institutions should pay more attention to the provision of institutional support for learners and instructors. This would encourage lecturers and learners to use the online learning system to boost their self-confidence as well. [44] concluded that institutional support has a positive effect on the use of the e-learning learning system.
10. Drawbacks and Future Studies
The drawbacks of this study are: (1) Since this study involved one university, it is difficult to generalize the finding to other institutions, considering variations in the use of technology in different institutions. Therefore, future research should be done in other universities. (2) Thirty-eight percent (38%) of the change of the dependent variable was elucidated by the exogenous variables. Other variables should be considered in future studies to unearth the outstanding 62%. (3) In this study, a cross-sectional strategy was adopted to gather data. In future studies, the longitudinal method ought to be employed to collect data from the partakers. (4) the use of other moderating factors is recommended for future studies. Finally, instead of using a questionnaire to collect data, future studies should use interviews to collect data from the partakers.
- A. Hassanzadeh, F. Kanaani, S. Elahi, “A model for measuring e-learning systems success in universities” Expert Syst. Appl, 39 (12), 10959 –10966, 2012.
- K. A. Al-Busaidi, K. and H. Al-Shihi. “Instructors’ Acceptance of Learning Management Systems: A Theoretical Framework,” Communications of the IBIMA, vol. 2010, 2010.
- C.S. Nair, R. Patil, “A Study on the Impact of Learning Management Systems on Students of a University College in Sultanate of Oman”, Int. J. Comput. Sci, 9(2), .379–385, 2012.
- R, Ahmad, R. Edwards, R. Tomkinson, “The use of WebCT in distance learning course in university of manchester”, The Turkish Online J. Dist. Educ, 7(2), 101-108, 2006.
- C. Hong, Walker, D. A, “A confirmatory factor analysis of the Technology Acceptance”, General Linear Model J.l, 41(2), 22-29, 2015.
- A.N. Islam, “Investigating e-learning system usage outcomes in the university context”, Comput. Educ., 69, 387–399, 2013.
- M.. Waheed, K. Kaur, N. Ain, N. Hussain., “Perceived learning outcomes from moodle: an empirical study of intrinsic and extrinsic motivating factors”, Inf. Dev, 32(4), 1001-1013, 2015.
- N.D. Oye, N.A. Iahad, N. Ab.Rahim, “The history of UTAUT model and its impact on ICT acceptance and usage by academicians”, Educ. Inf. Tech, 19(1), 251-270, 2014.
- B. Bervell and I. N. Umar, “A decade of LMS acceptance and adoption research in Sub-Sahara African higher education: A systematic review of models, methodologies, milestones and main challenges”, Eurasia J. Math. Sci. Tech. Educ, 13(11), 7269–7286, 2017.
- T. Teo., N. Ruangrit, J. Khlaisang, T. Thammetarand, K.S. Jumnong, “Exploring e-learning acceptance among university students in Thailand: A National Survey”, J. Educ. Comput. Res, 50(4), 489-506, 2014
- V. Venkatesh, M.G. Morris, G.B. Davis, F.D. Davis, “User acceptance of information technology: Toward a unified view”, MIS Quart, 27(3), 425–478, 2003.
- W.R. King, J. He, “A meta-analysis of the technology acceptance model”, Inf. Manage, .43(6), 740–755, 2006
- N.D. Evans, and J. le Roux, “Modelling the acceptance and use of electronic learning at the University of Zululand”, S. Afric. J. Librar. Inf. Sci, 81(2), 26-38, 2015.
- P.C. Nanchang, “Student Acceptance of Web-based Learning System.Proceeding of the 2009 International Symposium on Web information Systems and application (WISA 2009)”, China, 2009.
- B. Sumak, G. Polancic, M. Hericko, “An empirical study of virtual learning environment adoption using UTAUT in 2010 Second Int. Conf. on Mobile, Hybrid, and On-line Learning ELML. Saint Maarten, 2010.
- K. Ghalandari, “The effect of performance expectancy, effort expectancy, social influence and facilitating conditions on acceptance of e-banking services in Iran: The moderating role of age and gender”, Mid-East J. Scient. Res., 12(6), 801-807, 2012
- O. A. Aliyu, C. Arasanmi, S. Ekundayo, “Do demographic characteristics moderate the acceptance and use of the Moodle learning system among business students?”, Int. J. Edu. Dev. Comm. Tech., 15(5), 165-178, 2019.
- Wang, Y.-S., Shih, Y.-W, “Why do people use information kiosks? Validation of the Unified Theory of Acceptance and Use of Technology”, Govern. Inf. Quart, 26(1), 158-165,2009, doi:https://doi.org/10.1016/j.giq.2008.07.001
- K. Magsamen-Conrad, S. Upadhyaya, C.Y. Joa, J. Dowd, (2015, “Bridging the divide: Using UTAUT to predict multigenerational tablet adoption practices”, Comput. Hum. Behav, 50, 186-196, 2015.
- N. Ain, K. Kaur, M. Waheed, “The influence of learning value on learning management system use: An extension of UTAUT2”, Inf. Dev, 32(5), 1306-1321, 2016.
- A. Raman, Y. Don, “Preservice teachers’ acceptance of learning management software: An application of the UTAUT2 Model”, Int. Educ. Stud, 6(7), 157–164, 2013.
- T. Ali, H. Kate and L. Xiaohui, “Factors Affecting Students Acceptance of E-learning Environments in Developing Countries: A structural Equation Modeling Approach” Int J. Inf. Educ. Tech, 3(1), 54-59, 2013.
- Y.L. Wu, Y.H. Tao, P.C. Yang, “The use of unified theory of acceptance and use of technology to confer the behavioral model of 3G mobile telecommunication users”, J. Stat. Manage. Syst, 11(5), 919-949, 2008
- A. Raman, Y. Don, R. Khalid, M. Rizuan, “Usage of Learning Management System (Moodle) among Postgraduate Students: UTAUT Model”, Asian Soc. Sci., 10(14), 186-192, 2014
- A. Fidani and F. Idrizi. “Investigating students’ acceptance of a learning management system in university education: A structural equation modeling approach” in 2012 ICT Innovation Web Proceedings, Macedonia, 2012.
- V. Venkatesh, Bala, H, “Technology acceptance model 3 and a research agenda on interventions”, Decis. Sci, 39(2), 273-315, 2008.
- M. S. H. Khan, “Barriers to the introduction of ICT into education in developing countries: The example of Bangladesh”, Int. J. Inst, 5(2), 61-80, 2012.
- J. Brinkerhoff, “Effects of a long duration, professional development academy on technology skills, computer self-efficacy, and technology integration and beliefs”, J. Res. Tech. Educ, 39(1), 22 – 43, 2006.
- D. Jenkins, C. Mimbs, T. Kitchel, “Computer Literacy, Access, and Use of Technology in the Family and Consumer Sciences Classroom”, J. Fam. Consum. Sci. Educ., 27(1), 1–13, 2009.
- R. Chen, “Investigating models for preservice teachers’ use of technology to support student-centered learning”, Comput. Educ., 55(1), 32–42, 2010.
- B.M. Sharan, Qualitative Research: A Guide to Design and Implementation, San Francisco: Wiley, 2009.
- B. Flyvbjerg. “Five Misunderstandings About Case-Study Research”, Qual. Inqui., 12(2), 219-245, 2006.
- J.F. Hair, G.T.M. Hult, C. Ringle, M. Sarstedt, A Primer on Partial Least Squares Structural Equation Modeling (PLS-SEM), Thousand Oaks: Sage Publications, 2016.
- A. Suh, C. Wagner, L. Liu, “Enhancing User Engagement through Gamification”, J. Comput. Inf. Syst, 58(3), 204-213, 2018.
- A. Ahmed et al., “Modeling and Simulation of Office Desk Illumination Using ZEMAX,” in 2019 International Conference on Electrical, Communication, and Computer Engineering (ICECCE), 2019, pp. 1–6.
- C. Fornell, D.F. Larcker, “Evaluating structural equation models with unobservable variables and measurement error”, J. Mark. Res, 18(1), 39-50, 1981
- W.W. Chin, “The partial least squares approach to structural equation modeling. In G.A. Macoulides (Ed.), Methodology for business and management. Modern methods for business research”, Lawrence Erlbaum Associates Publishers, 1998.
- J, Henseler, C.M. Ringle, Sinkovics, R.R, “The use of partial least squares path modeling in international marketing. In R.R. Sinkovics and P.N. Ghauri, Eds., New Challenges to International Marketing”, Emerald Group Publishing Limited, 2009.
- K.S. Ofori, H. Boateng, A.F. Okoe, I. Gvozdanovic, “Examining customers’ continuance intentions towards internet banking usage”, Mark. Intell. Plann, 35(6), 756-773, 2017
- C. Sengul, E. Ilker (2015) “Comparison of model fit indices used in structural equation modeling under multivariate normality”, J. Mod. Appl. Stat. Meth, 14(1), 2015.
- R. Boateng, A.S. Mbrokoh, L. Boateng, P.K. Senyo, “Determinants of e-learning adoption among students of developing countries”, The Int. J. Inf. and Learn Technol, 33(4), 248-262, 2016
- D.D. Prior, J. Mazanov, D. Meacheam, G. Heaslip, J. Hanson, “Attitude, Digital literacy and self-efficacy: Flow-on effects for online learning behavior”, The Internet Higher Educ., 2016.
- V. Venkatesh, J.Y. Thong, F.K. Chan, P.J.H., S.A. Brow, “Extending the two-stage information systems continuance model: Incorporating UTAUT predictors and the role of context”, Inf. Syst. J, 21, 527–555, 2011.
- Z. Yildrim, C.M. Reigeluth, S. Kwon, Y. Kageto, Z. Shao, “A comparison of learning management system in a school district: Searching for the ideal personalized integrated educational system (PIES)”, Interactive Learn, Environ, 22(6), 721-736, 2014