
Statistical Aspects of the Environment of Albanian Students Who Were Admitted to Higher Public Education Institutions in the Year 2014
Volume 5, Issue 2, Page No 592-596, 2020
Author’s Name: Feruze Shakaj1,a), Markela Muça2, Klodiana Bani2
View Affiliations
1Ministry of Education and Sports (MES), Street “Durrësit” Nr.23, 1001 Tiranë, Albania
2University of Tirana, Faculty of Natural Sciences, Department of Applied Mathematics, “ Zogu I “ Boulevard, Nr. 25/1, 1060, Tiranë, Albania
a)Author to whom correspondence should be addressed. E-mail: shakajferuze@gmail.com
Adv. Sci. Technol. Eng. Syst. J. 5(2), 592-596 (2020); ![]() DOI: 10.25046/aj050274
DOI: 10.25046/aj050274
Keywords: Study Programs, Administrative Units, national graduation, group’s hierarchy analysis, ward’s methods, distance

Export Citations
The research presents a statistical analysis that characterize the environment of the admitted students to Higher Public Education Institutions, by providing an overview of student’s distribution to the courses of studies offered by universities in Albania, such as, economy, medicine, technical etc., and grouping them according to the relative density of 38 (thirty eight) administrative units /districts. The aim of the research focuses on the trends that these units present in the main areas of study mentioned above. We want to if there is a connection between come and the courses of studies. So, in other words to see the trends according to district. The clustering was performed using the Ward’s method of Cluster Analysis (CA Hierarchy Methodology). This research seeks to develop a very careful description in order to detect typical features and furthermore to understand the situation. The assessment combines a total analysis to a relative comparative analysis of study programs offered by universities. Also, it analysis different indicators.
The analysis is based on a choice obtained from the NG 2014 (National
Graduation) of Ministry of Education and Sports (MES). The soft used is SPSS
Statistic 25.
Received: 20 February 2020, Accepted: 10 March 2020, Published Online: 10 April 2020
1. Introduction
Cluster Analysis (hereinafter referred to as the CA) is an analytical technique that is used to classify or group data in a finite number and small groups based on two or more variables. There are several algorithms for CA and each of them is aimed to measure the distance between the observed individuals and observation groups. The objects, part of the established groups, can be instances or variables. The data pool can be numerical or categorical. The categorical data can be obtained from quantitative or qualitative data. [1]
CA is supported by a number of software packages like SAS, SPSS, BMDP, which are often available in academic and other computing environments. (A brief descriptions and sources for these and other packages are provided by Romesburg [2]
Another issue in CA is the interpretation of groups. In fact, interpretation of groups that result from arithmetic procedure is not very clear. An important role in the identification of groups, plays the distance between objects. Usually, a graphical representation helps in distinguishing before applying any method. We must be careful in case when there are no real groups for the data sets, but method contains a partition. This is because we don’t know the number of clusters that will emerge in our sample. [3]
CA is divided into Hierarchical and non – Hierarchical. Our study focuses on the implementation of hierarchic methodology in which clusters are given in hierarchically though a dendrogram at different levels of division [4]
Algorithms for Cluster Hierarchical Analysis are two types:
- Agglomerative (collective)
- Divisive (distribute)
These algorithms are completely the opposites of each other.
CA’s Agglomerative Algorithm functions by grouping data one by one based on the nearest distance from all data distances [5] [6]. All agglomerative hierarchical grouping procedures start with a matrix of differences between objects. At the beginning of the agglomeration process, each object is considered as a separate cluster. For an N pool of initial objects, the first group will result in N- 1 clusters, the second in N -2, and so on until a single cluster will collect and contain all the objects [6], [7].
There are several methods to achieve this result where some of the most important ones are mentioned below:
- Single Distance – nearest or single linkage,
- Complete Distance – farthest or complete linkage,
- Average – average distance or average linkage,
- Centroid distance,
- Ward’s method – minimized square amount of Euclidian distances (SSEs.)
2. Literature review
The main motive behind writing this article is that educational development is essential to the improvement of socio-economic development of a country. The article discusses the choices of the students admitted to HEI. On the other hand, this aspect is not discussed as detached from the secondary education, but as attached to it, because the secondary education is the initial point which forms the students’ inclinations towards higher education.
It is a well-known fact that HEI have an essential impact on the social development. So, the main role of HEI is to teach students to be able to develop research skills and to offer services to the community. By doing this role the HEI help students to secure a job in the future. Our main objective is that the HEI should cooperate with education institutions of secondary education, in order to foster and orient students towards their true inclinations.
In the field of economic development, the Higher Education contributes towards the increase of productivity and competition, mainly through the growth of human capital. Another role of HEI is that they through their cooperation with government and non-government institutions related to employment, can know better the labour market needs, in order to orient their curricula towards these needs. Our article aims to analyse the environment of the students admitted to universities, in order to offer some suggestions to improve the quality of Higher Education. These suggestions are related to Higher Education capabilities to attract students and the possibilities of offering employment for a great number of graduates, contributing in creating a Knowledge-based Society.
In this study are analysed all the Albanian students, who won a place in Public HEI, in the year 2014, based on districts. The main aim of this article is to examine if group analysis of the students based on districts could produce any results that can be used for the objectives mentioned above. The study is performed through hierarchical cluster analysis group, categorizing the districts based on nine main education fields, and the respective winners for each field. The main objective of this study is to produce quantitative data of the winners in Higher Public Education, academic year 2014-2015, based on districts. The article aims to look into details of the winners based on districts, in the fields determined by us before, in order to compare different districts according to the fields, or to highlight the similarities between the districts.
A very important role that the HEI play is that, they contribute to the development of competition between countries, by creating scientific centres, or their branches, where is needed. This study helps the HEI, to direct their offer, in a clear and well-oriented way towards the students that come from the districts, where the inclinations of high school seniors are exactly those that serve the universities to increase the quality of the education. Universities can use this study to develop car [5]eer strategies that helps not only them, but also the education institutions of the pre-university education. Thereby, the universities and industries become strong partners to the new concepts development that go toward a higher competition.
The curriculum in Albanian universities is an example of this, which lately has started to rely in the improvement of competition in Higher Education, creating knowledge centres in different scientific fields, which will cooperate closely with a great number of different industries. Taking into great consideration the problems of competition in Higher Education, in the context of the increase of students’ number, some authors [7] [8]. emphasize the crucial role of skills and knowledge management in the socio-economic development of a country. This explains an increase in demand of higher-order thinking and the need of graduated students, who develop competencies that offer advantages in the labour market and different industries.
On the other hand, Bucharest Message to the 2009 World Conference on Higher Education – Experiences and Recommendations from the Europe [8] attracts our attention to the fact that:
“Population decline and changes in age distribution are affecting higher education systems in most countries in the UNESCO Europe Region, with a consequence that higher education institutions see the need to compete for students both nationally and internationally, with the risk that international migration be required in order to overcome shortages of skilled labour”.
“In this context, new competencies for new demands of the labour market must be anticipated and increased opportunities for higher education and lifelong learning need to be created for he modern tendencies to the development of higher education emphasize the fact of the increase of the number of students admitted to universities, in other words the massification of higher education. Instead of addressing directly the issue of massification, [9]. well-known authors in this field, what happens is that this is included in the discussions of higher education as an external factor that impact the teaching, observations and related services.
Another challenge of our education system, in particular higher education is to offer optimal conditions in all aspects, in a way that elite students, (approximately 3000-4000 a year), who for many years have chosen to study abroad, can have all the appropriate conditions to study in Albania. The phenomena of elite migration is linked directly to the socio-economic development of a country, because by the movement of highly skilled elites, our country not just losing our renowned intellectuals, but also losing our specialized labour force, or that is called the brain drain of a country.
A considerable number of authors, especially in the last decade considered the higher education from the perspective of economic policies and employment [10], [11], [12], [13] giving attention to the aspect of linkage between growth of human capital and economic development. The discussed studies so far are trying to give a thorough point of view of higher education, not only based on economic perspectives, but also emphasizing benefit analysis of individuals, who have completed higher education. Thus, analysis show that graduates have better chances of employment and are less exposed towards the risk of longer unemployment. Besides that, the importance of these findings, is very debatable for transition countries, which are faced with a very high rate of unemployment. Despite the fact, that the observations of this article discussed above, are very general in their nature, this study analysis the trends of Albanian higher education, in a way that it is exactly the higher education in our country that should be competitive, and why not aiming to be competitive to European countries as well.
3. Methodology
In this study we will use Ward’s Method of Hierarchal Cluster Analysis (CA) which is an important method in grouping data [14]Ward’s is also known as the minimum variance method because it merges at each stage the cluster pair whose union minimizes the increase in the error of all square numbers within the group based on the Euclidean distance. Between the centroid it tends to produce homogeneous clusters and a homogeneous hierarchy and its definition as a gravity cluster provides a useful way to represent a cluster [15].
This method is similar to the Linkage method that starts with N Clusters, which contain an object but uses the sum of SSE squares to determine the two next batches at each step of the algorithm. Square Sample Error (SSE) is defined as:
![]() Where is I object in the group (Cluster) i and – is the object number in group (Cluster) i. [16] Ward’s method shows that the distance between Cluster A and B is equal to the square sum when we join them
Where is I object in the group (Cluster) i and – is the object number in group (Cluster) i. [16] Ward’s method shows that the distance between Cluster A and B is equal to the square sum when we join them
 Where is the center of cluster j and is the number of points in it. Δ is the marginal cost of cluster’s A and B combination. Through the hierarchical method, the sum of squares begins with zero because each point is in the cluster itself and it grows as we merge clusters (Distances between Clustering, Hierarchal Clustering 2009),
4. Information on the database
In this study we have considered the group of all winners in the Higher Public Education Institutions of the academic year 2014-2015. This group is pulled out from the National Graduation database of National Agency of Exams in the Ministry of Education and Sports. The used database is composed from n=18390 rows where each of them belongs to a winner. The initial table contains this data and it is organized in fields such as: Name, Father’s Name, Surname, and study program, acceptance code of study, university, faculty, state, and district. We emphasized that the focus here are all the Albanian Higher Education Institutions. In addition, all study programs belonging to the same field of study have been named equally in all universities that offer this field of study. Example, study programs such as General Nursing, Imaging, General Medicine, Dentistry, Pharmacy etc., belongs to the group named “medical”. Using Microsoft Office Access Database from the initial table, after making the necessary modifications, we have built an absolute density contingency table that shows for each city and for each district the number of winners in each of the fields of study we want to review. Likewise, we took care not to have missing values in the data by replacing all the latter with “zero” value. In this way we avoid problems during the grouping process. By using SPSS functions, the absolute densities are all turned to relative densities and they are used to group via Ward’s method of Cluster Hierarchical Analysis. We have used relative densities as we noticed that the classification through district groups was clearer and the results were more readable.
Table 1: Number of groups and members for each
| Cluster | Number of districts | Members |
| 1 | 5 | Berat, Kamëz, Korçë, Lushnje, Pogradec |
| 2 | 27 | Bulqizë, Delvinë, Devoll, Dibër, Gjirokastër, Gramsh, Has, Kavajë, Kolonjë, Krujë, Kuçovë, Kukës, Kurbin, Lezhë, Librazhd, Malësi e Madhe, Mallakastër, Mat, Mirditë, Peqin, Përmet, Pukë, Sarandë, Skrapar, Tepelenë, Tiranë Qark, Tropojë |
| 3 | 5 | Durrës, Elbasan, Fier, Shkodër, Vlorë |
| 4 | 1 | Tiranë |
5. Experiment results
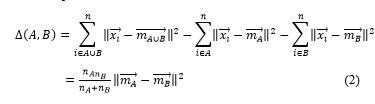
As we have mentioned above, we have used Ward’s method of Cluster Analysis (CA Hierarchy Methodology). By using this method, data is categorized in four groups, having an intersection as in Figure 1. The Table presents a summary of the number of groups and districts that are categorized in each one of them. We highlight the fact that the grouping is based on the districts (this analysis is done based on administrative divisions before the territorial reform, where Albania was divided into 38 districts). In order to build graphics for each group, we have used absolute density, which we will present interpreting each one of them
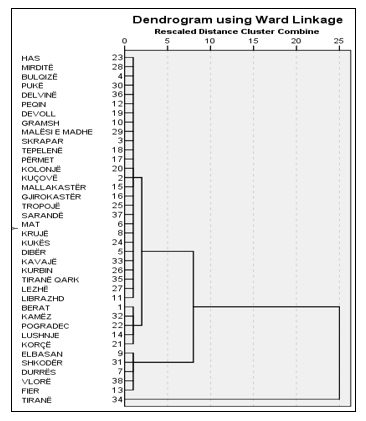 Figure 1: Dendrogram tree data
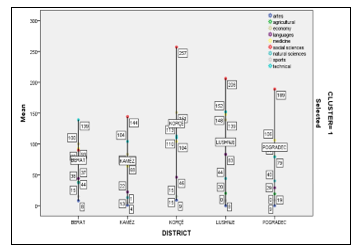 Figure 2: Group 1
Figure 2 notes that in the first group there are districts of: Berat, Kamëz, Korçë, Lushnje and Pogradec. The most interesting fact in this group is that starting from the numbers in small square boxes, (which show the number of winners in each field of study), and referring to the graphic’s legend, we note that the districts of this group have the largest number of winners in the field of Social Sciences.
 Figure 3: Group 2
Figure 3, notes that in the second group there are all districts, which have approximate number of students and there are mainly not of very large districts of the country. It is worth emphasizing the fact that, if we referr to the legend, the number of winners in the study field of Technical Sciences is almost equal in all districts. Also, we can note that in this group, all districts have the largest number of winners in the field of Social Science. It is very interesting to emphasize the fact noted by the graphic that even form the smaller districts, there are high school seniors students, who are winners in the Fine Arts Study Programs, highlting the fact that these courses of study have a very limited number of student quotas, varying form 1 to 50 admissions for a study program
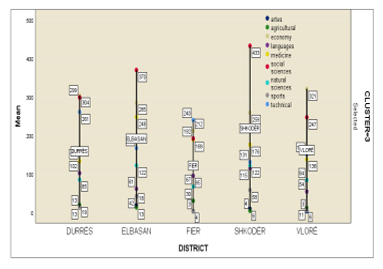 Figure 4: Group 3
Figure 4, notes that in the third group, districts of: Durrës, Elbasan, Fier, Shkodër, Vlorë, are grouped together. Also, the graphic shows that, these districts have approximately the same number of students, who are winners in Public HEI. In in this group, it is worth noting the fact that these districts have the same number of winners in the field of Foreign Languages. Meanwhile, in this group, it is clear that we have a considerable number of winners in the field of Social Sciences.
Figure 5, notes that in the third group, the district of Tirana is on its own, which makes sense because this district has the largest number of students who apply to universities. It is very important to emphasize the fact that in the district of Tirana, we see a visible trend of students, who apply to Economic, Technical and Sport Sciences, taking into consideration the fact that in the country level, there are not many students, who apply to these courses of study.
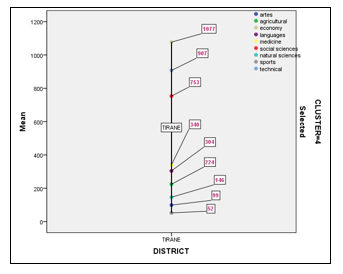 Figure 5: Group 4
6. Conclusions
The statistical analyses of the distributions shows that,admitted students in the field of Social Sciences, mainly come from the districts of Berat, Kamëz, Korçë, Lushnje and Pogradec.Almost, all of smaller districts of the country have approximately the same number of students admitted in the field of Technical Engineering.The largest number of students, admitted in the field of Natural Sciences, come from the districts of: Elbasani, Durrësi, Fieri, Shkodra and Vlora. The students are distributed evenly among all districts.Tirana District students are mainly inclined towards Economic, and Sport Sciences, whereas they are less inclined towards Natural Sciences.
- Muça M., Baani K., Shakaj F, “Combining the hierarchal and-nonhierarcal methods for acluster analysis: a case study for classification of students accordin to their results.,” in SPNA, Tirana, 2014.
- R. H.C, Romesburg, 1984.
- Muça M., Bani K., Shakaj F., “Combining the hierarchal and non-hierarchal methods for a cluster analysis: a case study for claassification of students according to their results.,” in SPNA, Tirana, 2014.
- Aggarwal C. C., Reddy, C. K, “Data clustering Algorithms Application,” 2015.
- Fung, B. C. M., Wang, K., & Ester, M., ” Hierarchical Document Clustering.,” 2006.
- Singh, W., Hjorleifsson, E., & Stefansson, G., ” Robustness of three hierarchical agglomerative clustering techniques for ecologicaI data.,” 2010.
- E. Egron-Polak, “100 voices. A decade of inspiration and achievements in higher education (p. 43). Bucharest: UNESCO-CEPES,” 2009.
- UNESCO, ” Bucharest message to the 2009 world conference on higher education – Experiences and recommendations from the Europe region. UNESCO Forum on Higher Education in the Europe Region.,” Bucharest, Romania., 2009.
- Mora, J. G., & Vila, L. E, ” The economics of higher education. In R. Begg (Ed.), the dialogue between higher education research and practice (pp. 121–13). Dordrecht: Kluwer Academic Publishers.,” 2003.
- Del Rey, E., & Racionero, M., ” Financing schemes for higher education. European Journal of Political Economy, 26, 104–113.,” 2010.
- A. (. Schwarzenberger, “Public/private funding of higher education: A social balance. Hannover: HIS: Forum Hochschule.,” 2008.
- Strehl, F., Reisinger, S., & Kalatschan, M., “Funding systems and their effects on higher education systems, Paris: OECD Publishing. OECD Education Working Papers 6.,” 2007.
- J. Ward, “Hierarchical Grouping to Optimize an Objective Function,” Journal of the American Statistical Association.,” 1963.
- Murtagh,F. Legendre, P., “Ward’s Hierarchical Agglomerative Clustering Method: Which Algorithms Implement Ward’s Criterion?. J Classif 31, 274–295.,” 2014.
- M. Lorr, “Cluster analysis for social scientists.,” 1983.
- Ferreira, L., Hitchcock, D.B., “A COMPARISON OF HIERARCHICAL METHODS FOR CLUSTERING FUNCTIONAL DATA.”.