The Capacity Factor of Renewable Energy Power Plants During Electric Power Peak Times in Jeju Island

Adv. Sci. Technol. Eng. Syst. J. 5(2), 545–550 (2020);
 DOI: 10.25046/aj050268
Jeju Island is the largest island of South Korea and has an independent electric supply system. The island has a special energy plan that realizes itself a carbon-free region by 2030. Wind and solar energy resources are considered as an important means. The introduction of weather-variable renewable energy generation sources into the electric power system makes it unstable. The main content of this study was to investigate the capacity factor of large scale renewable energy (solar, wind) power plants operated in Jeju Island during the electric power peak time. We can see their utilization rate or contribution rate during the power peak time by the value of their capacity factors. The largest 18 solar power plants (SPP) and 8 wind power plants (WPP) on the island were chosen and the 4, 12, 25, 50 and 100% electric power peak times were set for this study. There are two electric power peak seasons, summer and winter, in Jeju Island when the electric power demand arrives at peak. Generation of renewable energy plants depends on weather and the climates of the 5 regions of Jeju Island are a little different from one another. So, we investigated the difference between the average capacity factors of the 5 region’s renewable plants. WPPs showed a high contribution to the power grid only during winter peak time and SPPs did high contribution to the power grid only during summer peak time, while WPPs showed low contribution to the power grid during summer peak time and SPPs did low contribution to power grid during winter peak time. WPPs and SPPs have inter-compensation relation in the aspect to contribute to the power grid.
1. Introduction
Population increase and industrialization have resulted in rapid increases in energy consumption and greenhouse gas (GHG) emissions. Therefore, many countries have been focusing on the wider application of renewable energy. South Korea also announced the “Renewable Energy 3020 Plan” in 2017 [1]. The global utilization of renewable energy increases annually and renewable plants are one of the largest factors in the world energy system. The capacity of the renewable power plants installed in 2018 was 181 GW and the annual electric energy generated by renewable sources grew by an average of 3.8 percent from 1990 until 2018, which is higher than the average increase rate of 2.9 percent of total electricity generation [2]. In addition, renewable power capacity totaled 2,378 GW (including hydropower) and 1,246 GW (not including hydropower). By the end of 2018, 230 countries proposed 100% renewables in at least one sector, and 169 countries adopted renewable energy targets. [3]. The international energy agency reported that wind power systems are the second fastest growing source of renewable electric energy after solar power systems. Furthermore, between 1990 and 2018, growth of electric energy generated by wind power plants from 3.8 TWh to 745.2 TWh showed an average annual increase rate of 20.7% [4]. Between 2005 and 2017, the world photovoltaic electricity production increased from 4TWh to 444TWh [5]. In 85 countries, states and provinces with renewable portfolio standards have the targets to produce more than 50% of their electric energy using renewable energy plants [6]. These documents showed that solar and wind resources are the lead renewable energies worldwide and this power plant technology has developed rapidly over the last few years.
Jeju’s regional government announced the “Carbon Free Island by 2030 Plan (CFI2030 Plan)” in 2012 [7], which is to realize itself a carbon-free region by 2030. The capacity of renewable (solar and wind) electric power plants were expected to reach 4.15GW by 2030, which consists of on-shore wind power plants 0.45 GW, off-shore wind power plants 1.9 GW and photovoltaic power plants 1.8 GW.
Also, about 377,000 electric vehicles will run on the island by 2030 [8]. In the case of the Jeju Island, WPPs and SPPs were estimated about 260.6MW and 160.8MW in 2018 [9]. In the aspect of supply and consumption of electric energy, demand and supply must be always equal to each other. Namely, the electric power of the supply side must be always equal to one of the demand side. Also, the supply side always has more than electric power capacity than the demand side needs and then has sufficient electric generation plants to supply timely the demand side with electric energy. The problem is that renewable electric power plants such as WPPs and SPPs can’t always control the amount of generation according to the request of the demand side because their generation depends on the weather. Unlike the existing other power generation resources, renewable power generation sources cannot be rated. If extra generation facilities that cover the stop of the renewable electric power plants were reserved, the problem will be solved, but it needs big cost. Therefore, the estimation of the average contribution of renewable electric power plants during the electric power peak time when most generation facilities will be operated is very important.
There are a few case studies on how to approximate the supply capacity of renewable power resources [10, 11]. Some studies used the capacity factor as a measure of how much energy is generated by power plants compared to their maximum output. Ref [12] explained and compared the peak-period capacity factor method and effective load-carrying capability method, and Ref [13] analyzed the capacity value of locations in the south-western United States. Similarly, ref [14] estimated the capacity factor of SPPs in Korea.
The electric energy supply side must have sufficient electric power during even electric power peak times in summer and winter seasons. It is very important in designing a stable energy mix for a region to know the past statistical contribution of renewable power plants (SPPs and WPPs) during the peak times in the peak seasons because the renewable power plants cannot be always operated when the demand increases. This study is going to examine the contribution of SPPs and WPPs to the power grid by evaluating their capacity factors during the electric power peak times in Jeju Island.
2. Methodology
2.1. Regional grouping of renewable power plants
Jeju Island is the largest island in South Korea and locates in North-East Asia. The island has four distinct seasons. Winter is cool and dry while summer is hot, sometimes rainy and humid [15]. In the case of renewable energy plants, unlike conventional thermoelectric power plants, their power capacity possible to supply is determined by climate or weather. To suggest the regional generation characteristics of renewable power plants, grouping them needs according to the climates of the regions at which they are installed. In this study, 8 wind power plants and 18 solar power plants were selected and grouped into the three and the four regions respectively. Furthermore, we chose the WPPs and SPPs with the power capacity of more than 0.5MW and 15MW respectively for this study.
The Korea Meteorological Administration divided Jeju Island into the 5 regions according to weather; western, eastern, southern, northern and mountain regions.
Figure 1 shows the regional grouping of solar power plants (SPPs). The mountain region is not selected because it has a few SPPs. In this paper, we selected the SPPs that have generation data for more than two years.
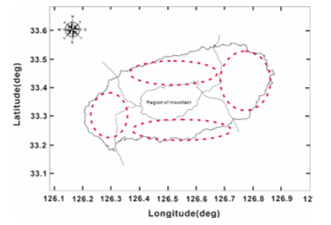 Figure 1: Regional grouping of solar power plants
Figure 2 shows the regional grouping of wind power plants. Wind farms were usually constructed in the west and east parts because both regions have a strong windy climate. Let call the 3 regions western, eastern and southern regions respectively.
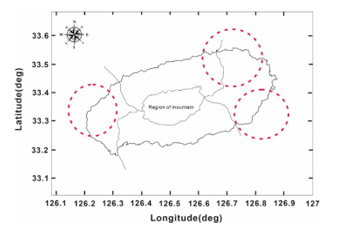 Figure 2: Regional grouping of wind power plants
2.2. Data sources
The data on the hourly average electric power demand of Jeju Island for three years (2015-2017) was used to define its electric power peak time and was obtained from the Korean Power Exchange Company (KPX). The data on the hourly electric energy generated by wind and solar powers over three years (2015-2017) are also obtained from KPX.
2.3. Choosing the electric power peak seasons
Figure 3 shows the average electric power demand of Jeju Island for three years (2015-2017). The electric power peak occurred in July and August in the summer season and December and January in the winter season.
Winter electric power peak season was chosen from December to January and the summer electric power peak season was done from June to August in this study.
2.4. Defining the electric power peak times
The electric power peak time can be selected from the data on the electric demand during the electric power peak day within the specific period, or can be done from the data on the average electric demand during the specific electric power peak season. We choose the latter because, usually, the renewable power plants always operate in the case that weather matches. In this study, the data on the average electric demand during the winter and the summer electric power peak seasons was used in determining the electric power peak time.
This study suggested an electric power peak time system with the five types of electric power peak times: the 4, 12, 25, 50 and 100% electric power peak times. They mean to have the 1, 3, 6, 12 and 24 hours intervals, respectively, in the order of the volume of electric power demand. Let’s call them as the % electric power peak times. The electric power demand curve in Figure 4 shows the July-August average power demand for the 3 years (2015-2017) in the respective time interval. In Figure 5 does the December-January’s one. We selected the % electric power peak times during the summer and the winter electric power peak seasons from Figure 4 and 5.
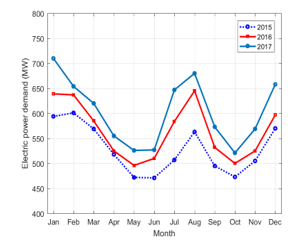 Figure 3: Monthly average electric power demand on the island (2015-2017)
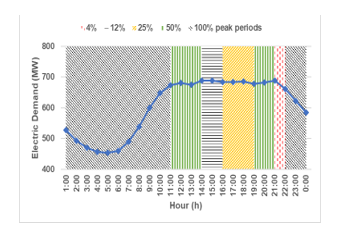 Figure 4: Classification of the % power peak periods in summer (Jul-Aug)
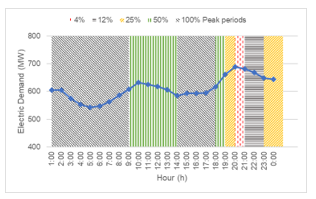 Figure 5: Classification of the % peak periods in winter (Dec-Jan)
2.5. Calculation of the capacity factor
The utilization rate of an electric power plant can be estimated as the parameter, capacity factor. The capacity factor of an electric power plant, CF is obtained following equation:
![]() where is the period that the plant has been operated, is its electric power capacity and is the electric energy generated during the time interval by it. The capacity factor of electric power plants, is obtained by the equation:
where is the period that the plant has been operated, is its electric power capacity and is the electric energy generated during the time interval by it. The capacity factor of electric power plants, is obtained by the equation:
![]() where is the period that the plant has been operated, is the electric power capacity of the plant and is the electric energy generated during the time interval by the plant. The capacity factor of multiple plants is calculated as the weighted average value and is not as simple an arithmetic average.
where is the period that the plant has been operated, is the electric power capacity of the plant and is the electric energy generated during the time interval by the plant. The capacity factor of multiple plants is calculated as the weighted average value and is not as simple an arithmetic average.
3. Results & Discussion
3.1. Capacity factors of wind power plants and solar power plants during 2015-2017 in Jeju Island.
Yearly-average capacity factors of WPPs and SPPs in the respective hour interval are shown in Figure 6 and Figure 7, respectively. The capacity factor of an electric power plant means the utilization rate of the plant. The operation of wind or solar power plants depends on weather.
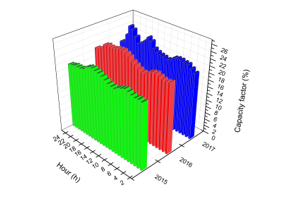 Figure 6: Average CF of WPP on the island (2015-2017)
Figure 6 shows some regular trend of generation time of WPPs, namely generation amount increasing in the morning and in the evening. This trend attributes to an island climate that regular wind flows from sea to land in the morning and from land to sea in the evening. Figure 6 shows the capacity factor range from 19% to 25%.
Figure 7 shows a daily trend of SPPs, the capacity factors of SPPs ranging from 0% to 50%. Generation occurs only daytime and reaches the peak at noon because 100% of SPPs in Jeju Island is the fixed type which does not track moving sun.
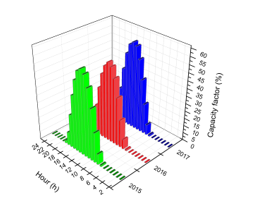 Figure 7: Average CF of SPP in the island (2015-2017).
Table 1 shows the yearly average capacity factors of regional WPPs and SPPs. The western region is shown to have better competitiveness for solar power plant business.
Table 1: Average CF of renewables on an island (2015-2017).
| Region | North | East | South | West |
| Wind power plant | – | 23.2% | 22.2% | 21.0% |
| Solar power plant | 12.6% | 12.8% | 13.5% | 17.1% |
3.2. Capacity factor of the wind power plants during the electric power peak times
Figure 8 and Figure 9 show the capacity factors of the 3 regional wind power plants during summer and winter electric power peak times, respectively. The capacity factors are ranged from 9% to 15% during all summer % peak times in all regions in Figure 8, while those are ranged from 32% to 38% during all winter % peak times in all regions in Figure 9. The average annual capacity factor of WPPs over 3 years (2015-2017) in Jeju was calculated as 22.1%. Therefore, we can say WPPs in Jeju make a larger contribution to the electric power supply system in winter than in summer.
Generation of WPPs in summer is much below the annual average. Let’s compare the difference of the 3 regional capacity factors of WPPs. In the summer peak time within 50% peak time, WPPs in the southern region makes a larger contribution to the electric power supply system than WPPs in the eastern and the western regions by about 1-3% in capacity factor. In the winter peak time within 50% peak time, WPPs in the western region make a larger contribution to the electric power supply system than WPPs in the eastern and the southern ones by about 1-3% in capacity factor. But, we can think that, in the winter peak time, there is no difference in the capacity factors of the 3 regions’ WPPs because they have more than 30% capacity factor.
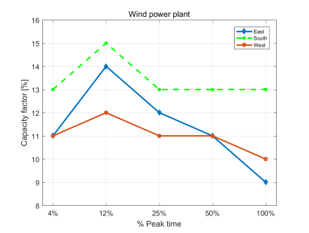 Figure 8: Capacity factor of the wind power plants during the summer electric power peak season (July-Aug)
Next, let’s discuss whether WPPs generate more electric energy at peak time than at the nonpeak time. Figure 8 and Figure 9 show that the values of capacity factors at 4, 12 and 25% peak times are larger than those at 100% peak time. Generation by wind and solar cannot increase when we want or demand for electric energy increases. Also, it is necessary and important that WPPs and SPPs generate statistically more electric energy during peak time than during nonpeak time though their generation depends on the weather. WPPs in any region of Jeju Island, luckily, generated statistically more electric energy during electric power peak time than during electric power nonpeak time.
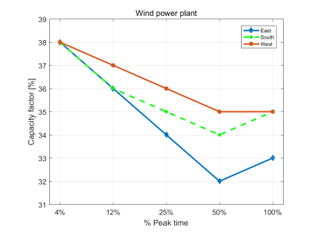 Figure 9: Capacity factor of wind power plants during winter electric power peak season (Dec-Jan)
3.3. Capacity factor of the solar power plants during the electric power peak times
Figure 10 and Figure 11 show the capacity factors of the 4 regional solar power plants during summer and winter electric power peak times, respectively. The capacity factors are ranged from 0% to 32% during all summer % peak times in all regions in Figure 10, while those are ranged from 0% to 12% during all winter % peak times in all regions in Figure 11.
The average annual capacity factor of SPPs over 3 years (2015-2017) in Jeju was calculated as 14.0%. Therefore, we can see that SPPs in Jeju Island contribute greatly to the electric power supply system during summer peak time except during 4% peak time with 1 hour duration, while they do not contribute to it and have the capacity factor below the annual average in winter peak time. Figure 11 shows the contribution of SPPs in all regions to an electric power supply system is zero within 25% peak time duration during the winter peak time.
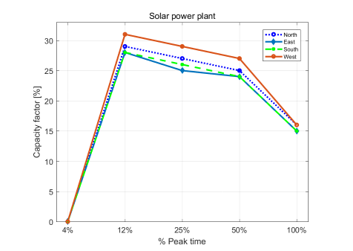 Figure 10: Capacity factor of the solar power plants during the summer electric power peak season (July-Aug)
In the case of SPPs, the regional difference of contribution to the electric power supply system is not shown during the summer and winter electric power peak times, but it is distinguished that the capacity factor of SPPs in the northern region is half of it in other regions during the winter peak time.
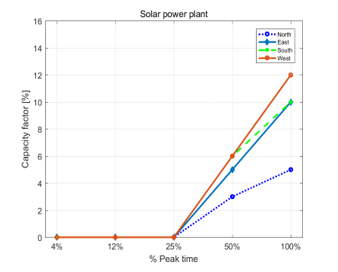 Figure 11: Capacity factor of solar power plants during winter electric power peak season (Dec-Jan)
3.4. Total discussion
In Jeju Island, there are two seasonal electric power peak times. They are the summer and winter peak times. Summer peak time attributes to cooling load and winter peak time to the heating load. We can see, from the electric demand patterns of Figure 4 and Figure 5, that, in the case of the summer peak time, considering the peak duration until 50% peak time needs and, in the case of the winter peak time, considering the peak duration until 25% peak time does.
WPPs showed a high contribution to the power grid only during the winter peak time and SPPs did high contribution to the power grid only during the summer peak time, while WPPs showed low contribution to the power grid during the summer peak time and SPPs did low contribution to power grid during the winter peak time. WPPs and SPPs have inter-compensation relation in the aspect to contribute to the power grid. We think this inter-compensation relation may usually take place in other regions of the world. It is lucky in aspect to penetrate WPPs and SPPs on large scale. Nevertheless, it will be a big problem, in the future that SPPs will have been penetrated on large scale, SPPs can’t make any contribution to the power grid during the 4% peak time in summer in Jeju Island because the peak time is at evening.
It is one of the most important research themes in the renewable field to evaluate how much the specific renewable plants contribute to the power grid during the electric power peak time. This paper is to have examined the contribution of WPPs and SPPs to the power grid during the winter and summer power peak times in Jeju Island to be a carbon-free region by 2030. We were able to understand easily the contribution of renewable plants through introducing the concept of the % peak time in this paper.
4. Conclusion
The supply side must have sufficient electric power during even power peak times in summer and winter seasons. It is very important in designing a stable energy mix for a region to know the past statistical contribution of renewable power plants (SPPs and WPPs) during the peak times because the renewable power plants cannot be always operated when the demand increases. This study examined the contribution of SPPs and WPPs to the power grid by evaluating their capacity factors during the electric power peak times in Jeju Island.
The large scale solar and wind power plants in Jeju Island were grouped into four and three regions, respectively, depending on climates of their location. The % peak time was defined and is divided into the 4%, 12%, 25%, 50% to 100% peak times.
WPPs showed a high contribution to the power grid only during winter peak time and SPPs did high contribution to the power grid only during summer peak time, while WPPs showed low contribution to the power grid during summer peak time and SPPs did low contribution to power grid during winter peak time. WPPs and SPPs have inter-compensation relation in the aspect to contribute to the power grid. We were able to understand easily the contribution of renewable plants through introducing the concept of the % peak time in this paper.
- IEA, Key World Energy Statistics 2018.
- IRENA (2019), Renewable Energy Statistics 2019, The International Renewable Energy Agency, Abu Dhabi.
- Report citation Renewables 2019 Global Status Report REN21, 2019
- Renewables information: overview (2019 edition), International Energy Agency.
- Gusmao M.Grossbock, Sandi Aramco “Capacity value of photovoltaic and wind power plants in an isolated Mini-grid in the Kingdom of Saudi Arabia” conference paper.
- Korea wind and energy industry association (2018) http://www.kweia.or.kr/ (accessed 30 August 2018).
- Sang-Hyun Kang, “Analyzing the Capacity of an ESS for Mitigating the Fluctuations in the Dongbok-Bukchon Wind Farm” Jeju National University, the Degree of the master, 2017
- Seyed Hossein Madani, Ramteen Sioshansi, Paul Denholm” Comparison of Capacity Value Methods for Photovoltaics in the Western United States” Technical Report NREL/TP-6A20-54704, July 2012.
- Shuai Lu, Nader Samaan, Ruisheng Diao, Pevel Etingov “Capacity Value of PV and Wind Generation in the NV Energy System” Pacific Northwest national laboratory, September 2012.
- Navid Haghdahi, Anna Bruce, Iain MacGill, and Robert Passey “Impact of distributed Photovoltaic Systems on Zone Substation Peak Demand” IEEE Transactions on sustainable energy, Vol9, No 2, April.2018.
- Seyed Hossein Madaeni, Student Member, IEEE Ramteen Sioshansi, Member, IEEE, and Paul Denholm, Member, IEEE “Estimating the Capacity Value of Concentrating Solar Power Plants: A Case Study of the Southwestern United States” conference paper.
- Suchitra Subramaniyan, Mobi Mathew, Dr. Jami Hossain “Renewable Energy Capacity Value Estimation using Peak Period Method in Rajasthan” 2018 3rd International Conference for Convergence in Technology, India, Apr 06-08,2018.
- Mehdi Shahriari, Seth Blumsack “The capacity value of optimal wind and solar portfolios” Energy 148 (2018) 992-1005.
- Cai Jilin, Xu Qingshan, Wang Xudong, Jiang Ling “Estimation for the Capacity Value of PV and Wind Plants Considering Output Correlation” Published by Elsevier Ltd, 1876-6102, 2017.
- Chunhyun Paik, Yong Joo Chung, Young-Jin Kim “CF-based Approximation Approach for Calculating Capacity Credit of Solar Power in Korea” Journal of the Korean Solar Energy Society Vol37, No5, pp.13-26, October 2017