Pyrolysis of Beech Wood in A Continuous Drop Tube Reactor in Comparison to A Batch Reactor
 , Nourelhouda Boukaous 2, Antoinette Maarawi 1, Lokmane Abdelouahed 1, Abdeslam-Hassen Meniai 2, Mustapha Chikhi 2, Bechara Taouk 1
Adv. Sci. Technol. Eng. Syst. J. 5(2), 441–451 (2020);
 DOI: 10.25046/aj050257
The goal of this research work is first to investigate the comparison between a batch and a continuous pyrolysis reactor (at 500, 550 and 600 °C) and the eventual differences and similarities that are obtained by analysing the obtained liquid and gas compositions. All the products formed were examined: liquids by GC-MS/FID and Karl Fischer titration, gases by GC-FID/TCD and solids by thermogravimetric analysis (TGA). It was observed that even though not the same pyrolytic reactor was used, the parameters rendering the maximum yield of bio-oil were the same in both cases: 500 °C under 500 mL/min N2 (~58 wt. %). Furthermore, it was observed that while changing the temperature affected significantly the product distribution, varying the gas residence time did not cause much change to the product distribution. This was due to the fact that pyrolysis was occurring within the same intermediate regime (τ: ~9 min), and that the limiting factor of the reaction was thus the biomass particle residence time (20.6 s), not that of the gas. Finally, the observations obtained for product distributions and evolution for both the batch and the continuous setups were compared, and discrepancies between results from the two setups were found. This led to the conclusion that comparisons between reactors of different scales need to be undertaken with caution as the results might not be directly comparable.
1. Introduction
This paper is an extension of work originally presented in the 10th International Renewable Energy Congress (IREC) [1]. Depletion of fossil-based fuels has become an important environmental issue. A more sustainable alternative to the use these fuels would be the use of a “green” bio-fuel and a promising route to achieve this goal would be to convert biomass into a product known as “bio-oil” through the pyrolysis process [2]. Lam et al. [3] conducted an exhaustive review that showed that most biomass pyrolysis studies at laboratory scale are performed on batch, or semi-batch, reactors due to the ease which they provide. However, among the different studies led on continuous biomass pyrolysis in literature, another commonly-used technology is the drop tube reactor (DTR), named also the entrained flow reactor or the free fall reactor [3, 4]. This study undertakes a comparison of these two experimental setups.
A number of studies was led on pyrolysis in batch reactors and a pertinent one was that of Bajus [5]. They studied beech wood pyrolysis at temperatures between 350 and 450 °C in a batch reactor and found that the products formed on average were 25.1 wt. % non-condensable gas, 44.3 wt. % liquid and 30.6 wt. % char. The non-condensable gas products comprised mainly of carbon monoxide and carbon dioxide while the liquids contained mostly acetic acid, formic acid, furfural, lactic acid and levoglucosan. Another study led by Demirbas [6] examined the effect of varying reaction temperature (350-525 °C) on the pyrolytic products of hazelnut shell, olive husk, beech and spruce wood samples. The experiments were performed in a fixed-bed tubular reactor. They observed that a significant oil fraction contained phenols and that the water content oscillated around 15-30 wt. % of the total oil mass. They also found that the bio-oil recovered at 500 °C included elevated concentrations of acetic acid, 1-hydroxy-2-butanone, 1-hydroxy-2-propanone, methanol, 2,6-dimethoxyphenol, 4-methyl-2,6-dimethoxyphenol and 2-cyclopenten-1-one.
Concerning studies led on drop-tube reactors, Guizani et al. [7] conducted experiments using a free-fall reactor by varying operational conditions for biomass pyrolysis: temperature (450-600 °C), biomass particle size (370-640 μm) and gas residence time (12.6-20.6 s). They firstly observed that more elevated temperatures, along with more elevated particle sizes, caused a decrease in bio-oil yield. Among the various operating conditions, it was seen that temperature of the reactor and the particle size impacted greatly the product distribution without influencing notably properties of the bio-oil, namely, acidity. Sun et al. [8] conducted another interesting study on this subject where flash pyrolysis of rice husk and sawdust was performed in a free fall reactor within a temperature range of 700 to 1000 °C. Results from their study have demonstrated that temperature affected the reaction significantly; when temperature increased, gas yield increased as well while liquid and solid yields lessened. The authors also noted that at less elevated temperatures, the improvement in gas production could be owing to a boost in the formation of CO and CH4 whereas, at higher temperatures, it concerned increased CO2 and H2 production.
Based on the values obtained for residence time for this study, it can be inferred that the pyrolysis regime used was an intermediate one. Now, as stated in literature [9–13], results obtained from fast and intermediate regimes are similar to each other. The latter regime was also the one obtained from the pyrolysis experiments in the batch, spoon-fed reactor (τ: ~9 min based on heated length of reactor). As the same pyrolysis regime reigned in both setups, the results are comparable in terms of operating conditions (like biomass used, reaction temperature and gas residence gas).
This research work presents liquid and gas results obtained for pyrolysis reactions conducted in a batch, spoon-fed reactor (SFR) and a continuous DTR, respectively. This research is a follow-up to our previous studies [13–15] and many of the comparisons makes use of the results derived from these studies. The aim is firstly to establish a comparison between the two reactors and then, study the subsequent similarities and differences obtained from the products of the two setups. To further corroborate these observations, the results were also compared to those obtained from a micro pyrolyser [16]. To the best of our knowledge, such a comparison has rarely been undertaken before, despite the importance of knowing and understanding the variation in results obtained when upscaling a process (changing reactor technology and scale of the process). Ultimately, this study can help attest whether comparing results obtained from different reactor technologies is reliable or not, and why.
2. Experimental Section
2.1. Materials used
The biomass used for this study, beech wood having an average particle size of 400 µm, was supplied by ETS Lignex Company. The elemental and proximate analyses for the biomass can be found in the supplementary materials (Tables A.1 and A.2). The C, H and N contents (elemental analysis) of the samples were measured by the use of a CHN elemental analyser (Flash 2000, Thermofisher Scientific). The proximate analysis was obtained via thermogravimetric analysis (TGA), using a STD Q600 equipment, according to the protocol described by Garcia et al. [17].
2.2. Experimental and analytical setup
2.2.1. Experimental setup
Previous studies conducted by our research group detail the reactor layout, experimental protocol and analytical procedures undertaken for experimental runs in the spoon-fed reactor [13–15]. Now, the experimental runs in continuous mode were performed in a drop tube reactor, as is illustrated by Figure 1. Biomass was fed through the top of the DTR by a screw conveyor (GLD 77.0, Tremie 5L from Gericke). A 2 m heated length of the pyrolysis reactor was used. A char collector to gather solid residues of biomass pyrolysis was placed at the bottom of the DTR. This collector was kept at 300 °C through the use a heating shell to ensure that the condensable pyrolysis vapours entering it stayed in vapour form. However, sometimes, some fine solid particles got swept away by the gas/vapour flow and escaped the char collector. Two cyclones (efficiency: 85 % each) were positioned at the vapour exit of the DTR so as to capture these particles away from the gas flow. It should be noted that the whole system was kept at 300 °C in order to prevent condensation of vapours.
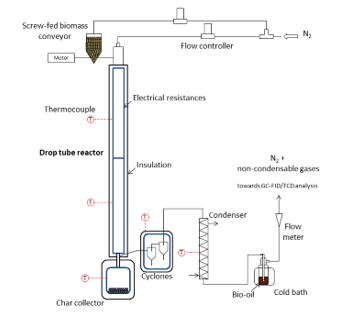 Figure 1: DTR layout
The pyrolysis experiments were performed by altering the temperature of the DTR (500, 550 and 600 °C) and the nitrogen flow rate (0.5, 1 and 2 L/min) in order to vary the gas residence time (τ). The list of experiments has been presented in Table 1. It should be noted that the gas residence time has been calculated based only on the nitrogen flow rate. The experimental protocol followed was: first, the reactor was set to the temperature desired and the nitrogen flow rate was controlled at the exit to make sure that there were no leaks. Then, the system was allowed to stabilise for about two hours. Afterwards, a biomass feed rate of 2 g/min was introduced in the reactor and the reaction was left to occur for 60 minutes. After the experiment, the heat was cut and the experimental system left to cool. The collection of char was done at temperatures below 150 °C so as to prevent it from burning at the contact of air. The collection of bio-oil was done by using a solvent: acetone with 99.98% purity, with, as internal standard, a known added amount of nonane.
Table 1: List of pyrolysis experiments and corresponding gas residence times
| Nitrogen flow rate (L/min)* | Gas residence time, τ (min) | DTR temperature (°C) |
|
0.5
|
9.27 | 500 |
| 550 | ||
| 600 | ||
| 1 | 4.63 | 500 |
| 550 | ||
| 600 | ||
|
2 |
2.32 |
500 |
| 550 | ||
| 600 |
*Measured at room temperature and pressure
2.2.2. Analytical setup for pyrolytic products
Gas Chromatography (GC) Analyses
The liquid and gaseous products formed were then recovered and analysed using the protocol described by our previous work [13]. The bio-oil collected was analysed using a gas chromatograph-mass spectrometer instrument GC-MS (Varian 3900-Saturn 2100T) with a VF-1701ms (Agilent) (60 m × 0.25 mm × 0.25 μm film thickness) column. The same temperature programme as Charon et al. [18] was used. The identification of the liquid components was done using Varian WS (WorskStation) and NIST 2002 software. A GC-FID (flame ionisation detector) Scion 456-GC Bruker instrument was used to quantify the compounds once the identity of the peaks was obtained and confirmed. The same column as for the GC-MS was used. The temperature programme used was the same as for the GC-MS, only, the final temperature used was 240 °C instead of 280 °C. The obtained compounds were finally classified into chemical “families”, each having the same main functional group.
The non-condensable gases (NCG) were mostly composed of CO, CO2, CH4 and H2. C2H2, C2H4 and C2H6 (represented as ‘C2’) and C3H4, C3H6 and C3H8 (represented as ‘C3’) were also present in less significant proportions. The gases were analysed with a gas chromatograph instrument (Clarus 580, Perkin Elmer), equipped with an FID and a thermal conductivity detector (TCD). A Shincarbon St 100 120 column, a methaniser and a hydrogen generator completed the build of the equipment.
2.3. Karl Fischer (KF) titration
A Metrohm 870 KF TitrinoPlus apparatus was used to perform volumetric KF titrations. An aqualine sodium tartrate solution along with Hydranal Composite 5 were used as titrating agents and Hydranal Methanol Rapid was used as working medium. The pyrolysis oil samples were weighed on an analytical precision balance. After weighing, the sample was placed into the titration vessel of the KF apparatus. The titration started when the sample was completely dissolved. Each sample was measured in triplicate, which allowed the calculation of a 99 % confidence interval.
2.4. Thermogravimetric analysis (TGA)
Weight loss as a function of temperature was recorded using a thermobalance (TA Instrument Explorer Q600) from 20 °C to 800 °C. In a typical experiment, 5-10 mg of sample were placed in an alumina crucible and heated under a N2 flow (50 mL/min). A heating rate of 15 °C/min was used.
3. Results and discussion
3.1. Results from drop tube reactor (DTR)
The major chemical compounds identified and the different families they were grouped into have been summarised in Table 2.
Table 2: Major chemical compounds identified and their different chemical families
| Chemical family | Major molecules identified |
| Alcohols | 1,2-Propanediol, 3-methoxy-, 2-Furanmethanol, 6-Hepten-1-ol, 5-methyl-, 2,4-Hexadien-1-ol, Resorcinol, 3-Heptanol, 3,6-dimethyl-, Thymol, 1,2-Benzenediol |
| Aldehydes | 2-Heptenal, (E)-, 2-Pentenal, (E)-, 3-Furaldehyde, 2-Furancarboxaldehyde, 5-methyl-, Benzaldehyde, 2-hydroxy- |
| Alkanes | Hexane, 3,3,4,4-tetramethyl-, Nonane, Decane |
| Aromatics | Benzene, o-Xylene, Benzene, 1,3-dimethyl-, 1H-Indene, 3-methyl-, Naphthalene, 1,2-dihydro-, Azulene, Naphthalene, 2,6-dimethyl- |
| Amides | N-Methoxy-N-methylacetamide, Benzenacetic amide |
| Carboxylic acids | Acetic acid, Acetohydroxamic acid, Propanoic acid, Benzoylformic acid |
| Esters | Acetic acid, 1-methylethyl ester, 1,1-Ethanediol, diacetate, Phenol, 4-(2-propenyl)-, acetate |
| Furans | Furan, 2,3,5-trimethyl-, Furan, 2-ethyl-, Vinylfuran, Benzofuran, 2-methyl- |
| Guaiacols | Phenol, 2-methoxy-, Phenol, 2,6-dimethoxy-, Phenol, 4-ethyl-2-methoxy- |
| Ketones | 1-Hexen-3-one, 2-Hexanone, 3,4-dimethyl-, 2-Cyclohexen-1-one, 2-Cyclopenten-1-one, 1H-Inden-1-one, 2,3-dihydro- |
| Phenols | Phenol, Phenol, 2-methyl-, Phenol, 2,4,6-trimethyl-, Phenol, 4-ethyl-, 1-Naphthalenol |
| Carbohydrates | Levoglucosan, 3,4-O-Isopropylidene-d-galactose |
3.2. Defining optimal conditions for pyrolysis reaction in the DTR
The mass balance values obtained for the various experimental runs are presented in Figure 2. It is worth mentioning that mass balances of above 85 % were found experimentally for each run. This discrepancy can be explained by the fact that there still remained a fraction of the liquid produced on the walls of the DTR installation that was lost even if every attempt was made to collect all of it. Therefore, the mass balances were completed to 100 % with respect to the liquid fraction.
It can firstly be observed from the previous figure that the lowest temperature (500 °C) tested gave rise to the largest amount of char produced (between 13 and 18 wt. %) and the smallest amount of non-condensable gases formed (between 28 to 30 wt. %). In contrast to the latter observations, 600 °C, the highest temperature utilised corresponded to the lowest amount of char (around 9 to 10 wt. %) and the highest amount of non-condensable gases (49-55 wt. %). Now, so as to detail these findings, the degree of conversion of the biomass at different temperatures, that is, the fraction of biomass that was converted to its pyrolytic products at each pyrolytic temperature, was analysed through TGA under a nitrogen flow rate of 0.5 L/min and the results obtained have been illustrated in Figure 3. The figure also depicts the evolution of the percentage of each pyrolytic product at different reactor temperatures.
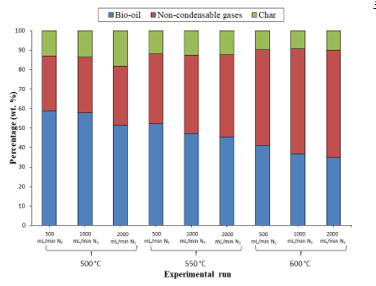 Figure 2: Mass balances of pyrolysis experiments
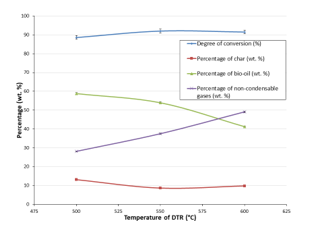 Figure 3: Degree of biomass conversion (TGA) at different DTR temperatures at τ = 9.27 min
It can be seen from the previous figure that the tendency of the degree of conversion and that of the char percentage were opposing ones, as were the evolution of bio-oil and gas percentages. It can therefore be claimed that the gas production bears a direct correlation to the reactor temperature, and that the liquid formation a negative one, that is, at higher temperatures, an improvement in gas formation and a diminishment in liquid production will be witnessed. This observation can be explained by the fact that cracking reactions are favoured at higher temperatures [19], and so, at those temperatures, larger liquid molecules decompose into smaller, gaseous ones. The same observations were obtained from the SFR, as mentioned in previous works [13, 14].
It was also observed that the experiment performed at 500 °C under 0.5 L/min N2 produced the most elevated bio-oil output (58.8 wt. %). These conditions corresponded to the same ones obtained in the SFR [14].
3.3. Influence of gas residence time on pyrolysis liquid and gas products
3.3.1. Liquid product composition
As previously mentioned, in order to elicit a variation in the gas residence time in the DTR, carrier gas (N2) flow rate was changed from 0.5 to 2 L/min. Table 1 shows the resulting residence times. Then, the liquid product compositions for the pyrolysis of beech wood obtained at different reactor temperatures were analysed. Figure 4 illustrates the composition obtained at 500 °C in the DTR. The ones obtained for other reactor temperatures have been tabulated in Table 3.
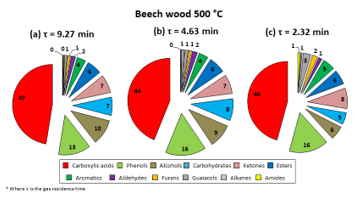 Figure 4: Liquid product compositions obtained for pyrolysis of beech wood at 500 °C in DTR
As it can be seen in Figure 4, although gas residence times have more than halved (9.27 min to 4.63 min to 2.32 min), product compositions were not much influenced. Further calculations were conducted to try to understand the happenings throughout the reaction. These calculations have been compiled in the supplementary materials. From these calculations, it was found that the biomass particle residence time in the reactor was 2.20 s, which was much lower than the gas residence times used (see Table 2). This observation led to the understanding that the parameter that controlled the formation of products and the dynamics of the reaction, that is, the limiting parameter, was in fact the biomass particle residence time, not the gas residence time. Thus, even if the carrier gas flow were increased, hence diminishing gas residence time, the liquid product distribution would undergo no appreciable change as long as the pyrolysis reaction took place in a regime wherein the biomass particle residence time was less than the gas residence time. The same observation was also made by Guizani et al. [7], Jahirul et al. [20] and Ellens [21]. Now, it could be stipulated that raising the N2 flow rate to higher values would help to overcome this obstacle. However, for this specific setup, technical restrictions did not allow the flow rate used to be any higher than 2 L/min.
3.4. Gas product composition
NCG were also examined while the N2 flow rate was altered. Figure 5 illustrates the different NCG compositions obtained at 0.5, 1 and 2 L/min N2 at 500 °C, while the compositions at other temperatures have been listed in the supplementary materials (Table A.3).
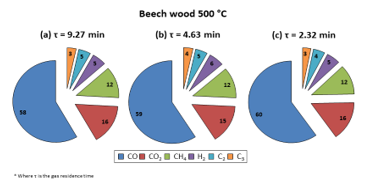 Figure 5: Gas product compositions obtained for pyrolysis of beech wood at 500 °C in DTR
As can be observed from Figure 5, the pattern for the gas composition resembled that for the liquid composition: the gas composition was not majorly influenced by elevating the carrier gas flow rate. Following this, the same inference can be made: even if the gas residence time changes, the gas product distribution is not majorly affected if the pyrolysis regime is not altered.
3.5. Comparison of results from the SFR and the DTR
3.5.1. Liquid product composition
To enhance the visual representation of the various chemical families, pie charts were constructed for the different temperatures and nitrogen flow rates used. An example is Figure 6 (composition of beech wood bio-oil obtained at 500 °C under 0.5 L/min N2 in DTR compared to that obtained in SFR under same conditions). A similar analysis was performed for each bio-oil produced (at 500, 550 and 600°C under N2 flow rates of 0.5, 1 and 2 L/min) and the results have been presented in Table 3.
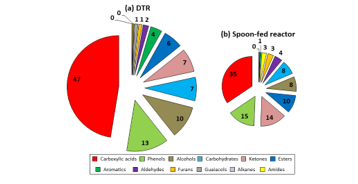 Figure 6: Composition of beech wood bio-oils obtained at 500 °C and τ = 9.27 min in DTR and spoon-fed reactor (τ = 9 min) (mol. %)
It can be observed from Figure 6 that carboxylic acids, phenols and alcohols were the most important chemical families present in the oils. These findings concord to a certain extent with the results found when the SFR was used; the only dissimilarity was that the oils obtained from the SFR contained a higher quantity of ketones and esters. This difference may be explained by the variation in the collected oil components: concerning the DTR, using a more important amount of biomass led to a more significant production of bio-oil, which demanded the use of a smaller amount of solvent so as to be collected. This enabled the detection of compounds which had been present only in negligible fractions in the oil obtained from the SFR, which had been more dilute (338 detected compounds vs. 255 in spoon-fed reactor). The observed variation may also be due to the change in reaction technology used. However, these results vary slightly from those that Guizani et al. [7] obtained. They investigated the fast pyrolysis of biomass in an entrained flow reactor by changing reactor temperature, size of particles and vapour residence time. The major oil components observed by them were aldehydes, ketones and carboxylic acids. This difference might stem from the fact that even though beech wood was used as raw material for their study, they used a gas residence time of 20.6 s for a mean biomass particle size of 640 μm, which both differ from the conditions used in this study. Nevertheless, their maximum oil yield, 62.4 wt. %, was found to be formed at 500 °C, which this time, coincided with the findings presented in this study.
Now, it is interesting to study increasing reactor temperature influences the major families present in oil (the trend has been illustrated in Figure 7). The influence on all the other chemical families has been depicted in the supplementary materials, Figures A.1 (a)-(l).
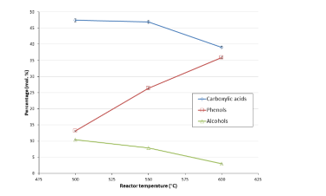 Figure 7: Evolution of major bio-oil components with increasing DTR temperature (τ: 9.27 min)
Figure 7 shows clearly that both carboxylic acid and alcohol percentages decreased when temperature increased, while the opposite trend was portrayed by phenols. These findings do not completely match the results from the spoon-fed reactor, where an increasing trend with temperature was noted for the carboxylic acids.
The diminishment in the percentage of carboxylic acids corresponded with a sharp increase in the percentage of phenol. As mentioned in our previous work [13], carboxylic acids and phenols tend to be negatively correlated; this means that, when one experiences an increase, the other undergoes a reduction. This observation has been well-depicted in Figure 7. Now, a certain difference from results obtained from the SFR has been observed.
Table 3: Chemical family percentages (mol. %) in bio-oil samples obtained from DTR
| Experimental conditions |
Chemical families present (mol. %) |
|||||||||||
| Carboxylic acids | Alkanes | Aromatics | Alcohols | Aldehydes | Amides | Ketones | Esters | Furans | Guaiacols | Phenols | Carbohydrates | |
| 500 °C
0.5 L/min N2 |
47.44 | 0.36 | 3.64 | 10.38 | 1.74 | 0.25 | 7.45 | 6.10 | 1.04 | 1.02 | 13.12 | 7.45 |
| 500 °C
1 L/min N2 |
43.88 | 1.00 | 3.65 | 9.18 | 1.94 | 0.26 | 7.38 | 6.48 | 0.97 | 1.26 | 15.55 | 8.46 |
| 500 °C
2 L/min N2 |
45.75 | 0.53 | 5.09 | 5.67 | 1.49 | 1.01 | 8.35 | 5.99 | 2.13 | 3.15 | 16.03 | 4.81 |
| 550 °C
0.5 L/min N2 |
46.91 | 0.55 | 2.95 | 4.04 | 1.75 | 0.90 | 5.94 | 5.00 | 1.02 | 1.05 | 26.33 | 3.57 |
| 550 °C
1 L/min N2 |
46.34 | 0.29 | 2.60 | 7.92 | 1.40 | 0.72 | 7.24 | 3.28 | 1.00 | 1.04 | 24.88 | 3.29 |
| 550 °C
2 L/min N2 |
47.90 | 1.59 | 3.63 | 5.76 | 1.66 | 0.15 | 6.56 | 3.88 | 0.98 | 1.07 | 23.74 | 3.08 |
| 600 °C
0.5 L/min N2 |
39.04 | 0.33 | 4.90 | 2.97 | 1.76 | 2.08 | 4.75 | 5.21 | 0.71 | 0.98 | 35.90 | 1.38 |
| 600 °C
1 L/min N2 |
38.35 | 0.21 | 2.80 | 3.60 | 1.31 | 1.98 | 4.78 | 8.59 | 1.26 | 1.21 | 34.71 | 1.21 |
| 600 °C
2 L/min N2 |
39.75 | 0.34 | 3.50 | 3.37 | 1.69 | 2.53 | 5.66 | 4.37 | 0.82 | 1.18 | 35.09 | 1.69 |
This variance can be explained firstly by the fact that a higher number of molecules was detected for the DTR and secondly, by the operational conditions of the two reactors used, which varied significantly. This finding illustrates that changing a reaction scale from lab to pilot may ensue in differences in the results obtained, and the same may be observed when reaction technology is changed from batch or semi-continuous to continuous. The latter statement is further corroborated by Table 4, where results obtained from different pyrolysis technologies used have been presented to better grasp the similarities and differences.
Table 4: Comparison of different pyrolysis technologies
| µ-pyrolyser | SFR | DTR | ||
| Amount of raw material | ~mg | ~g | ~100 g | |
| Liquid fraction | No. of molecules identified | 92 | 255 | 338 |
| Major compounds | 40-46 % acetic acid
No levogluco-san |
35 % acetic acid
8 % levogluco-san |
47 % acetic acid
7 % levogluco-san |
|
| Trend of acetic acid with reactor temperature | ↘ | ↗ | ↘ | |
| Gas fraction | No gas analysis performed as only traces were detected | Detection of:
45 % CO 40 % CO2 11 % CH4 3 % H2 |
Detection of:
58 % CO 16 % CO2 12 % CH4 5 % H2 |
|
| References | [16] | [13, 14] | This study | |
3.6. Gas product composition
NCG went through the same analysis that liquid products did. Figure 8 represents the gas product distributions obtained for samples at 500 °C under 0.5 L/min N2 in the DTR and the SFR. Results compiled from diagrams showing NCG compositions when reaction conditions are varied have been listed in Table A.3, found in the supplementary materials.
Firstly, it was observed that CO was the majorly present species (58 vol. %). This result concords with that of Guizani et al. [7] (58.4 vol. %), and the variance from what was found with the SFR was not very large (45 vol. % for CO, the major gas component). However, it was witnessed that the gaseous product distribution changed slightly with DTR use: a more important fraction of each NCG component was detected. This may be owing to the fact that, as it was with the liquids, a higher amount of biomass was supplied to the DTR than to the SFR and this led to the production of more concentrated NCG, enabling easier detection of smaller gas molecules that were henceforth less dilute in the carrier gas. Furthermore, Figure 9 was obtained by analysing the trend of each NCG component at 0.5 L/min N2 with increasing reactor temperature. The graphs obtained with the use of other flow rates have been presented in the supplementary materials, Figures A.2 and A.3.
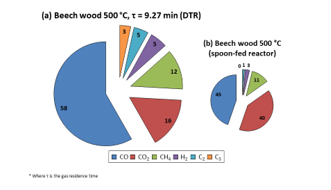 Figure 8: Composition of beech wood NCG obtained at 500 °C in DTR and spoon-fed reactor (vol. %)
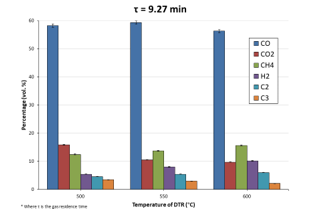 Figure 9: Evolution of NCG components (vol. %) with DTR temperature at τ = 9.27 min
The NCG composition evolved quite feebly at different DTR temperatures: a spike of CO was noted at 550 °C while increasing pyrolysis temperature caused a CO2 percentage decrease. All other gaseous compounds, excluding C3, went through a raise in percentage with increasing reactor temperature. The general increase in CO and decrease in CO2 trend observed with the SFR when reaction temperature was increased, somewhat shifted when the DTR was used. In this case, it was seen that whilst a decrease in the percentage of CO2 was indeed witnessed, CO percentage remained almost stable (as CO was the major component). Still, if quantitative values are taken into consideration, a raise in the volume of CO can be observed, substantiating the theory that mounting the temperature of the reactor indeed privileged cracking reactions and thereby, formation of gas molecules, as per what was mentioned previously.
3.7. Water content of liquid products
KF titration method was utilised to estimate water content for each experiment. The detailed results can be found in Figure 10. It can be observed that a reduction in the water content was caused by a raise in the temperature of DTR (maximum water content: 48 wt. % at 600 °C under 1 L/min N2). This coincided with a reduction in some chemical families such as alcohols, carbohydrates and carboxylic acids as well. Similar findings were made by Lehto et al. [22]. It can be therefore be claimed that elevating the temperature of the reactor promoted the dehydration of the previously-mentioned chemical families.
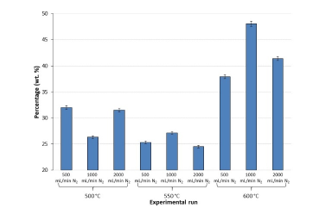 Figure 10: Water content (wt. %) of bio-oils obtained from each experimental run
3.8. Oxygen content of liquid products
The elevated oxygen fraction of pyrolytic oils, which renders them highly functionalised [23], remains a crucial challenge to their mainstream use. This high functionality is what causes the bio-oils to be relatively highly viscous, acidic and unstable and to possess low calorific values. Therefore, acquiring an indication of the oxygen fraction formed directly from the compounds found in the bio-oil (oxygen fraction derived from humidity not included) is key to be able to understand the behaviour of the oil and therefore, find a way to improve its properties. The theoretical calculation of the oxygen content was conducted from the weight of the oxygen atoms present in the compound. Figure 11 illustrates the evolution of the bio-oils’ oxygen content (mol. %) obtained at DTR different temperatures under various N2 flow rates.
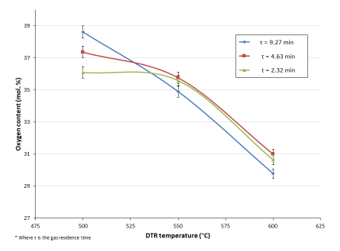 Figure 11: Oxygen content (mol. %) of bio-oils obtained from all experimental runs
It can be observed that increasing the temperature of the DTR caused the oxygen content to lessen. This finding corroborates the fact that cracking reactions and the elimination of certain oxygen-containing chemical groups are favoured by more elevated reaction temperatures. Thus, the formation of smaller, gaseous molecules was privileged. Hence, at more elevated temperatures, a less significant amount of liquid was collected and some of the oxygen atoms escaped in the gas fraction. Nonetheless, the global bio-oil oxygen content remained quite high (29-40 mol. %) in contrast to that of the bio-oils obtained from the spoon-fed reactor (average of 33 mol. %) and also, that of fossil-derived fuels (~1 %) [24].
4. Conclusion
The results pertaining to liquid and gas products obtained for a continuous pyrolysis reaction in a DTR were presented in this study. The goal of this research work was first to investigate a comparison a batch and a continuous pyrolysis reactor and the subsequent existing differences and similarities by examining the obtained liquid and gas compositions. The temperature of the DTR and the gas residence time were primarily changed to study the effect on the pyrolytic products. Even though not the same pyrolytic reactor was used, it was observed that the parameters rendering the maximum yield of bio-oil were the same in both cases: 500 °C under 500 mL/min N2 (~58 wt. %). It was also observed that while changing the temperature affected significantly the product distribution (it was seen that the use of higher temperatures gave rise to higher amounts of gas products and a more acidic oil), changing the gas residence time did not cause much change to the product distribution. This was due to the fact that pyrolysis was occurring within the same intermediate regime (τ: ~9 min), and that the reaction limiting factor was the residence time of the biomass particle (20.6 s), not that of the gas. Finally, many inconsistent findings were observed between the spoon-fed and the continuous setups. This means that when comparisons are undertaken for results obtained from setups of different scales, it should be with caution as the results might not be directly comparable. This fact highlights the need for deeper research so as to understand the differences in the results obtained from differently-scaled reactors.
Conflict of Interest
The authors declare no conflict of interest.
Acknowledgment
This project has been funded with the support from the European Union with the European Regional Development Fund (ERDF) and the Regional Council of Normandie.
Supplementary Materials
Table A.1 illustrates the elemental analysis of the raw material used as feed for this study, while Table A.2 presents the proximate analysis of beech wood based on thermogravimetric measurements.
Table A.1: Elemental analysis of biomass used
| Biomass/Biomass Component used | Elemental analysis (wt. %) | |||
| Carb-on | Hydrogen | Nitrogen | Oxygen | |
| Beech wood (BW) | 47.38 | 6.11 | <0.01 | 46.51 |
Table A.2: Proximate analysis of different raw materials based on TGA experiments (wt. %)
| Humidity | Volatile matter | Fixed carbon | Ash | |
| Beech wood (BW) | 7.44 | 74.19 | 17.52 | 0.85 |
Hydrodynamic calculations for pyrolysis reaction occurring in DTR
- Determining terminal velocity, ut, of biomass particles
Using Stoke’s law, , for 0.1<Re<1000
Where = 0.5956 kg/m3 and = 840 kg/m3
d: biomass particle diameter = 0.0004 m
g: gravity = 9.812 m/s2 [25]
Re: Reynold’s number = ,
where µ: dynamic viscosity of carrier gas = 3.49 × 10⁻⁵ kg/m.s [25]
CD: drag coefficient =
To determine the terminal velocity of the biomass particle, an iterative calculation is required. The Reynold’s number, Re0 is first calculated for an initial value of ut,0 = 3 m/s [21], followed by the drag coefficient CD,0 and finally, once again, the terminal velocity, ut,1. This process repeats itself; the values of Re1 (using ut,1), CD,1 and then, ut,2 and so on are obtained n times until (ut,n2 – ut,n-12)2 = 0.
The values thus found were: Re = 15.41; CD = 3.04; ut = 1.08 m/s
tparticle: residence time of biomass particle = = 2.20 s, where Lr is the length of the reactor.
The following Table A.3 details the different NCG compositions obtained for the various experimental runs performed.
Table A.3: NCG compositions (vol. %) obtained for all experimental runs
| Experiment performed | vol. % | |||||
| CO | CO2 | CH4 | H2 | C2 | C3 | |
| 500 °C,
0.5 L/min N2 |
58.27 | 15.86 | 12.46 | 5.39 | 4.60 | 3.43 |
| 500 °C,
1 L/min N2 |
59.06 | 15.16 | 12.08 | 5.69 | 4.51 | 3.50 |
| 500 °C,
2 L/min N2 |
59.80 | 15.53 | 11.86 | 5.23 | 4.42 | 3.15 |
| 550 °C,
0.5 L/min N2 |
59.38 | 10.54 | 13.68 | 7.98 | 5.41 | 3.00 |
| 550 °C,
1 L/min N2 |
60.08 | 10.47 | 13.27 | 7.84 | 5.30 | 3.04 |
| 550 °C,
2 L/min N2 |
60.46 | 10.44 | 12.69 | 7.95 | 5.19 | 3.28 |
| 600 °C,
0.5 L/min N2 |
56.32 | 9.70 | 15.64 | 10.14 | 6.00 | 2.19 |
| 600 °C,
1 L/min N2 |
56.60 | 9.59 | 15.11 | 10.41 | 5.93 | 2.36 |
| 600 °C,
2 L/min N2 |
56.44 | 9.56 | 14.56 | 11.17 | 5.79 | 2.48 |
- N. Boukaous, L. Abdelouahed, M. Chikhi, A.-H. Meniai, and B. Taouk, ‘Combustion behaviour of several Mediterranean biomass sources and their blends biomass/char’, in 2019 10th International Renewable Energy Congress (IREC), 2019, pp. 1–6, doi: 10.1109/IREC.2019.8754608.
- G. Gentile, A. Cuoci, A. Frassoldati, T. Faravelli, and E. Ranzi, ‘A comprehensive cfd model for the biomass pyrolysis’, Chemical Engineering Transactions, pp. 445–450, 2015, doi: 10.3303/CET1543075.
- S. S. Lam, R. K. Liew, A. Jusoh, C. T. Chong, F. N. Ani, and H. A. Chase, ‘Progress in waste oil to sustainable energy, with emphasis on pyrolysis techniques’, Renewable and Sustainable Energy Reviews, vol. 53, pp. 741–753, Jan. 2016, doi: 10.1016/j.rser.2015.09.005.
- L. Lu, Y. Jin, M. R. Nakamura, M. J. Castaldi, and K. Yoshikawa, ‘An Investigation on Cocombustion Behaviors of Hydrothermally Treated Municipal Solid Waste with Coal Using a Drop-Tube Reactor’, Journal of Combustion, 2012. [Online]. Available: https://www.hindawi.com/journals/jc/2012/282851/. [Accessed: 20-Sep-2018].
- M. Bajus, ‘Pyrolysis of woody material’, Petroleum & Coal, vol. 52, no. 3, pp. 207–214, 2010.
- A. Demirbas, ‘The influence of temperature on the yields of compounds existing in bio-oils obtained from biomass samples via pyrolysis’, Fuel Processing Technology, vol. 88, no. 6, pp. 591–597, Jun. 2007, doi: 10.1016/j.fuproc.2007.01.010.
- C. Guizani, S. Valin, J. Billaud, M. Peyrot, and S. Salvador, ‘Biomass fast pyrolysis in a drop tube reactor for bio oil production: Experiments and modeling’, Fuel, vol. 207, pp. 71–84, Nov. 2017, doi: 10.1016/j.fuel.2017.06.068.
- S. Sun, H. Tian, Y. Zhao, R. Sun, and H. Zhou, ‘Experimental and numerical study of biomass flash pyrolysis in an entrained flow reactor’, Bioresource Technology, vol. 101, no. 10, pp. 3678–3684, May 2010, doi: 10.1016/j.biortech.2009.12.092.
- A. Hornung, ‘Intermediate Pyrolysis as an Alternative to Fast Pyrolysis’, BioEnergy IV: Innovations in Biomass Conversion for Heat, Power, Fuels and Chemicals, Jun. 2013.
- A. S. N. Mahmood, J. G. Brammer, A. Hornung, A. Steele, and S. Poulston, ‘The intermediate pyrolysis and catalytic steam reforming of Brewers spent grain’, Journal of Analytical and Applied Pyrolysis, vol. 103, pp. 328–342, Sep. 2013, doi: 10.1016/j.jaap.2012.09.009.
- I. D. V. Torri et al., ‘Bio-oil production of softwood and hardwood forest industry residues through fast and intermediate pyrolysis and its chromatographic characterization’, Bioresour. Technol., vol. 200, pp. 680–690, Jan. 2016, doi: 10.1016/j.biortech.2015.10.086.
- K. Kebelmann, A. Hornung, U. Karsten, and G. Griffiths, ‘Intermediate pyrolysis and product identification by TGA and Py-GC/MS of green microalgae and their extracted protein and lipid components’, Biomass and Bioenergy, vol. 49, pp. 38–48, Feb. 2013, doi: 10.1016/j.biombioe.2012.12.006.
- C. Mohabeer, L. Abdelouahed, S. Marcotte, and B. Taouk, ‘Comparative analysis of pyrolytic liquid products of beech wood, flax shives and woody biomass components’, Journal of Analytical and Applied Pyrolysis, vol. 127, pp. 269–277, Sep. 2017, doi: 10.1016/j.jaap.2017.07.025.
- C. Mohabeer et al., ‘Production of liquid bio-fuel from catalytic de-oxygenation: Pyrolysis of beech wood and flax shives’, Journal of Fuel Chemistry and Technology, vol. 47, no. 02, pp. 153–166, Feb. 2019.
- C. Mohabeer, L. Reyes, L. Abdelouahed, S. Marcotte, and B. Taouk, ‘Investigating catalytic de-oxygenation of cellulose, xylan and lignin bio-oils using HZSM-5 and Fe-HZSM-5’, Journal of Analytical and Applied Pyrolysis, vol. 137, pp. 118–127, Jan. 2019, doi: 10.1016/j.jaap.2018.11.016.
- J. D. Murillo, E. A. Ware, and J. J. Biernacki, ‘Characterization of milling effects on the physical and chemical nature of herbaceous biomass with comparison of fast pyrolysis product distributions using Py-GC/MS’, Journal of Analytical and Applied Pyrolysis, vol. 108, pp. 234–247, Jul. 2014, doi: 10.1016/j.jaap.2014.04.010.
- L. Garcia, M. L. Salvador, J. Arauzo, and R. Bilbao, ‘Influence of catalyst weight/biomass flow rate ratio on gas production in the catalytic pyrolysis of pine sawdust at low temperatures’, Ind. Eng. Chem. Res., vol. 37, pp. 3812–3819, 1998.
- N. Charon et al., ‘Multi-technique characterization of fast pyrolysis oils’, Journal of Analytical and Applied Pyrolysis, vol. 116, pp. 18–26, Nov. 2015, doi: 10.1016/j.jaap.2015.10.012.
- Y. Fan, Y. Cai, X. Li, N. Yu, and H. Yin, ‘Catalytic upgrading of pyrolytic vapors from the vacuum pyrolysis of rape straw over nanocrystalline HZSM-5 zeolite in a two-stage fixed-bed reactor’, Journal of Analytical and Applied Pyrolysis, vol. 108, pp. 185–195, Jul. 2014, doi: 10.1016/j.jaap.2014.05.001.
- M. I. Jahirul, M. G. Rasul, A. A. Chowdhury, and N. Ashwath, ‘Biofuels Production through Biomass Pyrolysis —A Technological Review’, Energies, vol. 5, no. 12, pp. 4952–5001, Nov. 2012, doi: 10.3390/en5124952.
- C. Ellens, ‘Design, optimization and evaluation of a free-fall biomass fast pyrolysis reactor and its products’, Graduate Theses and Dissertations, Jan. 2009.
- J. Lehto, A. Oasmaa, and Y. Solantausta, ‘Fuel oil quality and combustion of fast pyrolysis bio-oils’. 2013.
- J. D. Adjaye and N. N. Bakhshi, ‘Production of hydrocarbons by catalytic upgrading of a fast pyrolysis bio-oil. Part I: Conversion over various catalysts’, Fuel Processing Technology, vol. 45, no. 3, pp. 161–183, Dec. 1995, doi: 10.1016/0378-3820(95)00034-5.
- S. Xiu and A. Shahbazi, ‘Bio-oil production and upgrading research: A review’, Renewable and Sustainable Energy Reviews, vol. 16, no. 7, pp. 4406–4414, Sep. 2012, doi: 10.1016/j.rser.2012.04.028.
- Engineering ToolBox, ‘The Engineering ToolBox’, 2001. [Online]. Available: https://www.engineeringtoolbox.com/. [Accessed: 04-Oct-2018].