
Optimal Flow Analysis of a Unified Energy System with Effects of P2G
Volume 5, Issue 2, Page No 425-431, 2020
Author’s Name: Haseeb Yar Hiraja), Wenping Qin, Muhammad Abbas, Muhammad Zeeshan Adil
View Affiliations
Taiyuan University of Technology, Electrical & Power Engineering, College of Electrical Engineering, 030000, China
a)Author to whom correspondence should be addressed. E-mail: haseebyar@gmail.com
Adv. Sci. Technol. Eng. Syst. J. 5(2), 425-431 (2020); ![]() DOI: 10.25046/aj050255
DOI: 10.25046/aj050255
Keywords: P2G, Integrated Energy System, Newton Raphson method, Bi-directional Energy Conversion

Export Citations
The reformation of energy hubs has significantly augmented the apprehensions about the levels of dependency between different energy sources which often can also be discussed as independent systems conventionally. This research brings focus on the formulation and analysis of an integrated system with bi-directional energy conversions and its effects on the stability of the system for the benefit of overall secure and cost-effective operations. A general unification approach is adopted for the integration of two energy systems to execute optimal flow analysis in the form of one system based on Newton-Raphson scheme. PV solar energy is added into the system via electrical power system (EPS) to analyze the effects of renewable energy on electric network. A case study is presented to analyze the operational status of EPS and natural gas system (NGS) and effects of different factors on each system. The applicability of the proposed method is established by analysis of 20-Node Belgian gas network combined with IEEE-39 test system. The proposed method verifies not only that integrated systems with P2G capabilities and bi directional conversion increases the rate of smooth and reliable operations significantly but also discusses the limitations still present.
Received: 02 January 2020, Accepted: 19 March 2020, Published Online: 04 April 2020
1. Introduction
In recent years, with the widely use of natural gas fired generators and the encouraging functionality of Power to Gas (P2G) technology, the dependency between electrical systems and gas Networks is getting more adaptive worldwide [1-4]. In light of these developments, it is Indispensable to model the electrical and gas networks as a unified energy system. [5, 6].
The influence and implementation of renewable energy resources, such as wind and solar energy, have rapidly increased during the last few years in response to the scarcity of fossil fuels, global warming and climate change. Considering current environmental challenges and shortage of energy, it has become more of a global consensus to switch towards renewable energy [7, 8]. Literature and design of the future 100% renewable energy are well discussed in [9, 10]. Renewable energy resources play an imperative and effective role in the accomplishment of sustainable and environmentally friendly power generation. However, the unpredictable nature and uncertainty of it causes imbalance in supply and demand. To address this issue, gas fired generators (GPG) with faster response ability can be employed. On the other hand, large scale energy storage technologies should be implemented to accumulate the excessive renewable energy [11]. A P2G which converts electricity into hydrogen and synthetic natural gas (CH4) presents a promising solution to energy storage [1]. To solve problems like excessive energy accumulation and reduction of carbon dioxide (CO2) can be achieved by the development of an integrated energy network with P2G capabilities. Achieving such system also lies in economic benefits, such as integrated operations of coupled networks that yield an overall optimal outcome. [12-15]. Security and optimal reliability have always been an obstacle in achieving such a deeply interdependent system. Natural gas networks and electrical energy supplying systems are entirely dependent on each other for inputs which causes disruption in one system if there is any uncertainty in the proportional system and it affects the overall performance of the unified system.
Previously, extensive studies have been led in electrical systems and natural gas exclusively, but an integrated system analysis is still inadequate [16]. The state-of-the art reviews on integrated energy system are well documented and presented in [17, 18]. Many important, game changing technical constraints are often ignored or overlooked to ease the complexity when modeling a unified system, even though the technical model is responsible for secure, efficient and productive operations. [18]. Different tactics have been projected over time to create a unified gas and electricity network. A multi time period combined gas and electricity network optimization model is discussed in [19], and it considers the changeable nature of gas flows and grid auxiliaries. Another model discussed in [20] suggests a multi stage model for co-planning and optimal co-expansion for a unified system. The consistency of the system is mainly prone to the threats like operations under abnormal conditions, such as surges and shutdowns [21]. Different possible impacts and advantages of P2G in a unified system are discussed in detail in Qadrdan et al. [22].
In order to further extend the research and analysis of a unified system with an optimal power flow, a comprehensive model is required. Thus, this research puts emphasis on design and implementation of a unified energy system with P2G capabilities to convert energy in to different forms and store efficiently. Nodal balance is the most effective method to obtain non-linear equations for the power and gas flows. On the basis of equations achieved for a unified system, a case study has been conducted to demonstrate the feasibility of the proposed approach on the IEEE-39 test system connected with Belgium-20 node gas network by the means of integrated formulation and connection between two systems using gas-compressors, P2G and gas-fired power plants. The effects of renewable PV energy and power output are investigated the effects of pressure in a gas network are studied to relate its significance on the overall system. The notable outcomes this research provides are:
- A coherent integrated system of electrical energy with gas network, which includes gas compressors, the power-to-gas and gas-fired power plants.
- Mathematical simulations are performed in MATLAB to validate the precision and viability of the proposed technique.
- The effects of injecting renewable energy in to the system has been tested with the help of a case study.
- The properties of P2G on electrical infrastructure and natural gas system are discussed.
- The limitations of the proposed technique are discussed.
The remaining part of the paper is structured as follows. Modelling of power system and gas network is presented in section 2. Section 3 offers a detailed unification of gas and electrical system into one interdependent network. Section 4 illustrate the case study of such system and discusses the numerical simulations and results. Section 5 discusses the results and conclusions drawn from this piece of research.
2. Modelling
2.1. Power System Formulation
Power stream analysis are of boundless significance in design and operation of power systems. In a power system, power flow calculations are mainly performed to collect voltage magnitude and associated angles for each bus [23]. Bus voltage V and nodal admittance matrix Y are expressed in polar coordinates in following form.
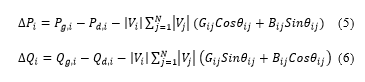
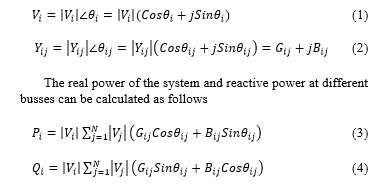 Here, in equation (3) & (4) = – . It establishes the polar form of the power flow equations. By using these equations, calculations can be performed for net active power and reactive power entering the bus . Let and denotes the power generated and power consumed at a specific node. The nodal power balance equations can be defined as
 2.2. Gas Flow Formulation
Gas flow equations, compression power calculations and nodal mass balance methodology is an ideal way to achieve a steady state model of natural gas system. On the basis of the principle of isothermal flow properties, it is observed that long distance pipelines can achieve constant values of temperature [24]. Therefore, the temperature nonconformity and elevation changes in gas pipelines are ignored in this research. This work concentrates on the steady state isothermal flow of the gas in pipelines and the nodal balance equations produced are stated below
- Pipe Flow Equation
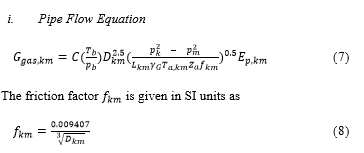 Pipe diameter is the only factor included to determine the value of friction factor. The eq. 8 which shows the physical characteristics of a pipeline with fixed gas composition can be simplified by a single constant [25].
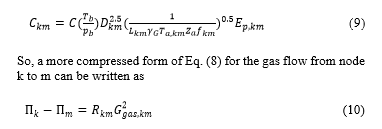 Where = p_ , = and which denotes the hydraulic resistance coefficient of the channel.
- Compression Power Calculation
The compression ratio (CR) has a relationship with break horsepower and gas flow rate in the compressor. In other words, compression ratio (CR) is of absolute value of discharge pressure to the absolute value of suction pressure [26].
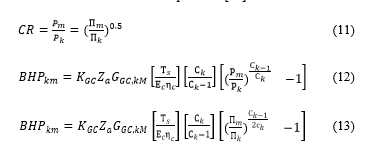 In eq. (12), (13) is a constant and its value depends on the unit of .Generally, for MM scfd, the value of is 0.0854; it is worth mentioning that 1 MMscfd of gas flow at 15 degrees Celsius equals 1177m3/h in flow rate. So, the value of KGC is 7.26×10⁻⁵ if the unit of is given as 1177m3/h.
- Nodal Gas Balance Equation
The nodal gas balance equation indicates the sum of the inflows and outflows at the node should must be zero.
![]() Assuming a natural gas distribution network with N nodes and M branches, a reference node is pre-set with given nodal pressure. The unknown variables include (N-1) nodal pressure and M pipeline flow are unknown variables in the system.
Assuming a natural gas distribution network with N nodes and M branches, a reference node is pre-set with given nodal pressure. The unknown variables include (N-1) nodal pressure and M pipeline flow are unknown variables in the system.
2.3. Integrated Natural Gas and Power System
In any integrated system, GPG and P2G are essential in energy conversion process.
- Gas Fired Power Generation
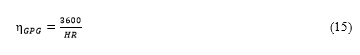
Power plant efficiency is specified in terms of heat rate (HR). The ratio of heat given up by natural gas in relation to its lower calorific value (LHV), to the total power available at GPG is known as HR [27]. The SI unit of heat rate is MJ/MWh. So, a lower heat value rate and higher efficiency is stated in [28] as
 The mathematical relationship of power generation and natural gas network based on the heat rate curve can be presented as
![]() The coefficients define the efficiency in the energy conversion process. On the account of these mathematical equations, the gas consumption (m3/h) can be calculated about roughly from
The coefficients define the efficiency in the energy conversion process. On the account of these mathematical equations, the gas consumption (m3/h) can be calculated about roughly from
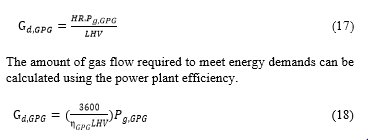 In above equation, the value of LHV is from 35.40 to 39.12 MJ/ m3 [29].
- Power to Gas
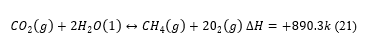
Hydrogen gas is produced as a result of power to gas conversion and it can be used as a fuel to gas networks. Hydrogen gas as an input to the gas network comes with its drawbacks such as adverse effects on pipelines, burners, boilers or even gas engines. This leads to many restrictions imposed on injecting hydrogen as a fuel to gas networks [22]. Methane gas ( ) has always been the most ideal choice to be used as a fuel. P2G process consists of two steps: electrolysis and methanation. In first step, water is split into hydrogen and oxygen. The chemical reaction is given in [30] as
![]() Sabatier reaction is the process for synthesis of hydrogen and carbon dioxide in to methane gas and this process is called methanation.
Sabatier reaction is the process for synthesis of hydrogen and carbon dioxide in to methane gas and this process is called methanation.
![]() The production of methane makes the process of compression, metering and injecting to natural gas network makes it more reliable. Combining both reactions (19) and (20), the overall reaction of P2G is stated as
The production of methane makes the process of compression, metering and injecting to natural gas network makes it more reliable. Combining both reactions (19) and (20), the overall reaction of P2G is stated as
 3. Unification of Systems
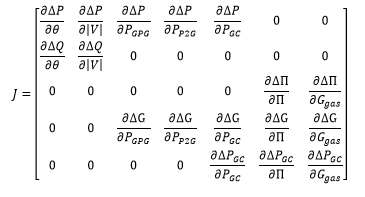
Proposed flow models of both systems can be gathered to form a unified energy system, so that its steady state energy distribution can be analyzed in terms of its input and output. Nonlinear equations representing power flow and gas flow systems obtained by nodal balance are stated as
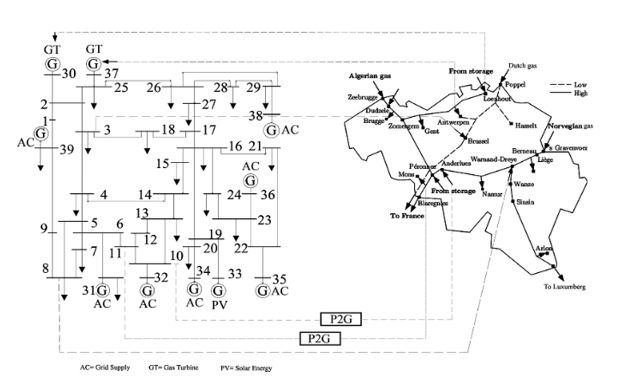 Figure 1: Structure of integrated electric and gas structured
BHP is measured in ft.lbs/sec and it can be converted to power unit (MW). One horsepower equals to 745.7 watts. Thus, the new form of power consumed by compressor is
 Newton Raphson method is widely used for solving nonlinear equations. Take a point X close to the possible exact solution, then the linearization of all nonlinear equations at X can be presented using Taylor expansion as stated in [31].
![]() Here, in this equation, X represents all the unknown variables and F(X) represents all the mismatches, then
Here, in this equation, X represents all the unknown variables and F(X) represents all the mismatches, then
 4. Case Study
We established a case study to demonstrate the proposed unified modelling and solution. An IEEE-39 test system is combined with Belgium 20-node gas network as shown in fig. 1. The electricity infrastructure is consisted of total 39 busses and 46 branches, built on ten generators with seven of them connected with AC big grid, two gas fired generators and one generator producing energy from PV solar. A total of twenty-one loads are attached to the electrical network including two nodes specified for P2G conversions. The node 30 and 37 represents the gas fired generators, node 33 is a PV solar based renewable energy, and node 10 and 11 are with the pressurizers installed while the node 3 and 8 converts electrical energy in to gas by the means of P2G. The 20-node gas network is composed of nineteen pipelines and twenty nodes. The nodal pressure is specified as 1MPa on the reference node. The nodal parameters are given in table 1. Flow rate and pipeline capacity for each pipeline are presented in Table 2.
Table 1: Nodal Parameters of NGS
| No. | Name | Gas Supply (m3/h) | Gas demand (m3/h) | Gas pressure (Kpa) |
| 1 | Zeebugge | 17.24682076 | 0 | 63.65693325 |
| 2 | Dudzele | 11.55 | 0 | 63.59142946 |
| 3 | Brugge | 0 | 5.88 | 63.29836967 |
| 4 | Zomergem | 0 | 0 | 59.91755089 |
| 5 | Loenhout | 7.2 | 0 | 60.6756345 |
| 6 | Antwerpe | 0 | 6.05 | 57.58851446 |
| 7 | brussel | 0 | 7.88 | 57.58851446 |
| 8 | haseelt | 26 | 0 | 66.2 |
| 9 | Berneau | 0 | 0 | 65.568138 |
| 10 | Liege | 0 | 9.55 | 62.97687116 |
| 11 | Warnand | 0 | 0 | 61.54785195 |
| 12 | Namur | 0 | 1.71 | 58.91868179 |
| 13 | Anderlues | 1.8 | 0 | 56.82349342 |
| 14 | Peronnes | 1.44 | 0 | 56.48709817 |
| 15 | Mons | 0 | 10.27 | 53.6465546 |
| 16 | Blaregnies | 0 | 23.42 | 50 |
| 17 | Wanze | 0 | 0 | 61.19625306 |
| 18 | sinsin | 0 | 0 | 58.30205055 |
| 19 | Arlon | 0 | 0.33 | 45.77828544 |
| 20 | Petange | 0 | 1.16 | 45.24689417 |
Table 2: Branch Parameters of NGS
| No | From bus | To bus | Pipeline Capacity (C) | Flow rate |
| 1 | 1 | 2 | 6.02338 | 250.16 |
| 2 | 2 | 3 | 4.91796 | 204.26 |
| 3 | 3 | 4 | 1.18128 | 49.06 |
| 4 | 5 | 6 | 0.31663 | 13.15 |
| 5 | 6 | 7 | 0.38556 | 16.01 |
| 6 | 7 | 4 | 0.47633 | 19.78 |
| 7 | 4 | 14 | 0.81219 | 33.73 |
| 8 | 8 | 9 | 3.02268 | 125.53 |
| 9 | 9 | 10 | 1.51121 | 62.77 |
| 10 | 10 | 11 | 1.35167 | 56.14 |
| 11 | 11 | 12 | 0.92943 | 38.6 |
| 12 | 12 | 13 | 0.95238 | 39.56 |
| 13 | 13 | 14 | 2.69374 | 111.88 |
| 14 | 14 | 15 | 1.90476 | 79.11 |
| 15 | 15 | 16 | 1.20467 | 50.03 |
| 16 | 11 | 17 | 0.22681 | 9.42 |
| 17 | 17 | 18 | 0.08012 | 3.33 |
| 18 | 18 | 19 | 0.04127 | 1.71 |
| 19 | 19 | 20 | 0.16679 | 6.93 |
- Effects of Renewable Energy
In order to investigate the impact of power supplied by PV Solar and fluctuation of power demand on the integrated system, a stochastic data of PV solar energy is injected in to the electric network at node 33. The PV solar data is obtained from 20KW solar power panel installed at Taiyuan University of technology. Its parameters and rated values are given in table 3. The analysis shows that energy produced from the PV solar has a great and direct impact on power demand. Not only that the renewable energy produced can be useful for the peak rectification purposes but it can also be stored as gas if surplus.
Table 3. Rated Parameters of the Solar Module
| Installed rated capacity | 20 KW |
| Total sets | 13 |
| Face direction | 25 Degrees south |
| Max Power (Per string) | 270 W |
| Rated voltage | 38.10 V |
| Rated current | 9.45 Amps |
| Invertor | Sun 2000-33KTL |
| Inverted Max I/P Dc | 33800 W |
| Max I/P voltage | 1000 V |
| Total O/P | 30000 W |
| Max active power | 3300 W |
| Rated O/P Voltage | 380 V |
| Max O/P current | 48 Amps |
| Max Harmonic distortion | 3 % |
The MATLAB simulations shown in Figure 2-3 describes the trends of PV solar output and power demand for the month of June 2018. It is observed that demand tends to be decreasing during the night hours and can be easily compensated with the input available by primary source of energy but as the demand increases during the day time and at noon it can be met by adding additional renewable energy into the system. The output of PV solar is always irregular and alternating by nature. There is no output during the night hours but even during the daylight the output varies constantly due to different factors like weather conditions, humidity and availability of sunlight. This property also shows the reverse trend ability of PV output to the electricity demand because of the fluctuation in production. Thus, a backup capacity such as GPG is required to provide peak regulation, while a large-scale storage technology such as P2G is increasingly needed to store the surplus solar power to accommodate the growing supplies of intermittent renewable energy. This technique therefore, imposes a strong emphasis on the presence of P2G in a unified energy system. Renewable energy like solar and wind depends upon various factors which cannot be controlled and are natural, but by injecting the renewable energy into a primary network or stored in for of P2G if surplus, can provide with many potential benefits such as meeting peak demand and increasing overall efficiency. Thus, the prosed technique can be further studied to make a unified system more sophisticated.
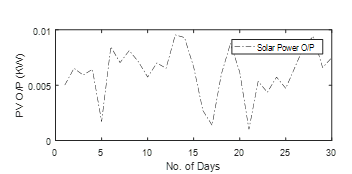 Figure 2: Daily average Output Power of the Solar Module for the Month of June 2018
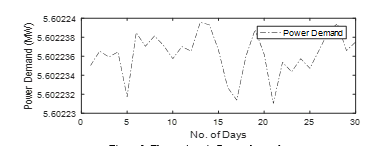 Figure 3: Fluctuations in Power demand
- Effects of Integrated System and P2G on Gas Network
Previously a large amount of literature has been entirely focused on how P2G helps in mitigating power losses and energy losses in an integrated system with respect to its electrical network such as mitigation effects of P2G in an integration system in terms of its total energy loss, power consumed by gas compressors and fluctuations in renewable energy. However, this study tries to demonstrate the effects of P2G on the gas network. Table 1 stated the Gas supply and Gas Demand along with Gas pressure at each node of the NGS. Whereas the branch parameters are listed in Table 2. Pipeline capacity and flow rate for each node are calculated using these parameters in MATLAB to simulate the effect of P2G on a unified system. Figure 4 shows that gas flow rate is independent of the pipeline capacity. The nodes receiving energy from electrical system via P2G has a rising flow rate. Whereas, nodes transferring gas into the electrical system has comparatively lowest flow rates. These barriers are mostly because of the elevation throughout the pipeline and temperature variations. These issues can be addressed by adding multiple pressurizers and compressors along to the pipeline to maintain a constant pressure regardless of the flow rate of the gas pipeline. In figure 5 it can be seen that by adding pressurizers, the pressure in the gas network can be maintained. Adding pressurizer or compressors can reduce the pressure drop even if the flow rate fluctuates.
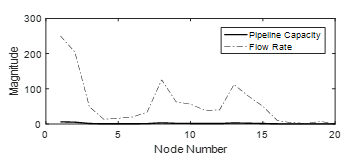 Figure 4: Pipeline capacity and its effect on flow rate
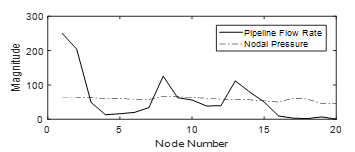 Figure 5: Pressure variation at each node
Just like the voltage stability in an electrical system is a vital factor in reliability of the system, the nodal gas pressure is an important factor for secure operation of gas networks. Figure 5 compares the pressure at each node with respect to the flow rate of the respective node. By using the proposed approach of adding pressurizers at nodes with weak flow rates, the pressure of the pipelines can be maintained within a specified range. From the results of this study, this is clear that, the proposed methodology helps in maintaining the pressure in the gas network for smooth operations.
5. Conclusion
This paper proposed an integrated system of energy flow between electric and gas network with a bi-directional energy conversion. The model studied and implemented to analyse the effects shows that renewable energy is of high importance and with the help of P2G it can be stored in the form of gas for future use. The conventional modelling of this infrastructure has been expanded to consider the unification of two systems and injecting renewable energy in form of solar. The set of non-linear equations representing the harmonized natural gas and electrical system have been obtained based on nodal flows respectively and later solved with the help of Jacobian matrix. Numerical example has been presented to demonstrate the prowess of the proposed method with strong emphasis on the integration of two systems. The system can be studied for future research purposes as to circumvent the problems like environmental temperature and elevation of pipelines and to coup with intermittent nature of renewable energy.
Nomenclature
Indices:
s, d, g supply, demand, generation
GPG, P2G, GC gas-fired power generation, power to gas, gas compressor
Parameters:
Constant 77.54 for gas flow formulation in English units
Compression ratio
GPG proportional relationship of energy conversion from gas to power in GPG m3/ MWh
Conversion of electrical energy in to gas using P2G m3/ MWh
Overall transmission coefficient for an individual pipeline, (m3/h)/kPa
Specific heat ratio for the natural gas
Inside diameter of pipeline in meters, pipeline length in Kms
Pipeline efficiency, dynamic value no larger than 1.0
Compression parasitic efficiency, 0.99 for centrifugal units
Friction factor
, , electrical inductance, electrical susceptance, line admittance matrix
, , gas flow, gas supply, gas demand at node k, m3/h
The heat rate, MJ/MW h
Jacobian matrix
Constant of compressor
Lower heating value MJ/ m3
pB gas pressure at base condition, kPa
Active power generated of bus i, active power demand of bus , MW
Reactive power generated of bus , reactive power demand of bus , MVar
Hydraulic resistance coefficient of the pipeline, kPa/ (m3/h2)
Suction temperature of compressor,
Gas temperature at base condition, K (273+ °C)
Average absolute temperature of pipeline, K (273 + °C)
Bus voltage, nodal admittance matrix
Resistance coefficient of pipeline, KPa2/(MW)2
Average compressibility factor
Natural gas specific gravity
Compression efficiency, energy efficiency of GPG, energy efficiency of P2G
Variables
Brake horsepower consumed by gas compressor, horsepower
Gas consumption in GPG
Gas generation in P2G, m3/h
Gas consumed by P2G system, by gas compressor
Power generated by GPG, MW
The nodal pressure at both end of pipeline, m3/h
Magnitude of voltage, angle of voltage
- G. Guandalini, S. Campanari, and M. C. Romano, “Power-to-gas plants and gas turbines for improved wind energy dispatchability: Energy and economic assessment,” Appl. Energy, vol. 147, pp. 117-130, Jun. 2015.
- S. Clegg andP. Mancarella, “Integrated modeling and assessment of the operational impact of power-to-gas (P2G) on electrical and gas transmission networks,” IEEE Trans. Sustain. Energy, 2015, vol. 6, no. 4, pp. 1234-1244, Oct. 2015.
- P. J. Hibbard and T. Schatzki, “The interdependence of electricity and natural gas: current factors and future prospects,” Electr. J., vol. 25, no. 4, pp. 6-17, May 2012.
- M. Qadrdan, J. Wu, N. Jenkins, and J. Ekanayake, “Operating strat-egies for a GB integrated gas and electricity network considering the uncertainty in wind power forecasts,” IEEE Trans. Sustain. Energy, vol. 5, no. 1, pp. 128–138, Jan. 2014.
- Z. Wei, S. Chen, G. Sun, D. Wang, Y. Sun, and H. Zang, “Probabilistic available transfer capability calculation considering static security constraints and uncertainties of electricity-gas integrated energy systems,” Appl. Energy, vol. 167, pp. 305-316, Apr. 2016.
- Z. Wei, S. Chen, G. Sun, D. Wang, Y. Sun, and H. Zang, “Probabilistic available transfer capability calculation considering static security constraints and uncertainties of electricity-gas integrated energy systems,” Appl. Energy, vol. 167, pp. 305-316, Apr. 2016.
- Yu XH, Xue YS. Smart grids: A cyber-physical systems perspective. Proc IEEE 2016; 104(5):1058–70.
- Ahlgren LW. The dual-fuel strategy: An energy transition plan. Proc IEEE 2012; 100(11):3001–52.
- Mathiesen BV, Lund H, Connolly D, Wenzel H, Østergaard PA, Möller B, et al. Smart energy systems for coherent 100% renewable energy and transport solutions. Appl Energy 2015; 145: 139–54.
- Connolly D, Lund H, Mathiesen BV, Leahy M. The first step towards a 100% renewable energy-system for Ireland. Appl Energy 2011; 88:502–7.
- Chen, S., Wei, Z., Sun, G., Cheung, K. W., & Sun, Y. (2016). Multi-linear probabilistic energy flow analysis of integrated electrical and natural-gas systems. IEEE Transactions on Power Systems, 32(3), 1970-1979.
- C. Unsihuay-Vila, J. W. Marangon-Lima, A. C. Zambroni de Souza, I. J. Perez-Arriaga, and P. P. Balestrassi, “A model to long-term, mul-tiarea, multistage, and integrated expansion planning of electricity and natural gas systems,” IEEE Trans. Power Syst., vol. 25, no. 2, pp. 1154-1168, May 2010.
- C. Correa-Posada and P. Sanchez-Martin, “Security-constrained optimal power and natural-gas flow,” IEEE Trans. Power Syst., vol. 29, no. 4, pp. 1780–1787, Jul. 2014.
- X. Xu, H. Jia, D. Wang, D. C. Yu, and H-D. Chiang, “Hierarchical energy management system for multi-source multi-product mi-crogrids,” Renew. Energy, vol. 78, pp. 621630, Jun. 2015.
- J. Qiu, Z. Dong, J. Zhao, K. Meng, F. Luo, and Y. Chen, “Expansion co-planning for shale gas integration in a combined energy market,” J. Mod. Power Syst. Clean Energy, vol. 3, no. 3, pp. 302-311, Mar. 2015.
- Erdener BC, Pambour KA, Lavin RB, Dengiz B. An integrated simulation model for analyzing electricity and gas systems. Int J Electr Power Energy Syst2014; 61:410–20.
- Mancarella P. MES (multi-energy systems): an overview of concepts and evaluation models. Energy 2014; 65:1–17.
- Ouyang M. Review on modeling and simulation of interdependent critical infrastructure systems. Reliab Eng Syst Saf 2014; 121:43–60.
- Chaudry M, Jenkins N, Strbac G. Multi-time period combined gas and electricity network optimization. Electr Power Syst Res 2008; 78:1265–79.
- Qiu J, Dong ZY, Zhao JH, Xu Y, Zheng Y, Li C, et al. Multi-stage flexible expansion co-planning under uncertainties in a combined electricity and gas market. IEEE Trans Power Syst 2015; 30:2119–29.
- Hernandez-Fajardo I, Dueñas-Osorio L. Probabilistic study of cascading failuresin complex interdependent lifeline systems. Reliab Eng Syst Saf 2013; 111: 260–72.
- Qadrdan M, Abeysekera M, Chaudry M, Wu J, Jenkins N. Role of power-to-gas in an integrated gas and electricity system in Great Britain. Int J Hydrog Energy2015; 40:5763–75.
- Grainger J, William Stevenson J. Power system analysis. New York: McGraw-Hill; 1994.
- Bagajewicz M, Valtinson G. Computation of natural gas pipeline hydraulics.Ind Eng Chem Res 2014;53:10707–20.
- Martinez-Mares A, Fuerte-Esquivel CR. A unified gas and power flow analysis in natural gas and electricity coupled networks. IEEE Trans Power Syst2012; 27:2156–66.
- Mokhatab S, Poe WA, Speight JG. Handbook of natural gas transmission and processing. Burlington (MA, USA): Gulf Publishing Company; 2006.
- Sheldrake AL. Handbook of electrical engineering: for practitioners in the oil, gas and petrochemical industry. 1st ed. Chichester (West Sussex, England); Hoboken (NJ, USA): Wiley; 2002.
- Beér JM. Highe efficiency electric power generation: the environmental role. Prog Energy Combust Sci 2007; 33:107–34.
- Shahidehpour M, Fu Y, Wiedman T. Impact of natural gas infrastructure on electric power systems. Proc IEEE 2005;93:1042 56.
- Grond L, Schulze P, Holstein J. Systems analyses power to gas: a technology review. Groningen; 2013.
- Bergen AR, Vittal V. Power systems analysis. 2nd ed. Upper Saddle River (NJ): Prentice Hall; 2000.