A Comparative Analysis of ARIMA and Feed-Forward Neural Network Prognostic Model for Bull Services
 , Cherry Lyn C. Sta. Romana 2, Larmie S. Feliscuzo 2, Ivy Fe M. Lopez 3, Cherry N. Rola 4
Adv. Sci. Technol. Eng. Syst. J. 5(2), 411–418 (2020);
 DOI: 10.25046/aj050253
Bull service is the natural copulation by a purebred male carabao with a female counterpart. This is part of the bull loan agenda of the Philippine Carabao Center-Visayas State University (PCC-VSU), one of the 12 regional centers of PCC. For the past years, PCC-VSU used averaging of bull services count of previous years and sometimes did a little tweaking of the formulas in setting annual targets. Some targets fell short in the actual accomplishment that may have led to achieving lesser animal products. There is a need for resource optimization. Resource optimization through Auto-Regressive Integrated Moving Average (ARIMA) and Artificial Neural Network (ANN) forecasting can be used in the setting of goals of future number of copulations. This study deals with the comparative assessment of ARIMA and ANN in 4-step and 12-step ahead time series forecasting of bull services. This endeavor dealt with quarterly data from 2002 to 2017. In ARIMA, the for 4-step ahead (1-year) forecasting had the data from 2002 to 2016 for training while data from 2017 was employed for testing. ARIMA 12-step ahead (3-year) forecasting had data from 2002 to 2014 for training and 2015 to 2017 for testing. The ANN 4-step ahead prediction made use of data from 2002 to 2015 for training, 2016 for validation and 2017 for testing. ANN 12-step forecasting had data from 2002 to 2011 for training, 2012 to 2014 for validation and 2015 to 2017 for testing. R studio, a tool for statistical computing was employed in the analysis. Based on the performance measures Root Mean Square Error, Mean Absolute Percent Error and Mean Absolute Error the ANN outshines the ARIMA in both 4-step and 12-step ahead forecasting. The ANN forecasting can surely help in optimizing the center’s resources. The forecasting of bull services using multivariate series is recommended.
1. Introduction
Bull service is the natural breeding by a purebred male carabao/water buffalo with a female mate. Dealing with the comparison of forecasting methods that predict bull services, this paper is an extension of the work originally presented in the 2019 International Conference on Multimedia Analysis and Pattern Recognition (MAPR) [1]. Bull service is among the services offered by the Philippine Carabao Center-Visayas State University (PCC-VSU) under the bull loan program which promotes water buffalo or carabao propagation and genomic enhancement.
PCC-VSU is among the 12 regional centers of PCC spread across the Philippine archipelago. The center is a government agency founded in 1992 through the Republic Act 7307. Other services it offers are artificial insemination (AI), buffalo semen distribution, and farmers and technicians’ training [2]. PCC-VSU is mandated to deliver these services in region 8 comprising 6 provinces namely: Biliran, Leyte, Southern Leyte, Northern Samar, Samar, and Eastern Samar.
In the past, PCC-VSU used mean computation of bull services count of recent previous years and sometimes did little adjustment of formulas in setting annual targets. Some targets would fall short in the actual accomplishment and some would go over. Achieving more than the actual is an advantage but achieving low because of the low target does not optimize the animal and human resources. Forecasting bull services can help the center in the target setting and in optimizing its resources. It may help in aiming high to accomplish more. More bull services conducted means more animal products are produced – higher income especially for small-scale animal raisers. The focal purpose of this inquiry is to explore and compare the 4-step (1 year) and 12-step ahead (3 years) time series forecasting performance of Auto-Regressive Integrated Moving Average (ARIMA) and multi-layer artificial neural network (ANN) on bull services to improve the target setting competence of the center. In [1], only a single-layer ANN was used while in this research endeavor a multi-layer ANN was employed. This analysis utilized quarterly bull services data from 2002 to 2017. R studio was utilized in the analysis. The performance of ARIMA and ANN models were tested using the following measures: Root Mean Square Error (RMSE), Mean Absolute Percent Error (MAPE), and Mean Absolute Error (MAE).
In 2015, [3] combined ARIMA with Deep Belief Net (DBN) in predicting the residual of prediction results. Experimental results showed an effective forecast. Relatively, [4] produced a model to forecast the crude matters required for plastic products based in revenue data. The short-term prediction had relatively fine accuracy.
On the other hand, [5] established a neural network model with 4 input stratum neurons, 8 hidden stratum neurons and 1 output stratum neuron that effectively forecast information security incidents. [6] established an ANN model for forecasting and optimization of solar energy potential. Another model was produced in the study of [7] for wind speed forecasting. A recurrent neural network model was designed and implemented also by [8] for repairable system failure analysis. Another by [9] produced an ANN model that successfully predicted the rainfall one-step ahead. None of these tackled bull services prognostic modeling using a multi-layer ANN. A thorough web search was performed and none has been found as well hence, the purpose of the study.
2. Method
2.1. Box-Jenkins Method or Autoregressive Integrated Moving Average (ARIMA)
Autoregressive-Moving Average (ARMA) model incorporates a broad collection of non-stationary time series. It is then simplified producing an ARIMA. With the past data, the differencing technique is utilized to enhance stationarity into the modelling. The modelling decomposes the data into an autoregressive (AR) process, integrated (I) process, and a moving average (MA) of prognostic oversight.
The purpose of the AR procedure is to take a recollection of historical events, the I procedure is responsible for easing data stationarity, hence helps in easier prediction. Forecasting is more accurate with longer past data as it learns eventually. To achieve a transformation of a non-stationary procedure into a stationary one, a random walk is employed. A procedure {yt} is articulated to observe an Integrated ARMA model, conveyed by ARIMA (p, d, q), if dyt = (1–B)d ɛt is ARMA (p, q). The prognostic model can be written as
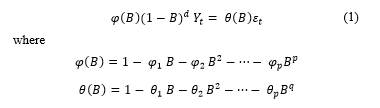 where
where
ɛt ~ WN (0, s2), WN signifying White Noise. B indicates the backshift operator (Byt = yt –1). The d is a non-negative integer that is known as the integration parameter. The ARIMA (p, d, q) model becomes an ARMA (p, q) model when d=0.
The 3 stages of ARIMA are identification, estimation and testing, and forecasting application. The constraints of the provisional chosen model at the identification part are approximated at the estimation stage while the model’s adequacy is evaluated at the estimation and testing stage. When the model is unsatisfactory, the process is repeated until a sufficient model is selected [10]. Figure 1 depicts the ARIMA or Box-Jenkins modeling phases created by [11].
The Box-Jenkins Method or ARIMA is employed to forecast the trend of bull services for the next 4-quarters and 12-quarters. Its forecasts are then compared to the ANN’s. The method that gives better prediction may help in determining the possible number of bulls and manpower that possibly maybe involve in carrying out bull services.
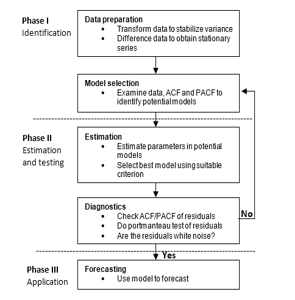 Figure 1: Box-Jenkins or ARIMA modeling approach.
2.2. Artificial Neural Network (ANN)
As great function estimators, the ANNs, commonly used in forecasting, pattern recognition, and control engineering replicate the human intellect. The Multi-Layer Perceptron (MLP) is an ANN of a feed-forward construct that is a compound layer network usually with 3 tiers namely: the input, the hidden, and the output layers. The MLP diagram, adapted from [3] is shown in Figure 2.
Each layer of the network has neurons or units. The neurons at the input layer obtain inputs from external entity and reproduce these inputs to the neurons of the hidden stratum. As the input signal components with the weights go beyond the biases, the neurons on the hidden layer can fire. A similar thing could happen among hidden and output layers. The neurons at the hidden and output layer generate function utilized logistic sigmoid depicted in (2) [3].
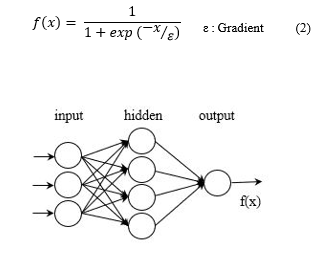 Figure 2: The structure of a multilayer perceptron.
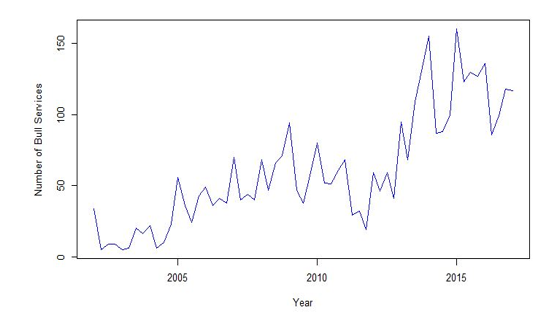 Figure 3: Time series plot of bull services (2002-2017).
2.3. Performance Evolution and Error Estimations
Some of the evaluation functions utilized in determining the success of the ARIMA method are Akaike information criterion (AIC), Bayesian information criterion (BIC), adjusted coefficient of determination (˙R ), mean absolute percent error (MAPE), root mean square error (RMSE), and mean absolute error (MAE) [11, 12]. AIC and BIC select models with more accuracy and of low error in out-of-sample forecasting. The errors of these techniques are computed by the coefficient of determination and MAPE [12, 13, 14]. The MAPE is calculated by getting the difference between predicted and actual value. The outcome of subtraction is divided by the actual value, multiplied by 100, and then divided by the number of samples [15]. RMSE presents the concentration of data near the line of best fit. Aside from forecasting, it is widely utilized in regression and climatology analyses [16]. It is employed to measure the projection error values of potential models for a specific dataset [17]. MAE, on the other hand, entails adding the magnitudes of the errors and dividing it by n [18].
3. Experimental Results
3.1. Data and Modeling Tool
Figure 3 shows the time series chart of bull services covering 2002 to 2017. In ARIMA modeling, the for 4-step ahead (1-year) forecasting had the data from 2002 to 2016 (60 samples) for training while data from 2017 was employed for testing. ARIMA 12-step ahead (3-year) forecasting had data from 2002 to 2014 (52 samples) for training and 2015 to 2017 for testing.
On the other hand, ANN 4-step ahead prediction made use of data from 2002 to 2015 (56 samples) for training, 2016 for validation and 2017 for testing. ANN 12-step forecasting had data from 2002 to 2011 (40 samples) for training, 2012 to 2014 for validation and 2015 to 2017 for testing. R studio was the statistical computing tool utilized for both ARIMA and ANN modeling.
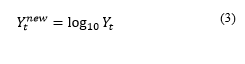
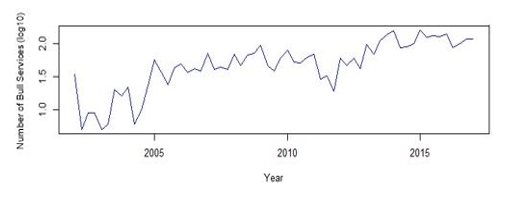 Figure 4: Logarithmic- transformation of bull services data series.
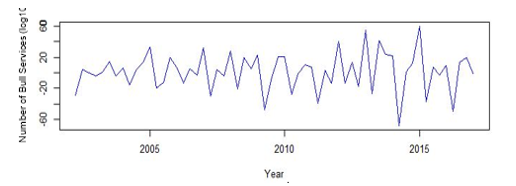 Figure 5: Differenced Bull Services Data
3.2. Preprocessing Data
The time series plot of bull services from 2002 to 2017 is shown in Figure 3. There is a growing activity inclination from the beginning to the initial quarter of 2009. During the sophomore quarter of the same year to the last quarter of 2012, a fall in the number of services can be observed. It starts to rise again in the initial quarter of the following data point. The primary quarter of 2014 is considered as its peak; however, 2014 falls again. Furthermore, the initial periods of 2005 to 2012 depicts the greatest number of bull services.
Generally, just like the other regional centers, along the years PCC-VSU may have met some challenges in the implementation of the bull services that were evident in the years 2010 to 2015 due to few significant fluctuations of data. The factors that may have affected it were the social and economic aspect of the bull loan beneficiary, willingness in adapting the process of acquiring bulls, PCC and LGU staff monitoring difficulties, political intervention in choosing recipients, and bull handlers’ expertise deficiency. These factors were manifested in the study of [19].
There was a logarithmic conversion or transformation of data as shown in Figure 4 since there was no stationarity in the methods which predict series of raw data. The process makes data stationary on variance. The log transformation equation is depicted in (3). The transformed data were used in both ARIMA and neural network forecasting.
 The data were then subjected to one-time differencing to transform its mean to stationary (on logged) (Figure 5).
3.3. ARIMA Model
For both the 4-step ahead (1-year) and 12-step ahead (3 years) bull services forecasting, the best model is ARIMA (1,1,1) (2,0,0) [4] based on AIC, BIC, and AICc. Table 1 and Table 2 presents the AICc values.
3.4. Feed-forward Neural Network Model
The suitable ANNs for both 4-step ahead and 12-step ahead bull services forecasts were chosen from various examined networks in the training stage; but, only sample results of different input parameters are presented on this paper (Table 3 and Table 4) employing the following number of epochs: 100, 500 and 1000. The learning rate used was 0.001. For shorter-term forecasting, the finest outcome was produced by the model which comprises 20 input neurons (window width), 12 hidden neurons and 4 output neurons trained for 1000 epochs (Table 3).
For longer-term forecasting, the best outcome was from the network which consists of 4 input neurons (window width), 4 hidden neurons and 12 output neurons trained for 100 epochs (Table 4). There was no overfitting that occurred in ANN modeling as the same network structures in both 4-step and 12-step ahead forecasting gave the most accurate prediction in the validation and testing stage.
Table 1: Statistical results of different ARIMA parameters for PCC-VSU bull services (4-step ahead forecast).
|
| Table 4: Statistical performance of ANN model for bull services (12-step ahead forecast; learning rate =0.001). |
|
|||||||||||||||||||||||||||||||||||||||||||||||||||||||||||||||||||||||||||||||||||||||||||||||||||||||||||||||||||||||||||||||||||
Table 3: Statistical performance of ANN model for bull services (4-step ahead forecast; learning rate =0.001).
|
|||||||||||||||||||||||||||||||||||||||||||||||||||||||||||||||||||||||||||||||||||||||||||||||||||||||||||||||||||||||
Table 2: Statistical results of different ARIMA parameters for PCC-VSU bull services (12-step ahead forecast).
|
3.5. Comparison of ARIMA and ANN Model
The comparative analysis utilized the testing datasets. In terms of performance error measures RMSE, MAPE, and MAE, the ANN model outperforms the ARIMA in both 4-quarter or 1-year bull natural mating forecasting (Table 5) although ARIMA is known as good in short-term forecasting in many cases [20]. The ARIMA model RMSE, MAPE, and MAE errors are 0.13, 6.45% and 0.12, respectively while ANN scored 0.02, 0.55% and 0.01. This clearly shows ANN to be better because its error values are smaller than the ARIMA. Figure 6 depicts a graph of ARIMA 4-step ahead forecasts while Figure 7 shows the ANN forecast (y-axis is on logged). The blue line exhibits the forecasted data and the red one represents the actual. Subscribing to the values above, forecasted data by ANN is closer to the target data than the ARIMA’s (Figure 6 and 7).
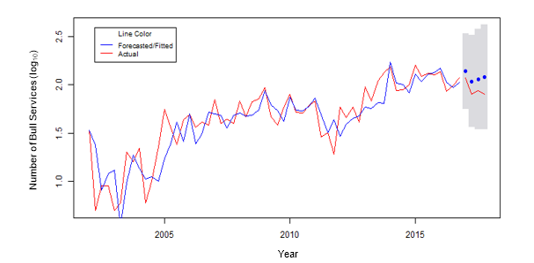 Figure 6: ARIMA 4-step ahead forecast.
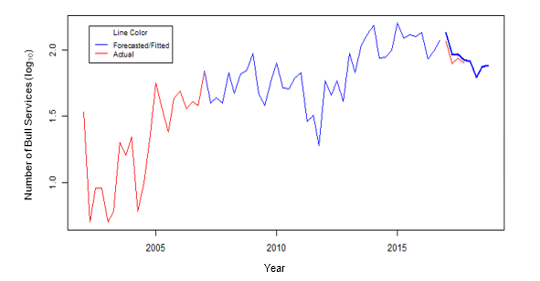 Figure 7: ANN 4-step ahead forecast.
For 12-step ahead or 3-year forecasting, ANN is still better than its counterpart. Table 6 shows the empirical outcome of ARIMA’s RMSE, MAPE, and MAE scores of 0.08, 3.31% and 0.07 while ANN scores 0.07, 2.77% and 0.06. Figure 8 portrays a graph of the ARIMA 12-step ahead forecast whereas Figure 9 (y-axis is on logged) exhibits the ANN’s. Still subscribed to the values above, forecasted data by ANN is closer to the target data than the ARIMA’s (Figure 8 and Figure 9) since ANN got smaller error values than ARIMA.
RMSE is utilized since this study analyzes different models of the same dataset [17]. Conferring to [21], both models generated good models since the models scored lower than 10% of MAPE. MAE is employed as a common performance measure for time series forecasting [17]. Generally, the results subscribe to the study of [22] and [23] that ANN is better than ARIMA in forecasting.
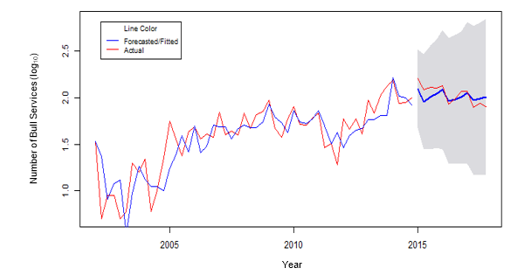 Figure 8: ARIMA 12-step ahead forecast
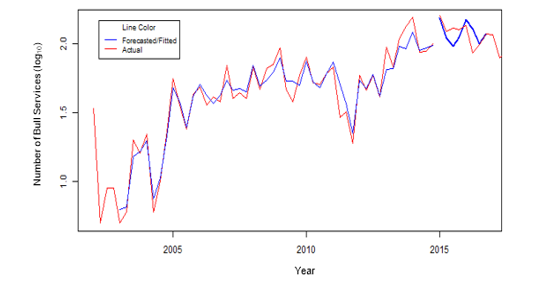 Figure 9: ANN 12-step ahead forecast.
Table 5: ARIMA and ANN model error (4-step ahead forecast).
| Method | RMSE | MAPE (%) | MAE |
| ARIMA
|
0.13 | 6.45 | 0.12 |
| Neural Network
|
0.02 | 0.55 | 0.01 |
Table 6: ARIMA and ANN model error (12-step ahead forecast).
|
4. Conclusion and Future Work
As a pioneering study in forecasting bull services, the experimental outcomes attained with data on the execution of ARIMA and ANN models in time sequence forecasting have been exhibited. The performance of the ARIMA and ANN predictive models established in this study was assessed. Though both models are showing good forecasting capability based on RMSE, MAPE, and MAE values, the ANN surpasses the traditional ARIMA in both 4-step and 12-step ahead bull natural mating forecasts. The ANN with a single hidden layer indeed can satisfactorily estimate any continuous function that agrees with theoretical corroborations. The ANN forecasting can surely help in optimizing the PCC-VSU’s resources. A prognostic modeling of bull services using multivariate series is recommended.
Conflict of Interest
The authors declare that there is no conflict of interest in laying this paper to publication.
Acknowledgment
The authors’ profound gratitude to the following individuals/ institutions: Roopam Upadhyay, Jiashen Liu, Visayas State University, Department of Computer Science and Technology-VSU, Philippine Carabao Center-VSU, Prof. Winston M. Tabada, Dr. Norberto E. Milla, and the College of Computer Studies of the Cebu Institute of Technology-University.
- J. B. Rola, C. L. C. Sta. Romana, L. S. Feliscuzo and I. F. M. Lopez, “ARIMA prognostic application to bull services for resource usage optimization,” in 2019 International Conference on Multimedia Analysis and Pattern Recognition (MAPR), Ho Chi Minh, 2019, https://doi.org/10.1109/MAPR.2019.8743539.
- PCC, “Philippine Carabao Center annual report 2018,” PCC, Muñoz, 2018.
- T. Hirata, T. Kuremoto, M. Obayashi, S. Mabu and K. Kobayashi, “Time series prediction using DBN and ARIMA,” in International Conference on Computer Application Technologies, Matsue, Japan, 2016, https://doi.org/0.1109/CCATS.2015.15.
- B. Siregar and Fahmi, “Forecasting of raw material needed for plastic products based in income data using ARIMA method,” in 5th International Conference on Electrical, Electronics and Information Engineering (ICEEIE), Malang, Indonesia, 2017, https://doi.org/10.1109/ICEEIE.2017.8328777.
- A. S. Katasev, L. Y. Emaletdinova and D. V. Kataseva, “Neural Network model for information security incident forecasting,” in International Conference on Industrial Engineering, Applications and Manufacturing (ICIEAM), Moscow, Russia, 2018, https://doi.org/10.1109/ICIEAM.2018.8728734.
- S. Leholo, P. Owolawi and K. Akindeji, “Solar energy potential forecasting and optimization using Artificial Neural Network: South Africa Case Study,” in Amity International Conference on Artificial Intelligence (AICAI), Dubai, United Arab Emirates, 2019, https://doi.org/10.1109/AICAI.2019.8701372.
- J. C. Palomares-Salas, J. G. de la Rosa, J. G. Ramiro, J. Melgar, A. Aguera and A. Moreno, “ARIMA vs. Neural Networks for wind speed forecasting,” in International Conference on Computational Intelligence for Measurement Systems and Applications (CIMSA), Hongkong, 2009, https://doi.org/10.1109/CIMSA.2009.5069932.
- S. L. Ho, M. Xie and T. N. Goh, “A comparative study of Neural Network and Box-Jenkins ARIMA modeling in time series prediction,” Comput. Ind. Eng., vol. 42, pp. 371-375, 2002.
- M. K. Aiden and K. C. Tripathi, “A Neural Network model for time series forecasting of U.P. East Rainfall,” in International Conference on Advances in Computing, Communication Control and Networking (ICACCCN2018), Greater Noida (UP), India, India, 2018, https://doi.org/10.1109/ICACCCN.2018.8748734.
- M. Kumar and M. Anand, “An application of time series ARIMA forecasting model for predicting sugarcane production In India,” St. Bus. Econ., vol. 9, no. 1, pp. 81 – 94, April 2014.
- S. Makridakis, S. C. Wheelwright and R. J. Hyndman, Forecasting: methods and applications, New York, USA: John Wiley, 2008.
- S. A. DeLurgio, Forecasting principles and applications, Boston, MA, USA: Irwin McGraw-Hill, 1998.
- R. A. Yaffee and M. McGee, Introduction to time series analysis and forecasting: with applications of SAS and SPSS, 1st edition, San Diego, London, Boston, New York, Sydney, Tokyo, Toronto: Academic Press, Inc., 2000.
- SAS Institute Inc., SAS/ETS®13.2 User’s guide, Cary, NC, USA,: SAS Institute Inc., 2014.
- M. Akpinar and N. Yumusak, “Year ahead demand forecast of city natural gas using seasonal time series methods,” Energies, vol. 9, no. 9, p. 727, 2016.
- A. Barnston, “Statistics how to,” Weather Forecast., vol. 34, no. 6, 1992, https://doi.org/10.1175/1520-0434(1992)007<0699:CATCRA>2.0.CO;2.
- R. J. Hyndman and A. B. Koehler, “Another look at measures of forecast accuracy,” Int. J. Forecasting, vol. 22, no. 4, p. 679–688, 2006, hhtps://doi.org/10.1016/j.ijforecast.2006.03.001.
- C. J. Willmott and K. Matsuura, “Advantages of the mean absolute error (MAE) over the root mean square error (RMSE) in assessing average model performance,” Clim. Res., vol. 30, pp. 79-82, 2005, https://doi.org/10.3354/cr030079.
- G. C. E. Bumanlag, M. P. Tolentino, E. D. Manlapig and E. P. Palacpac, “A case study on the implementation of the bull loan program in selected PCC regional centers,” in 2nd International Conference on Agriculture, Environment and Biological Sciences (ICAEBS-15) August 16-17, 2015, Bali, Indonesia, 2015.
- X. Li and Z. Zhang, “A time series forecasting based on ARIMA for Minqin value of output related to water resources,” in 2012 International Symposium on Geomatics for Integrated Water Resource Management, Lanzhou, 2012, https://doi.org/10.1109/GIWRM.2012.6349588.
- C. D. Lewis, “Industrial and business forecasting methods,” Butterworths, vol. 2, pp. 194-196, 1982.
- A. A. Adebiyi, A. O. Adewumi and C. K. Ayo, “Comparison of ARIMA and Artificial Neural Networks models,” J. Appl. Math., vol. 2014, 2014.
- N. Kohzadi, M. S. Boyd, B. Kermanshahi and I. Kaastra , “A comparison of artificial neural network and time series models for forecasting commodity prices,” Neurocomputing, vol. 10, pp. 169-181, 1996.