Methodology for Assessing Synchronization Conditions in Telecommunication Devices

Adv. Sci. Technol. Eng. Syst. J. 5(2), 320–327 (2020);
 DOI: 10.25046/aj050242
This paper represents analysis of principles providing maximally reliable delay estimation of signal synchronization devices in telecommunication. Clock synchronization schemes on the base of stochastic models, graph-analytic interpretation, analytical functional description and their parameters selection in case of real complex hindrance are analyzed. Dependences between dispersion of maximally reliable estimation of synchronization devices and signal to noise ratio (SNR) are represented. Analytical expressions and dependences are obtained for deviation of synchronization error with respect to SNR at the output of discriminator. Diagrams of state are formed for assessment of digital synchronization device in case of error state. Calculated error of numerical solution of the equation of a stationary grid method. We obtain the schedule of the distribution of the probability density synchronization errors for different values of the normalized time. The functions performed by the symbolic synchronization circle, features of the construction of the timing error detector (TED) are analyzed. The Gardner, Early-Late, Mueller & Muller TED, their error and the S-curve equation are investigated. The dependence of the relative timing error on the SNR is obtained. The article examines the effects of interpolation and decimation conditions in the forming filters of digital communication systems.
1. Introduction
This paper is an extension of work originally presented in conference name “Quality Assessment of Synchronization Devices in Telecommunication” that is published in 2019 IEEE 39th International Conference on Electronics and Nanotechnology (ELNANO) [1].
The proposed paper (additionally) presents experimental results for evaluating the effect of interpolation conditions and decimation for energy gain of telecommunication facilities on phase shift keying modulation, as well as comparative analysis of error detectors of symbol synchronization of coherent communication network with QPSK modulation has done.
The main purpose of the presented results is to supplement and summarize information on the specifics and nature of synchronization conditions in the means of determining the factors that qualitatively influence the factors contributing to the noise immunity of modern information processing systems [2,3]. The coherent and quasicoherent methods for signal receiving require phase locked loop (PLL) frequency as obligate component which forms the reference signal from the received oscillation [4]–[6]. To receive discrete information a system needs clock, word and frame synchronization. The important task of synchronization, which is to form reference oscillation at the receiving side of wireless connection, in most of the cases, becomes complicated due to influence of noise, which distorts the received signal, and in some cases due to random character of the signal itself [2].
Such events entail fluctuational phase deviation, which is formed by reference oscillation synchronization system. The effectiveness of data transmission lowers consequently because of losses in transmission of data required for not only synchronization but also for the signal search time and transition onto monitoring mode for all synchronization systems of the receiver. This raises the question of improving synchronization system especially in case of using in communication systems frequency, phase and quadrature methods of digital modulation [7]–[9].
Papers [4,5] represent linear and nonlinear analysis of clock synchronization devices. Probability of acquisition and probability of cycle slip are estimated. The main factors, which increase an error in increasing and decreasing reliability of system synchronization in time, are analyzed.
The represented research is conducted in progress of results published in [3]–[6]. We use various stochastic models with expanded technical interpretation of Markov’s modeling, cumulant method and method for statistic linearization. Besides, upgrading circuit structure of the manipulated signal receiver in order to optimize it by using solutions aimed at removing reverse effect, synthesis of the receiver structure with synchronization devices and defining character of signal to noise ratio influence on accuracy of synthesized clock synchronization devices are important.
The research outcome represents novelty, which consists in using stochastic model to describe synchronization error. Significance of the research consists in estimating clock transition distribution density. The criteria and algorithm is developed to provide optimal operation of synchronizer in condition of hindrance.
2. Stochastic Model of Synchronization System
2.1. Semi graphical Interpretation of Clock Synchronization Systems
In article [1], [7], a stochastic model of a synchronization system was proposed. Model of synchronization system is described by stochastic equations in accordance to the scheme Fig. 1. The following symbols are used: ξ=ξ(t) ‑ input influence, ‑ influence assessment, ‑ normalized synchronization error, ρ(γ) ‑ discriminatory characteristics, h(γ) ‑ fluctuation characteristics, n(t) ‑ Gaussian white noise, f(ε) ‑ transient pulse function of the linear dynamic element, which describes the effect of processing output signal and adjustment of the clock generator frequency Fig.1.
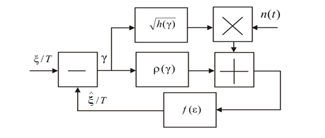 Figure 1: The research clock synchronization scheme
Assumption is made that: the influence is slow process, stable due to large amount of symbol intervals; assessment of the target influence is a slow process; normalizing random processes and fluctuation of discriminator’s output signal is the condition to be used; spectral density G(ω, γ) is assumed stable in the tract transmission frequency band G(0, γ) and fluctuation component is represented as the white noise.
The synchronization system is described as automatic control system. The input influence is represented as r(t)=U(t)+n(t). The signal is represented analogously as the following: , h(t)=1, 0≤t≤T, h(t)=0, t (0,T).
Thus, the pulses sequence is given U0 ‑ having rectangular form h(t), which represents binary character data stream , n(t) ‑ Gaussian white noise. The research is conducted in order to identify discriminatory and fluctuational characteristics. The synchronization error is specified by . The pulse sequences to identify synchronization error are represented in Fig. 2.
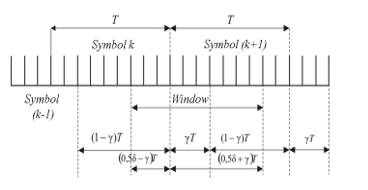 Figure 2: Pulse sequences in synchronization system
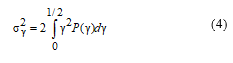
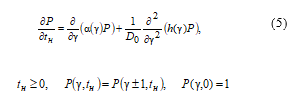
The dispersion of fluctuational error in synchronization system is to be defined using the equation of Markov’s random process, which density of probability distribution P=P (γ, t) is expressed by Fokker-Planck equation [10,11]:
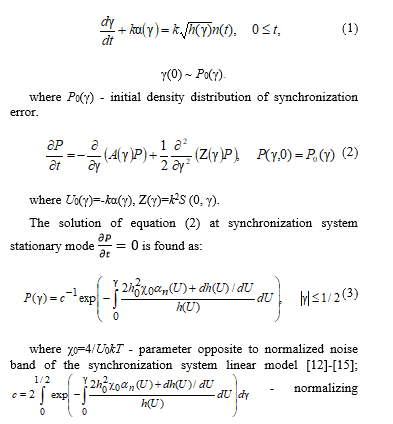 where χ0=4/U0kT – parameter opposite to normalized noise band of the synchronization system linear model [12]-[15]; – normalizing constant.
Synchronization system accuracy is assessed by dispersion of normalized synchronization error:
 The mathematical modeling will be performed and error dispersion influence will be assessed in dependence on signal to noise ratio for some values of χ0 parameter. In particular Fig. 3 demonstrates assessment carried out for δ0=δ0opt (h02).
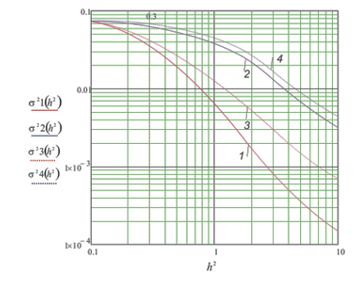 Figure 3: Graphs of dispersion error σγ2 dependence on signal to noise ratio h02: 1- χ0=100, δ0→opt; 2- χ0=25, δ0→opt; 3- χ0=100, δ0=1; χ0=25, δ0=1
The conducted research has indicated that in case of narrowing synchronization system band the dispersion of fluctuational error reduces. In Fig. 3 solid lines 1 and 2 demonstrate effect that the window width minimizes synchronization error dispersion for each value of signal to noise ratio, however lines 3 and 4 demonstrate constant width of the window.
Analysis of transition mode of synchronization system can be done with the use of numerical solving Fokker-Planck equation by grid method when distribution density of synchronization error changes. The equation (5) will be used with inserting normalized time tН=4ϖt, where ϖ=k1k2U0T/4 – noise band of linear model of synchronization system. In this case the canonic form of stochastic Fokker-Planck equation for distribution density P=P(γ, tН) can be written.
 In the research the distribution density of the initial condition will be assumed uniform, D0=2h02/ϖT – equation parameter, ΔFnor=ϖT – normalized noise band.
Stationary solution of equation (5) is used for numerical solution (2) by grid method. The essence of this method is in inserting the grid having nodes xk=x0+kξ, k=0,±1, ±2,…,±N, x0=0, ξ=1/2N, tl=t0+δl, l=0,1,2,…, τ0=0, ξ, δ ‑ grid. The grid function is represented as ħk,l=ħ(γ, tН) when γ=xk, tН=tl and differential operators are replaced with difference ones. Initial conditions are: Pk,0=1, k (0, ±N), P-N,l=PN,l, PN+1,l=P-N+1,l, P-N-1,l=PN-1,l. References testify that solution is possible to find at the new layer on conditions mentioned above [16]. The stability condition of the difference scheme is worthy to mention: δ/ξ2 < D0/2.
The equation (5) rewritten with recurrent formulas becomes:
 The error should be assessed by comparing grid functions of two types – the accurate and the numerical solutions; and by finding Δ=(ωa(φ,τ)-ωn(φ,τ)/ωa(φ,τ))·100% along the layers in nodes of selected grid.
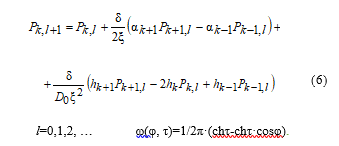
This approach will be used to assess error of clock synchronization. Fig. 4 shows transient process, Fig. 5 – dependences of numerical solution (6), and Fig. 6 represents graphs, which describe process of setting on stationary mode at error probability p0=10-3, in case of minimum shift keying (GMSK) digital modulation [1].
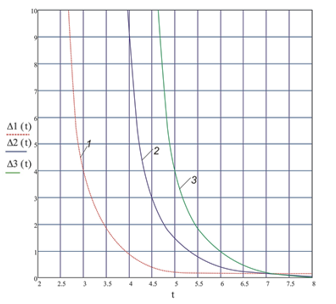 Figure 4: Graphs of transient processes tН (condition: p0=10-3); 1- ϖt=5·10-2;2- ϖt=1·10-2; 3- ϖt=1·10-3
Modeling parameters are: ΔFnor=5·10-2; ξ=0.01, δ=0.001.
The research has identified less than one percent error in numerical search of solution using grid method Fig. 5.
The research results in form of graphs which describe transient process for the value of SNR that corresponds to error probability p0=10-3 (Fig. 6) and assessed dependences of transient process duration in a system in case of deviation of current dispersion σ2current of synchronization error on its value in stationary mode σ2stationary, testify that in case of narrowing band in synchronization system, what means reducing monitoring error, the transient process time gets increased (Fig. 4).
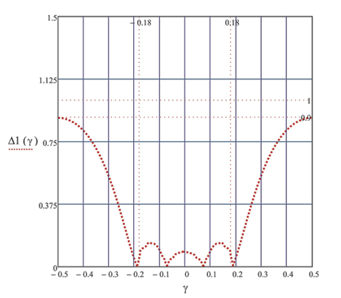 Figure 5: Numerical stationary solutions by grid method: Δ ‑ given in percent’s
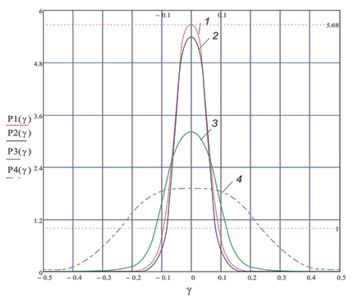 Figure 6: Graphs of density of probability distribution at different values of normalized time tН (condition: p0=10-3, ϖt=5·10-2): 1 – stationary state; 2 – tН =2; 3 – tН =1; 4 – tН =0.5
Besides, in case when the band of synchronization system changes then getting on stationary mode goes with larger number of symbols.
3. Investigation Inaccuracy of Symbol Timing Error Detector
In the modern digital communication system, the sampling rate plays an important role. High-speed signal processing can be implemented by usage of digital converters with increasing or decreasing sampling rate [17].
An important part of the digital interface used for radio frequency communication systems is the frequency converter (FC). The FC main function is to convert one or more data channels from the main band format into a radio signal consisting of modulated carriers belonging to a set of one or more mentioned radio frequencies. This is achieved in two stages: increasing the sampling rate by interpolation, providing spectrum generation and suppressing interpolation images by filtration and shifting the spectrum of the signal to the desired carrier frequencies using a multiplier and a heterodyne [18,19].
3.1. Symbol Timing Recovery Circuit
The symbol timing recovery circuit has the block diagram shown in Fig. 7. Time synchronization is performed using a PLL consisting of three main units: TED, contour filter and interpolation control [20, 21].
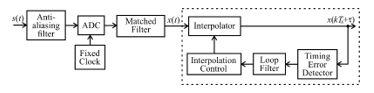 Figure 7: Structural diagram of the symbolic synchronization circle
The figure x(t) shows signal sampling after the matched filter; x(kTS+τ) is a symbolic signal adjusted for the offset of the clock signal between the transmitter and receiver.
The purpose of characters synchronization is to create N samples at the output of the matched filter for each character interval so that one of the samples is aligned with the maximum opening of the eye-diagram [7]. A sample rate of the received signal u(t) is received at a fixed rate 1/T, which is asynchronous with the rate of symbols transmission. The ADC generates samples of the input signal at a rate of N samples per symbol. The N-th count of this signal can be represented by the expression:
![]() The time delay τ is estimated by samplings x(nT) which are asynchronous samplings at the output of the matched filter. Samples are not aligned in characters. The role of symbol synchronization over time is to “move” samples to the right moments. Another name for “moving” samplings over time is interpolation [20]. Because the time synchronizer must adapt to an unknown time delay, the interpolator must be adaptive. With proper operation, the interpolator generates agreed output filter signals that are aligned across characters and optimal sampling points.
The time delay τ is estimated by samplings x(nT) which are asynchronous samplings at the output of the matched filter. Samples are not aligned in characters. The role of symbol synchronization over time is to “move” samples to the right moments. Another name for “moving” samplings over time is interpolation [20]. Because the time synchronizer must adapt to an unknown time delay, the interpolator must be adaptive. With proper operation, the interpolator generates agreed output filter signals that are aligned across characters and optimal sampling points.
The main disadvantage of the scheme shown in Fig. 7, is an interpolation jitter that occurs when Ti≠NT. In this case the result of the interpolation is displayed in average for each N sample. But on condition of Ti≠NT, the fractional timing error accumulates and as a result it reaches the value of the character length. At a time when this is happening the interpolator outputs N-1 of the samples or N+1 after the previous interpolated samples to compensate for the difference depending on the sign of the fractional timing error. This interpolation jitter is particularly problematic if the data bits need to be retransmitted synchronously to some other destination.
In general, the TED generates an error signal once for each character based on the current synchronization estimate and using the matched filter input r(nT) and the matched filter output x(nT). In other words, the discrete-time error signal is updated with a frequency of characters.
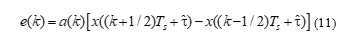
It can be supposed that there is an ideal interpolator that calculates the interpolation polynomial x(kTs+ ) using the estimation of the time delay and the output signals of the matched filter. The interpolation polynomial can be represented by the expression:
![]() where τe=τ- – is a timing error and K=Ga/T. The TED generates a signal that is a function of the timing error τe. The TED output signal e(kTs) is a function of the interpolated output signals of the matched filter and the data symbols (or their estimates). The TED characteristics are described by the S-curve g(τe).
where τe=τ- – is a timing error and K=Ga/T. The TED generates a signal that is a function of the timing error τe. The TED output signal e(kTs) is a function of the interpolated output signals of the matched filter and the data symbols (or their estimates). The TED characteristics are described by the S-curve g(τe).
Symbolic synchronization relies on a change of data sign when determining a synchronization error signal. For a QPSK modulation communication system the error signal oriented to symbol-synchronization system solution is determined by the expression:
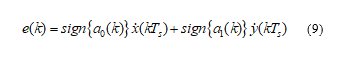 where ẋ(kTs) and ẏ(kTs) – are derivatives in time outputs of respectively common-mode and quadrature matched filters.
3.2. Error Signal Characteristics
The derivative of the correlation function of the matched filter is shown in Fig. 8.
This error signal is derived from an estimate of the maximum likelihood of synchronization bias. The operation of a derivative obtaining can be replaced by the structure of management of early-late counts for both common-mode and quadrature components.
Character synchronization according to Gardner is a non-data feedback method. The timing error detector requires at least two samples per symbol, one of which is the point where a decision can be made.
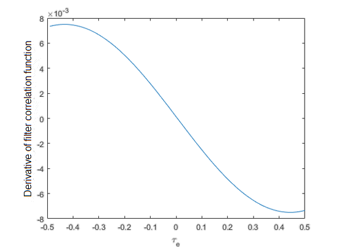 Figure 8: Derivative of autocorrelation function of spectral raised-cosine pulse type filter
The Gardner timing error detector is based on the detection of zero crossing on eye diagrams and is designed to work with BPSK and QPSK [7].
For a Gardner detector at arbitrary fixed , the synchronization error e(k) is independent of any rotation of the carrier phase [17]. The Gardner TED has an error signal defined by the expression:
 S-curve for GTED turns out by transformation e(k) through τe and calculating the desired value:
The Early-Late detector restores the phase of input character synchronization using a non-data feedback method.
The optimum moment of sampling signals coincides with the moment of maximum average eye-diagram opening. The maximum eye opening diagram occurs at a time when the average slope of the eye-diagram is zero. The nonzero slope at t=τ – are the points on the trajectory corresponding to the absence of the data sign change. Symbolic synchronization relies on data sign changes to get the correct synchronization error signal. The TED Early-Late works with 2 samples per symbol. The data-dependent detector synchronization error signal looks like:
 where Ts – is usually chosen as a value that is conveniently represented by the sampling rate.
The S-curve for TED Early-Late is obtained by calculating the expected value of the error signal:
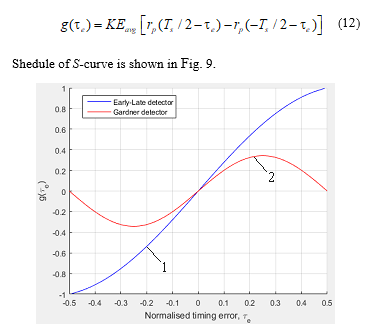 Figure 9: S-curve of detectors of timing error (1 – is a Early-Late detector; 2 – is a Gardner detector)
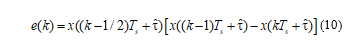
The Mueller & Muller detector implements a decision-oriented method of data-driven feedback that requires a preliminary restoration of the carrier phase [22]. The Mueller & Muller timing error detector operates on matched filter output signals generated at 1 sample per character. The symbol synchronization error signal is determined by the expression:
![]() where – is the estimation of clock delay; x(kTs+ ) – is the interpolation polynom; a(k) – is the k-th received signal symbol; Ts – is the duration of the character; τ – is the unknown time delay.
where – is the estimation of clock delay; x(kTs+ ) – is the interpolation polynom; a(k) – is the k-th received signal symbol; Ts – is the duration of the character; τ – is the unknown time delay.
The S-curve is obtained by calculating the expected value e(k) for x(kTs-τe) and x((k-1)Ts– τe. The S-curve for the detector of data-dependent synchronization error is determined by the expression:
![]() The S-curve is the slope estimation of rp(τe) using the values rp(t) of time symbol before and after -τe. Since rp(t) is an autocorrelation function, it is symmetric about τe=0. As a result, the S-curve is zero at τe=0.
The S-curve is the slope estimation of rp(τe) using the values rp(t) of time symbol before and after -τe. Since rp(t) is an autocorrelation function, it is symmetric about τe=0. As a result, the S-curve is zero at τe=0.
The dependence schedule of the relative synchronization error on the SNR for the TED of Early-Late, Gardner and Mueller & Muller is shown in Fig. 10.
So, the relative synchronization error increases when the SNR is less than 10 dB. Early-Late TED has the most uniform dependence.
When demodulating digital signals, it is desirable that the sampling rate of the signal can be multiple of its keying rate (each character must have the same number of counting’s). However, the sampling rate of the input signal from the ADC is generally fixed but the manipulation speed may change. The solution to this problem is the signal resampling.
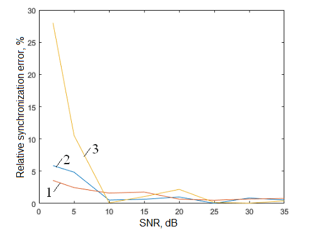 Figure 10: Dependency of relative synchronization error on the SNR for TED (1 – is the Early-Late detector; 2 – is the Gardner detector; 3 – is the Mueller & Muller detector)
4. Conditions of Interpolation and Decimation Signals
The phase modulation techniques should be used to study the effect of conditions of interpolation and decimation signals on telecommunication facilities power.
The estimation should be carried out by determining the energy gain in case of change of the coefficients of interpolation and decimation of the agreed forming filters. Recommendations should be given as to the conditions for changing the coefficients and using the symbolic synchronization system to stabilize the modes of the digital communication system when using interpolation and decimation in the forming filters.
Background information for estimating the effect of interpolation and decimation signals on the power of telecommunications facilities with phase manipulation will be presented by noise immunity graphs (BER dependence on Eb/N0) and evaluation of signal processing quality by constellation diagrams (signal constellations: Scatter Plot) [7]. It is necessary to evaluate the dependencies of the bit error rate (BER) on the SNR (Eb/N0) for the different graphs of error synchronization detector and interpolation (decimation) coefficients in the forming filters.
Fig. 11, Fig.12 and Fig.13 show the results of the study of the bit error rate (BER) on the SNR (Eb/N0) at the coefficients of interpolation and decimation (ki–d) of matched forming filters equal to 10 and 50 for different types of modulation. Simulink models of digital systems with different types of modulation and different coefficients of interpolation and decimation (ki–d) of forming filters for QPSK modulation are investigated.
To achieve BER=10-4 when using QPSK modulation and increasing the interpolation coefficient – decimation of forming filters from 2 to 50, it is necessary to increase the ratio (Eb/N0) by 14 dB. The most energy-efficient is BPSK modulation. In this case, increasing the coefficients of interpolation and decimation from 10 to 50 requires an increase in the ratio (Eb/N0) by 7 dB for BER=10-5.
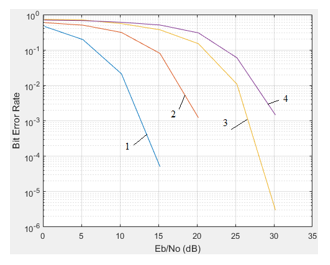 Figure 11: Noise immunity curves of communication system for QPSK modulation with interpolation and decimation coefficients (ki–d) of forming filters (1 – ki–d=2; 2 – ki–d =10; 3 – ki–d =50; 4 – ki–d =100)
The timing error detector produces an error signal e, which is related to the difference between the unknown time offset τ and the offset estimate in time space . The PLL adjusts the estimate so that it is close to the time offset τ and reduces the error signal to zero. The logarithmic likelihood ratio L is differentiated with τ to get the error signal and the equation dL/dτe which is solved by PLL. The Gardner detector and the Mueller-Muller detector are the most commonly used as a synchronization error detector.
The dependence of the bit error rate (BER) on the SNR (Eb/N0) for different timing error detector circuits and the interpolation and decimation coefficients 2 and 50 in the forming filters for QPSK modulation are shown in Fig.14 and Fig. 15.
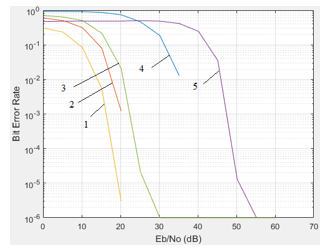 Figure 12: Noise immunity curves (Bit error rate (BER) on the SNR (Eb/N0) at ki–d=10 for modulation (1 – BPSK; 2 – QPSK; 3 – DQPSK; 4 – QAM-16; 5 – DBPSK)
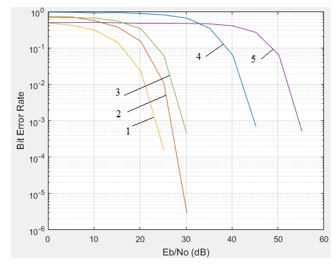 Figure 13: Noise immunity curves (Bit Error Rate (BER) on the SNR (Eb/N0) at ki–d =10 for different types of modulation (1 – BPSK; 2 – QPSK; 3 – DQPSK; 4 – QAM-16; 5 – DBPSK)
The Gardner detector has feedback that is unrelated to data and it is independent of carrier frequency recovery [23]. It is suitable for both basic bandwidth and modulated carrier systems. In the presence of noise, the effect of the resynchronizing method improves as the excess bandwidth increases (the recession rate for a spectral raised-cosine pulse type filter).
The Mueller-Muller detector has decision-making feedback that requires a prior restoration of the carrier phase. This method has no noise of its own when the input signal has Nyquist pulses (in the output of a spectral raised-cosine pulse type filter).
Fig. 16 a, b (Scatter Plot1, Scatter Plot2) presents a constellation diagram showing the signal constellation before and after the symbolic synchronization circle and showing the effect of the synchronization error on the transmitted constellation [7], [24].
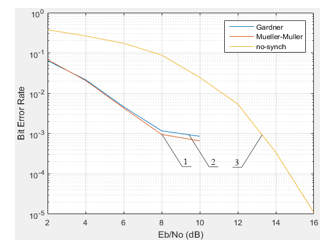 Figure 14: Noise immunity curves of communication system with QPSK modulation and ki–d = 2 (1 – is a Mueller & Muller detector; 2 – is a Gardner detector; 3 – is the absence of symbol synchronization)
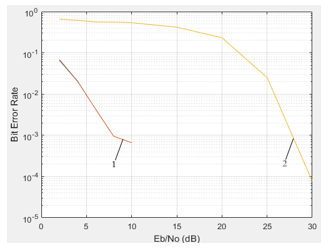 Figure 15: Noise immunity curves of communication system with QPSK modulation and ki–d=50 (1 – is a Gardner detector; 2 – is the absence of symbol synchronization)
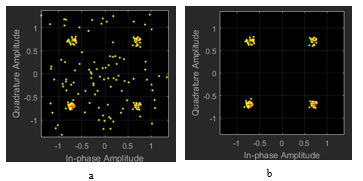 Figure 16: Constellation diagrams (a – Scatter Plot1; b – Scatter Plot2)
In the presence of noise, the output of the Mueller-Muller method improves as the excess pulse width ratio decreases and it is good for narrowband communication systems. The symbol synchronizer unit corrects the asymmetry of the clock pulses and restores the frame synchronization of the QPSK system, which has a variable synchronization error [25,26]. For a signal to noise ratio of 20 dB, the resulting bit error rate is less than 10-3, indicating that the signal is being restored.
5. Conclusions
Paper represents obtained analytical and graphical research that bonds influence of SNR and accuracy of clock synchronization device on condition of their equal noise bands defined that at the level of σ2γ=10-3. The benefit proposed methodology for of clock synchronization device makes almost 2.7 dB.
Studies of Mueller & Muller, Gardner, Early-Late timing error detectors have been performed. As the SNR decreases, there is an increase of the synchronization error. The Mueller & Muller detector has a 20% greater synchronization error than the Gardner and Early-Late detectors with a 2 dB SNR. The Early-Late detector has a larger S-curve, the most uniform dependence of the relative synchronization error on the SNR, which decreases from 4% to 1% with increasing SNR from 2 dB to 35 dB.
To achieve BER =10-4 when using QPSK modulation and increasing the interpolation-decimation coefficient of forming filters from 2 to 50, it is necessary to increase the ratio (Eb/N0) for 14 dB. The most energy-efficient is BPSK modulation. In this case, increasing the coefficients of interpolation and decimation from 10 to 50 requires an increase in the ratio (Eb/N0) by 7 dB for BER=10-5.
To achieve the bit error rate BER=10-3 when using symbolic synchronization, it is possible to reduce the SNR of synchronization for the interpolation and decimation coefficient of the forming filters equal to 2. When the interpolation and decimation coefficient of forming filters increases up to 50, the SNR at the receiver input reduces to 20 dB. Thus, the introduction of a symbolic synchronization system helps to stabilize the operation of the digital communication system when using interpolation and decimation in forming filters.
- J. Boiko, O. Eromenko, I. Kovtun, S. Petrashchuk, “Quality Assessment of Synchronization Devices in Telecommunication,” in 2019 IEEE 39th International Conference on Electronics and Nanotechnology (ELNANO), Kyiv, Ukraine, 2019. https://doi.org/10.1109/elnano.2019.8783438.
- A. I. Semenko, N. I. Bokla, M. Y. Kushnir, G. V. Kosovan, “Features of creating based on chaos pseudo-random sequences,” in 2018 14th International Conference on Advanced Trends in Radioelecrtronics, Telecommunications and Computer Engineering (TCSET), Slavske, Ukraine, 2018. https://doi.org/10.1109/tcset.2018.8336383.
- W. Wei, Z. Hongen, C. Suzhi, “Error Analysis and Correction of Time-Frequency Synchronization Based on Packet Switching,” in 2017 International Conference on Dependable Systems and Their Applications (DSA), Beijing, China, 2017. https://doi.org/10.1109/dsa.2017.40.
- D.R. Stephens, Phase-Locked Loops for Wireless Communications, Springer, 2002.
- F. Brandonisio, M.P. Kennedy, Noise-Shaping All-Digital Phase-Locked Loops, Springer, 2014.
- S. Huang, S. Liu, M. Liu, J. Hu, Z. Zhu, “Low-Noise Fractional-N PLL With a High-Precision Phase Control in the Phase Synchronization of Multichips,” IEEE Microwave and Wireless Components Letters, 28(8), 702-704, 2018. https://doi.org/10.1109/lmwc.2018.2842680.
- J. Boiko, V. Tolubko, O. Barabash, O. Eromenko, Y. Havrylko, “Signal processing with frequency and phase shift keying modulation in telecommunications,” Telkomnika (Telecommunication Computing Electronics and Control), 17(4), 2025-2038, 2019. http://dx.doi.org/10.12928/telkomnika.v17i4.12168.
- A. Rai, V. N. Kumar, “Wideband acquisition technique for QPSK demodulator,” in 2016 IEEE International Conference on Recent Trends in Electronics, Information & Communication Technology (RTEICT), Bangalore, India, 2016. https://doi.org/10.1109/rteict.2016.7807869.
- L. Zhang, Z. He, “A modified timing synchronization algorithm for QPSK in digital receiver,” in 2011 2nd International Conference on Artificial Intelligence, Management Science and Electronic Commerce (AIMSEC), Dengleng, China, 2011. https://doi.org/10.1109/aimsec.2011.6011207.
- P. Bondalapati, W. Namgoong, “Timing Jitter Distribution and Power Spectral Density of a Second-Order Bang–Bang Digital PLL With Transport Delay Using Fokker–Planck Equations,” IEEE Trans. on Very Large Scale Integration (VLSI) Syst., 27(2), 398 –406, 2019. https://doi.org/10.1109/tvlsi.2018.2878665.
- W. Zhang, “An Analytical Solution of the Fokker-Planck Equation in the Phase-Locked Loop Transient Analysis,” IEEE Trans. on Communications, 35(7), 773 – 775, 1987. https://doi.org/10.1109/tcom.1987.1096849.
- G. Hui, B. Chenghao, Z. Hongjun, L. Fanghui, L. Lei, “Synchronization Error Estimation of High-speed AD Sampling Based on Digital Phase Discrimination,” in 2018 Cross Strait Quad-Regional Radio Science and Wireless Technology Conference (CSQRWC), Xuzhou, China, 2018. https://doi.org/10.1109/csqrwc.2018.8455461.
- H. Li, Z. Wang, H. Wang, “Research and implementation of high speed parallel carrier synchronization algorithm,” in 2017 IEEE 9th International Conference on Communication Software and Networks (ICCSN), Guangzhou, China, 2017. https://doi.org/10.1109/iccsn.2017.8230073.
- F. Shaikh, B. Joseph, “Simulation of synchronous reference frame PLL for grid synchronization using Simulink,” in 2017 International Conference on Advances in Computing, Communication and Control (ICAC3), Mumbai, India, 2017. https://doi.org/10.1109/icac3.2017.8318790.
- I. Park, I. Jang, W. Jung, S. Kim, “Noise immunity modeling and analysis of delay-locked loop,” in 2015 IEEE 19th Workshop on Signal and Power Integrity (SPI), Berlin, Germany, 2015. https://doi.org/10.1109/sapiw.2015.7237401.
- C. Zhang, X. Zhao, X. Wang, X Chai, Zhang Z, X. Guo, “A Grid Synchronization PLL Method Based on Mixed Second- and Third-Order Generalized Integrator for DC Offset Elimination and Frequency Adaptability,” IEEE Journal of Emerging and Selected Topics in Power Electronics, 6(3), 1517 – 1526, 2018. https://doi.org/10.1109/jestpe.2018.2810499.
- Q. Chen, M. Li, “Modified Gardner algorithm for bit synchronization in high-order QAM system,” in 2013 International Conference on Computational Problem-Solving (ICCP), Jiuzhai, China, 2013. https://doi.org/10.1109/iccps.2013.6893575.
- T. Chang, K. Lee, G. Chen, S. Chiu, J. Yang, “Super resolution using trilateral filter regression interpolation,” in 2017 IEEE 2nd International Conference on Signal and Image Processing (ICSIP), Singapore, Singapore, 2017. https://doi.org/10.1109/siprocess.2017.8124511.
- J. Boiko, I. Kovtun, S. Petrashchuk, “Productivity of telecommunication systems with modified signal-code constructions,” in 2017 4th International Scientific-Practical Conference Problems of Infocommunications. Science and Technology (PIC S&T), Kharkov, Ukraine, 2017. https://doi.org/10.1109/infocommst.2017.8246374.
- W. Chen, M. Huang, X. Lou, “Sparse FIR Filter Design Based on Interpolation Technique,” in 2018 IEEE 23rd International Conference on Digital Signal Processing (DSP), Shanghai, China, 2018. https://doi.org/10.1109/icdsp.2018.8631685.
- S.K. Mitra, A. Mahalonobis, T. Saramaki, “A generalized structural subband decomposition of FIR filters and its application in efficient FIR filter design and implementation,” IEEE Trans. on Circuits and Systems II: Analog and Digital Signal Processing, 40(6), 363-374, 1993. https://doi.org/10.1109/82.277881.
- K. M. Whelan, F. Balado, N. J. Hurley, G. C. M. Silvestre, “A Two-Dimensional Extension of the Mueller and Müller Timing Error Detector,” IEEE Signal Processing Letters, 14(7), 457-460, 2007. https://doi.org/10.1109/lsp.2006.891321.
- P. Harati, A. Dyskin, I. Kallfass, “Analog Carrier Recovery for Broadband Wireless Communication Links,” in 2018 48th European Microwave Conference (EuMC), Madrid, Spain, 2018. https://doi.org/10.1109/eumc.2018.85.
- C. C. Cheng, S. Hikmet, S. Sezginer, Yu T. Su, “Enhanced Spatial Modulation With Multiple Signal Constellations,” IEEE Trans. on Communications, 63(6), 2237 –2248, 2015. https://doi.org/10.1109/tcomm.2015.2422306.
- A. Wadhwa, U. Madhow, “Near-Coherent QPSK Performance With Coarse Phase Quantization: A Feedback-Based Architecture for Joint Phase/Frequency Synchronization and Demodulation,” IEEE Trans. on Signal Processing, 64(17), 4432 –4443, 2016. https://doi.org/10.1109/tsp.2016.2568169.
- I.R. Parhomey, J.M. Boiko, O.I. Eromenko, “Features of digital signal processing in the information control systems of multipositional radar,” Journal of Achievements in Materials and Manufacturing Engineering, 2(77), 75-84, 2016. https://doi.org/10.5604/17348412.1230101.