
Implementing an AGV System to Transport Finished Goods to the Warehouse
Volume 5, Issue 2, Page No 241-247, 2020
Author’s Name: Nuno Correia1, Leonor Teixeira2,a), Ana Luísa Ramos3
View Affiliations
1Department of Economics, Management, Industrial Engineering and Tourism, University of Aveiro, 3010-193 Aveiro, Portugal
2Institute of Electronics and Informatics Engineering of Aveiro / Research Unit on Governance, Competitiveness and Public Policies, Department of Economics, Management, Industrial Engineering and Tourism, University of Aveiro, 3010-193 Aveiro, Portugal
3Research Unit on Governance, Competitiveness and Public Policies, Department of Economics, Management, Industrial Engineering and Tourism, University of Aveiro, 3010-193 Aveiro, Portugal
a)Author to whom correspondence should be addressed. E-mail: lteixeira@ua.pt
Adv. Sci. Technol. Eng. Syst. J. 5(2), 241-247 (2020); ![]() DOI: 10.25046/aj050231
DOI: 10.25046/aj050231
Keywords: Automated guided vehicle (AGV), Automotive industry, Productivity, Waste

Export Citations
This work describes a case study carried out in an automotive company. The main objective was to increase the productivity of the last workstation of an assembly line by implementing an AGV System to transport finished goods to the warehouse. A comprehensive analysis of Value Added and Non-Value Added activities were performed to understand the current state of the workstation. By using the Spaghetti Diagram, the worker’s movements were mapped and quantified. To eliminate motion and material transport and therefore increase productivity, an AGV system was implemented. To design this particular system, it was necessary to determine the required number of AGVs and their capacity, picking and delivery locations and the flow path. Activities such as transporting the containers and moving around to pick up the same containers were eliminated, thus contributing to a better ergonomics and an increase in safety. The Cycle Time was also reduced and therefore productivity was increased.
Received: 01 January 2020, Accepted: 22 February 2020, Published Online: 20 March 2020
1. Introduction
Due to the organizations’ desire to grow and scale up their business, the global marketplace has become highly competitive. This leads organizations to enter on a crusade of continuous improvement to guarantee sustained customer satisfaction and to level up competitiveness with other organizations [1].
Customers thinking is changing. They have become more demanding for cutting-edge products and services at a lower price and that can be delivered to them in the shortest period possible [2]–[4].
To satisfy the customer on these demands, a new management philosophy emerged – Lean Manufacturing, whose primary goal is the maximization of value for the customer by eliminating production wastes [5]. Nowadays, companies focus on reducing waste and Non-Value Added activities. One of the examples is the internal movement of materials. By improving this aspect, it is possible to improve the distribution and manufacturing flows efficiency [6]. One way of improving the internal material handling and reduce Non-Value Added activities is by implementing Automated Guided Vehicle (AGV) Systems. An AGV is a driverless transport system that is used to move all types of materials in an automated way. With these systems, it is possible to fully automate material flows between several departments. The design of an AGV system involves many concerns. The main ones are guided-path design, estimation of a number of vehicles required, vehicle scheduling, idle-vehicle positioning, battery management, and vehicle routing and deadlock resolution [7].
This paper describes the work that was carried out in an automotive company that produces car components and assembles gearboxes. Its main goal was to improve the productivity of the last assembly line workstation, through the reduction of wastes by implementing an AGV system. To accomplish this objective several aspects were studied. First, the Value Added (VA) and Non-Value Added (NVA) activities were mapped and the wastes in the workstation were highlighted and quantified. To implement the AGV system it was necessary to determine: (i) the required number of AGVs and their capacity, (ii) picking and delivery locations, (iii) flow paths and (iv) speeds in different sections.
This paper is organized as follows: the current section makes a brief introduction to the project as well as to its objectives and methodology. The second section presents a literature review on Lean Manufacturing and Automated Guided Vehicle systems. In the third section, it is presented the case study and in the fourth and last section, it is described the main conclusions of the work.
2. Literature Review
2.1. Lean Manufacturing
It all started with the introduction of Toyota Production System (TPS) [8]. TPS target was to remove any kind of waste and inconsistency in the production system. Its foundations are Just-In-Time (JIT) and Jidoka [9]. JIT aims to produce only what is necessary and only when requested [10]. Jidoka is the ability to stop production the moment a defect is detected.
Lean manufacturing philosophy focuses on customer value maximization through the elimination of production wastes [11]. This philosophy has a set of tools for eliminating waste, optimizing workflow, reducing cost and improving quality [12]. Examples of these tools are one-piece flow, standardized work, inventory management, cellular manufacturing, poke yoke, workplace organization, synchronous manufacturing, kaizen and scrap reduction waste [13].
The lean concept applies to almost all industries [14]. Some industry examples are chemical, aerospace, electronics and services [15]–[17].
Muda is the Japanese word for waste. If an activity does not add value to a product is considered waste. By consuming time and resources, it makes the product more expensive [18]. In a manufacturing context, three types of operation are undertaken according to [19], namely, (i) Non-Value Adding (NVA); (ii) Necessary but Non-Value Adding (NNVA); (iii) Value-Adding (VA). NVA activities are pure waste and they should be eliminated. NNVA operations are wasteful but they are necessary for the process itself. VA operations are related to the conversion or processing of an item in any stage of the process, adding value to the product.
2.2. Eight Wastes
The seven wastes in an industrial environment that were identified by [8] are inventory, defects, motion, over-processing, overproduction, transportation and waiting periods. Overproduction is considered the most serious waste because it triggers the other six types of waste. This leads to additional transportation, excessive handling, an increase in stock levels, more waiting time and so on. Recently an additional waste was identified by [20], which is people’s talent. For an efficient flow of goods or services, these wastes should be minimized.
2.3. Spaghetti Diagram
A spaghetti diagram is a visual tool that shows materials and people flow during a process, inside a factory, being these flows represented by lines. According to [21] it gives a full picture in the identification of the following problems:
- Cross-traffic – Paths that have intersection will cause congestion and delays;
- Backtracking – Material moving backward, in the opposite way of normal flow;
- Distance traveled – Distance traveled by materials and people in the plant;
- Procedure – understand if the sequence of operations is the most suitable one or the equipment placement is the right one.
The purpose of these diagrams is to find solutions on how to shorten the distances traveled by people and materials.
In a manufacturing environment, there are flows from different domains. The seven flows of lean manufacturing are the flow of raw material, the flow of work-in-progress, the flow of finished goods, the flow of machines, the flow of operators, the flow of engineering and the flow of information [22]. The mapping of the flows mentioned above allows us to understand how people and materials interact to add value to the product [23].
2.4. Automated Guided Vehicle (AGV)
AGVs are driverless vehicles that run on the plant floor which have the capacity of carrying loads. These are designed to perform their operations without direct human guidance and are used in a wide variety of industrial applications [24]. To achieve the benefit of integrated automation, they are interfaced with other automated systems [25]. AGV systems have been frequently used as material handling equipment in the manufacturing context [26] and it represents the most versatile means of moving materials automatically [25]. Firstly, AGVs provide automated loading, transportation, and unloading capabilities. Therefore, there are several applications where AGVs can be used, such as manufacturing plants, container terminals, material handling systems, warehouses and service industries [27]. They are being integrated in these systems because they provide a wide range of benefits in economic, environmental and social sustainability dimensions [28]–[30], including labor cost savings [31], increased productivity [32], enhanced safety [33], reduced emissions [34] and energy consumption [35].
AGVs are versatile enough to transport more than one load at the same time. A load refers to a number of items arranged in such a way (ordered or not) that they can be transported as a single object. A container or a pallet are some examples of a unit load [36]. By transporting multiple loads, the number of vehicles needed may reduce and throughput of a system may increase. Additional loads may be picked up while transporting a previously assigned load. The benefit of using multi-load vehicles includes a reduction in the number of vehicles’ empty trip time and total distance traveled [7].
An AGV system must be built to satisfy a specific need and suited to different situations. When designing an AGV system, several factors should be considered, such as, the available budget, the quantities to be moved, the goods to be handled, the distance travel and the type of production system that the AGV will serve [25]. According to [37], the following tactical and operational issues have to be addressed in designing an AGV system:
- Flow path layout – Flow path can be unidirectional and bidirectional. A flow is unidirectional when vehicles travel in only one direction. When vehicles travel in both directions the flow is bidirectional. However, in a bidirectional flow, vehicles cannot travel in opposite directions at the same time.
- Traffic management: prediction and avoidance of collisions and deadlocks number and location of pick-up and delivery points – For safety and collision-free travel, sensors are attached to AGVs. Another method is splitting the shop floor into control zones. By doing this, only one vehicle at the same time is allowed to travel through the control zone. Consequently, at any given time, a zone is occupied by only one vehicle while others are waiting for that zone to be free.
The choice of the location of pick-up and delivery points is important. It influences the operational performance. The goal is to reduce the distance traveled and waiting times of loads avoiding bottlenecks at pick-up and delivery points. This factor is even more important when large AGV systems are displayed.
- Vehicle requirements – The number of vehicles heavily influences the performance of AGV systems [37]. To ensure that the system runs smoothly without any problems, enough vehicles should be available. However, due to economic, congestion and space availability reasons, the number of vehicles should not be overestimated.
- Vehicle dispatching – Dispatching rules should be used when selecting vehicles for transportation, by selecting the most favorable one for a good performance.
- Vehicle routing and scheduling – if an AGV is allocated to one task a route and schedule should be planned. A route indicates the path which should be taken by the AGV when making a pick-up or delivery. The related schedule gives arrival and departure times of the AGV at each segment, pick-up and delivery point, and intersection during the route to ensure collision-free routing.
- The positioning of idle vehicles – the location of idle vehicles should be defined so the waiting times of loads for transport are low. By assuring this, AGVs will respond quickly when they are requested.
- Battery management – batteries are used as a fueling system. Like any other battery, it needs to be charged or changed at a given time. The charging or changing time should not be forgotten because it impacts system performance (vehicles required, throughput, congestion, and costs).
- Failure management – when few AGVs are used, the probability of congestion will be low, and its occurrence will be unnoticed on the system performance When there are a lot of AGVs being used, failures’ probability will be higher. These failures might cause congestion and deadlocks in the system.
3. Case Study
The company involved in this case study produces components for car motors and also gearboxes. More specifically, the project was at the gearbox assembly line. The main goal is to improve the productivity of the last assembly line workstation (workstation Y) by reducing NVA activities such as movements and transportation. With this in mind, an AGV system was implemented to transport empty containers from the warehouse and then full containers from the assembly line’s last station to the warehouse.
3.1. Workstation Y
It is at workstation Y where the final details are applied to the product. Once this is accomplished, the finished products are scanned and stored in a container in batches of eight or twelve (Operation 1). These are the sizes of the available containers. Then they are transported by an assembly line worker to the production leaving the area (Operation 2). Even though the containers have wheels, the weight of a full container ranges between 420kg to 600kg and the worker has to move them between 50 to 75 times during a shift. After this, the worker is responsible for putting an empty container in his workstation (Operation 3 and 4). This operation flow can be seen in Figure 1, as well as the Spaghetti Diagram reflecting the worker’s movements.
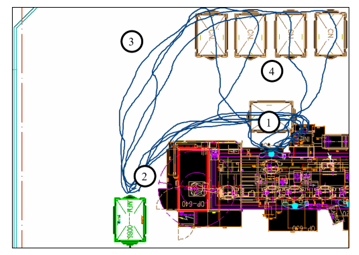 Figure 1: Workstation Y before AGV implementation with the corresponding Spaghetti Diagram.
Then a logistic operator comes, hitch all the available containers and transport them to the warehouse. There he unhitches the containers and put them into shelves with a fork lifter.
Each activity performed by the worker was defined as VA or an NVA activity, as proposed by [38]. Figure 2 depicts an analysis of VA and NVA of the production activity in the analysis. Most of the NVA is the result of excessive motion and containers transport by the assembly line worker. These activities must be reduced because they do not add value.
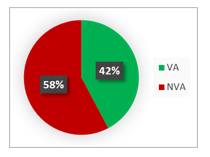 Figure 2: VA and NVA analysis before AGV implementation.
Looking at the ergonomics dimension this workstation is also critical because of the repeated movement of heavyweights executed by the worker. This can lead to health issues and the probability of occurring an accident is bigger. After identifying the wastes, they were quantified as shown in Table 1. Traveled distance and time spent moving the empty and full containers for a single round trip were measured.
Table 1: Movement Analysis for a round trip of the worker
| Container size = 8 | Container size = 12 | |
| Distance (meters) | 35 | 35 |
| Time (seconds) | 40 | 60 |
| Weight (kg) | 420 | 600 |
Besides all the waste identified, the gap between cycle time and desired Takt Time was too close. The Takt Time was 45.50 seconds and the workstation cycle time was 45.51 seconds. The time spent on moving the containers is included in the cycle time because it is part of the standard operating procedure even though it is only happening after 8 or 12 products. By reducing the wastes identified, the cycle time may be improved.
3.2. Automated Guided Vehicle System
The first step is to find what suitable type of AGV is required. In this particular case, the most suitable type is a towing vehicle because the unit of transport is a container and probably there is a need to move more than one container at a time. The AGV will be used as a top speed of 40 meters/minute and has the capacity to carry a 3000 kg load. It is fitted with a 12-hour autonomy battery. For the guidance system, the AGV has a RFID (Radio Frequency Identification) reader that will scan RFID tags attached to the floor. These tags give indication such as increase/decrease speed, order to stop/move, increase/decrease safety sensor and to activate and deactivate AGV traffic lights for traffic management.
The second step is to define where the pick-up and delivery station are located. These two stations should be close to one another. The pick-up station is the last assembly line workstation that was presented above. The delivery station is a specific spot at the warehouse adapted to receive AGVs. Thirdly, it is important to design an efficient flow path to minimize vehicle travel times and traveled distance. A flow path was designed with the production and logistics team. These two factors can heavily influence the number of AGVs required. After the location of the pick-up and delivery stations and the flow-path are determined, it is time to find the number of AGVs necessary for the proper functioning of this system.
According to [25], the total number of vehicles in simple systems can be estimated by the number of round-trips that each vehicle can make per hour and the total number of round-trips that must be made by the system. In this model effects of acceleration and deceleration are ignored. Data such as average speed, distance traveled and load and unload times are necessary. Therefore, the time required to complete one complete lap is given by (1):
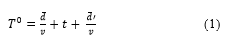 Where, = loaded distance travelled, = average speed, = loading and unloading time, = unloaded distance travelled.
To calculate the number of round-trips (one complete lap) that can be executed by one AGV, it is assumed that is given in minutes and the traffic factor is expressed as a decimal fraction. Typical values of traffic factor for an AGV system range between 0.85 and 1.0 [39]. Instead of calculating the round-trips necessary per hour, the formula was adapted to calculate the required number of round-trips during a shift. This was important for the management because it was easier to understand the system requirements and what could be done to improve it.
![]() Where = available time and = traffic factor.
Where = available time and = traffic factor.
This is a simple system with only one guided path and there are no rules for routing yet. So the number of required AGVs is given by (3):
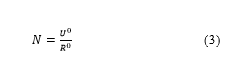 Where = number of round-trips required.
To test all the possible scenarios, an Excel sheet was created where it is possible to input data such as average speed, distances traveled, production level, AGV capacity, shift length, load and unload times. Note that the loading and unloading times were estimated according to the present process. There is an example of this sheet in Figure 3.
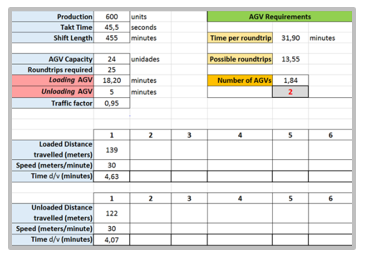 Figure 3: Excel Sheet to calculate AGVs number.
Table 2: Number of AGVs required.
| Variables | Capacity | |||||
| Container Size = 8 | Container Size = 12 | |||||
| 8 | 16 | 24 | 12 | 24 | 36 | |
| Number of Containers | 1 | 2 | 3 | 1 | 2 | 3 |
| Time per round-trip (minutes) | 19,77 | 25,83 | 31,90 | 22,80 | 31,90 | 41,00 |
| Possible Round-trips | 21,87 | 16,73 | 13,55 | 18,96 | 13,55 | 10,54 |
| Round-trips required | 75 | 38 | 25 | 50 | 25 | 17 |
| Number of AGVs | 3,43 | 2,27 | 1,84 | 2,64 | 1,84 | 1.61 |
The number of round-trips required is related to the assembly line productivity and the AGV capacity. In Table 2, it is possible to see the calculations’ results based on Figure’s 3 calculation sheet. If the number of AGVs is too small, the assembly line may stop due to the lack of containers but if the number of AGVs is too big, it may overload the system and it will be a large investment without necessity.
The AGV capacity must not exceed three containers due to the factory layout. If the number of containers is higher than three, in some corners, there is a chance of clashing with each other and therefore product quality may be affected. In addition, it is even possible that they cross-areas reserved for people’s movements, increasing the chance of an accident. According to Table 2, and considering arguments above, the optimal number of AGVs for this system is two.
Even though two AGVs are enough for this system, some prevention actions were made. For example, if a round trip takes more time than expected for some reason, the AGV may not arrive in time at the Workstation Y. Then the worker from this station does not have a container to store the gearbox and therefore the assembly line may stop. To prevent this situation, an extra container was placed near this workstation. If an AGV does not arrive in time, the worker can store the gearbox in this container and when the AGV arrives, he can replace the containers.
4. Results
To validate the model and confirm that the estimation of the number of AGVs was correct, some data were collected to compare the estimated values and the real values. After the AGV implementation, round trip and unloading time were measured. These are the real values and the same formula was used. The main purpose was to validate this method.
The data collected was slightly different from what was estimated. Despite these differences, the calculations with new data reveal that the number of AGVs required is still the same (Table 3). This confirms that the formula used is suitable for this kind of system.
Table 3: Data before and after the AGV implementation for a shift.
| Estimated Values | Real Values | Δ | |
| Unloading AGV (minutes) | 5 | 4.22 | -0.78 |
| Average Loaded travel Time (minutes) | 4.63 | 5.08 | +0.45 |
| Average Unloaded travel Time (minutes) | 4.07 | 4.99 | +0.92 |
| Number of AGVs | 1.84 | 1.88 | +0.04 |
After the AGV implementation, several improvements have been recorded. The main goal was to reduce the Non-Value activities such as motion and materials’ transports from workstation Y to the warehouse.
The improvements depend on the type of container used at the moment. If the container size is 8, the worker has to move more containers, therefore, increasing the distance traveled. All the container manipulations were eliminated. Now the worker of the workstation Y never leaves its station. He only focuses on finishing the product and put it in the container. Only body rotation is needed, as can be seen in the Spaghetti Diagram in Figure 4. Therefore, he no longer has to transport the heavy containers, improving this station from an ergonomics dimension and his well-being. Many efforts to do his job were eliminated. The results of the AGV implementation for a shift are summarized in Table 4.
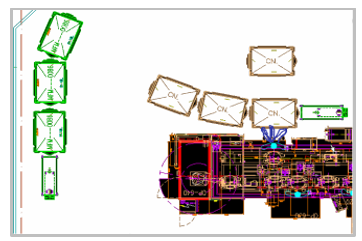 Figure 4: Workstation Y after AGV implementation with the corresponding Spaghetti Diagram.
All of the improvements contributed to Non-Value added activities reduction, something that Lean Manufacturing aims for. As mentioned above all the distance traveled transporting the containers by the worker was eliminated. Therefore, the percentage of Non-Value added activities declined. The remaining Non-Value added activities are validation and control activities that are essential for the process as shown in Figure 5.
Table 4: Data before and after the AGV implementation for a shift.
| Wastes identified at Workstation Y | Container Size = 8 | Container Size = 12 | ||
| Before | After | Before | After | |
| Containers manipulations | 150 | 0 | 100 | 0 |
| Loads transported (tonnes) | 39 | 0 | 36 | 0 |
| Distance traveled (kilometers) | 2,6 | 0 | 1,75 | 0 |
| Time spent moving (minutes) | 50 | 0 | 50 | 0 |
 Figure 5: VA and NVA analysis after AGV implementation.
The time that was spent moving the containers as part of the cycle time. By eliminating this, the cycle time was improved and all the variability associated with the container transport. The cycle time is now 39.57 seconds. This represents an improvement of 13%. This workstation is now under the Takt time desired and therefore is able to produce the quantities desired in the available time.
It was also possible to eliminate a logistics worker and a convenient means of transport (logistic train) from the production area. This worker now is located at the unloading area and is responsible for placing the full containers on the shelves from the two assembly lines existing in the factory. Activities such as hitching and unhitching the containers do not exist anymore because they are attached to the AGV. The workplace is now more organized because there is no need for an excessive number of containers laying around.
5. Conclusions
The company wants to automate materials flows inside the factory to achieve a flexible system and to eliminate waste in operations that involve transporting material from one point to another. Its ultimate goal is to remove all the fork lifters and others mean of transport that requires humans, in the production area, increasing not only flexibility but also safety.
Number of AGVs required, the proper AGV speed, active and inactive AGV positioning, AGV capacity, load and unload locations, and tasks linked to electronic tags to giver orders to the AGVs, had to be determined. All these features needed to be determined so that the assembly line never stopped.
With the implementation of the AGV system, it was possible to eliminate the transport of heavy loads by the operator and the excess of containers at the workstation, thus contributing to better ergonomics, an increase of safety and greater productivity. The worker has stopped manipulating containers between 100 and 150 times during a shift. In a full shift, this represents: (i) between 36 and 39 tons of material is not transported anymore by the worker, (ii) by not transporting this material, the worker stops walking between 1.75 and 2.6 kilometers and (iii) the time-traveling was reduced in 50 minutes. Being an automatic system and with security features incorporated, the probability of happening any accident between people and vehicles also was reduced and consequently safety improved. The risk of having damaged pieces during transport was also minimized. Having these systems means having the right product, at the right quantity, at the right time, and the right location, reducing stock at the assembly line. This led to a full synchronization between logistics and production regarding gearboxes.
In the short term, it may be an expensive system, but when integrated with other applications it may be worthwhile because then it is possible to have a fully flexible system that can be changed easily saving money and time.
For a future project and to integrate all processes between production and logistics, an AGV system at unloading finished product at the warehouse should be designed, using AGV Fork lifters. In the way, it would be possible a full integration from the beginning of production until the storage at the warehouse. Another topic that should be addressed is how to maintain the RFID in good shape (like preventive maintenance), to minimize AGV stops, due to non-reading or incorrect reading from its RFID reader. In addition, a simulation study is being developed to analyze the operational performance of the entire system to improve it continuously. This study incorporates AGV failures to test some scenarios regarding the system’s robustness.
Conflict of Interest
The authors declare no conflict of interest.
Acknowledgment
This work was financially supported by Institute of Electronics and Informatics Engineering of Aveiro funded by National Funds through FCT – Foundation for Science and Technology, in the context of the project UIDB/00127/2020; and by the research unit on Governance, Competitiveness and Public Policy (project POCI-01-0145-FEDER-008540), funded by FEDER funds through COMPETE 2020 and by national funds through FCT – Foundation for Science and Technology.
- J. Singh, V. Rastogi, R. Sharma, “Implementation of 5S practices: A review.” Uncertain Supply Chain Management 2 (3): 155–162, 2014. https://doi.org/10.5267/j.uscm.2014.5.002
- R. J. Tersine, J. G. Wacker, “Customer-aligned Inventory Strategies: Agility Maxims.” International Journal of Agile Management Systems 2 (2): 114–120, 2000. https:/doi.org/10.1108/14654650010337122
- H.C.W. Lau, B. Jiang, F. T. S. Chan, R. W. L. Ip, “An Innovative Scheme for Product and Process Design.” Journal of Materials Processing Technology 123 (1): 85–92, 2002. https://doi.org/10.1016/S0924-0136(02)00068-7
- G. T. S. Ho, H. C. W. Lau, C. K. M. Lee, A. W. H. Ip, “An Intelligent Forward Quality Enhancement System to Achieve Product Customization.” Industrial Management and Data Systems 105 (3): 384–406, 2005. https:/doi.org/ 10.1108/02635570510590174
- I. Belekoukias, J. Garza-Reyes, V. Kumar, “The Impact of Lean Methods and Tools on the Operational Performance of Manufacturing Organizations.” International Journal of Production Research 52 (18): 5346–5366, 2014. https://doi.org/10.1080/00207543.2014.903348
- J. Tompkins, J. White, Y. Bozer, J. Tanchoco, Facilities planning. 3rd ed. USA: Hamilton Printing Company, 2003.
- T. Le-Anh, M.B.M. De Koster, 2006. “A review of design and control of automated guided vehicle systems.” European Journal of Operational Research 171 (1): 1–23, 2006. https://doi.org/10.1016/j.ejor.2005.01.036
- T. Ohno, The Toyota Production System: Beyond Large-scale Production. Portland, OR: Productivity Press, 1988.
- J.K. Liker, The Toyota Way: 14 Management Principles from the World’s Greatest Manufacturer. New York: McGraw-Hill, 2004.
- S. Tiwari, R. Dubey, N. Tripathi, “The Journey of Lean.” Indian Journal of Commerce and Management Studies 2 (2): 200–208, 2011. https://doi.org/ 10.17010/pijom/2016/v9i9/101509
- J. Womack, D.T. Jones, Lean Thinking: Banish Waste and Create Wealth in Your Corporation. New York: Free Press, 2003.
- H.D. Koning, J.P.S. Verver, J.V.D. Heuvel, S. Bisgaard, R.J.M.M. Does, “Lean six sigma in healthcare.” Journal for Healthcare Quality 28 (2): 4–11, 2006. https://doi.org/10.1111/j.1945-1474.2006.tb00596.x
- R.S. Russell, B.W. Taylor, Operations Management. 2nd ed. Upper Saddle River, NJ: Prentice-Hall, 1999.
- V. Crute, Y. Ward, S. Brown, A. Graves, “Implementing Lean in Aerospace – Challenging the Assumptions and Understanding the Challenges.” Technovation 23 (12): 917–928, 2003. https://doi.org/10.1016/S0166-4972(03)00081-6
- D. Bowen, W. Youngdahl, “Lean Service: In Defense of a Production Line Approach.” International Journal of Service Industry Management 9 (3): 207–225, 1998. https://doi.org/10.1108/09564239810223510
- P. Atkinson, “Creating and Implementing Lean Strategies.” Management Services 48 (2): 18–33, 2004.
- F. Abdi, S. Shavarini, S. Hoseini, “Glean Lean: How to Use Lean Approach in Services Industries?” Journal of Services Research 6 (Special Issue): 191–206, 2006.
- J.C. Chen, L. Ye, B. D. Shady, “From Value Stream Mapping toward a Lean/Sigma Continuous Improvement Process: An Industrial Case Study.” International Journal of Production Research 48 (4): 1069–1086, 2010. https:/doi.org/10.1080/00207540802484911
- Y. Monden, Toyota Production System: An Integrated Approach to Just-in-Time. 2nd ed. Norcross, GA: Industrial Engineering and Management Press, 1993.
- J. K. Liker, D. Meier, The Toyota Way Fieldbook: A Practical Guide for Implementing Toyota’s 4Ps. New York, London: McGraw-Hill, 2006.
- F. E. Meyers, J. R. Stewart, Motion and Time Study for Lean Manufacturing. 3rd ed. Upper Saddle River, NJ: Prentice-Hall, 2002.
- J.R. Black, The Toyota Way to Healthcare Excellence: Increase Efficiency and Improve Quality with Lean. Chicago, IL: Health Administration Press, 2008.
- K. J. Hayes, N. Reed, A. Fitzgerald, V. Watt, “Applying lean flows in pathology laboratory remodelling.” Journal of Health Organization and Management 28 (2): 229-246, 2014. https://doi.org/10.1108/JHOM-03-2013-0064
- R. Pandey, A. Singh, “Utilization of AGVs and Machines in FMS Environment.” Journal of Material Sciences & Engineering. 5 (4): 263, 2016. https://doi.org/10.4172/2169-0022.1000263
- O. R. Ilić, “Analysis of the number of automated guided vehicles required in flexible manufacturing systems.” The International Journal of Advanced Manufacturing Technology 9 (6): 382–389, 1994. https://doi.org/ 10.1007/BF01748483
- S.E. Kesen, Ö. F. Baykoç, “Simulation of automated guided vehicle (AGV) systems based on just-in-time (JIT) philosophy in a job-shop environment.” Simulation Modelling Practice and Theory. 15 (3): 272–284, 2007. https://doi.org/10.1016/j.simpat.2006.11.002
- H. Fazlollahtabar, M. Saidi-Mehrabad, J. Balakrishnan, “Mathematical optimization for earliness/tardiness minimization in a multiple automated guided vehicle manufacturing system via integrated heuristic algorithms.” Robotics and Autonomous Systems 72: 131-138, 2015. https://doi.org/10.1016/j.robot.2015.05.002
- R.C. Craig, S.R. Dale, “A framework of sustainable supply chain management: moving toward new theory.” International Journal of Physical Distribution & Logistics Management 38 (5): 360-387, 2008. https://doi.org/ 10.1108/09600030810882816
- M. Kannegiesser, H.-O Günther, N. Autenrieb, “The time-to-sustainability optimization strategy for sustainable supply network design.” Journal of Cleaner Production 108: 1-13, 2015. https://doi.org/10.1016/j.jclepro.2015.06.030
- H. Wu, K. Lv, L. Liang, H. Hu, “Measuring Performance of Sustainable Manufacturing with Recyclable Wastes: a Case from China’s Iron and Steel Industry”. Omega, 2016.
- A. Gosavi, S.E. Grasman, “Simulation-based optimization for determining AGV capacity in a manufacturing system.” In: Proceedings of the Institute of Industrial Engineers Research Conference, Miami, FL: 574-578, 2009.
- A. Negahban, J.S. Smith, “Simulation for manufacturing system design and operation: literature review and analysis.” Journal of Manufacturing Systems 33: 241-261, 2014. https://doi.org/10.1016/j.jmsy.2013.12.007
- V.G. Duffy, F.F. Wu, P.P.W. Ng, “Development of an Internet virtual layout system for improving workplace safety.” Computers in Industry 50: 207-230, 2003. https://doi.org/10.1016/S0166-3615(02)00121-5
- H. Geerlings, R. Van Duin, “A new method for assessing CO2-emissions from container terminals: a promising approach applied in Rotterdam.” Journal of Cleaner Production 19: 657-666, 2011. https://doi.org/10.1016/j.jclepro.2010.10.012
- M. Acciaro, G. Wilmsmeier, “Energy efficiency in maritime logistics chains. Research in Transportation Business & Management 17: 1-7, 2015. https://doi.org/10.1016/j.rtbm.2015.11.002.
- I. F. Vis, “Survey of research in the design and control of automated guided vehicles.” European Journal of Operation Research. 170: 677-709, 2006. https://doi.org/10.1016/j.ejor.2004.09.020
- J.R. Van der Meer, “Operational control of internal transport system.” PhD thesis, Erasmus University, Rotterdam, 2000
- B.H. Maskell, “Performance Measurement for World Class Manufacturing.” Cambridge, MA: Productivity Press, 1991.
- K.R. Fitzgeral, “How to estimate the number of AGVs you need.” Modern Materials Handling: 79, 1985.