Enhancing an SDN Architecture with DoS Attack Detection Mechanisms
 , Jacir Luiz Bordim, Eduardo Adilo Pelinson Alchieri
Adv. Sci. Technol. Eng. Syst. J. 5(2), 215–224 (2020);
 DOI: 10.25046/aj050228
A Software Defined Network (SDN) architecture is characterized by decoupling the data plane and control plane. This feature enables the establishment of a programmable environ- ment in which the control plane acts under the data plane, managing and configuring the network over a standard protocol, such as OpenFlow. Although there are numerous benefits to the SDN architecture, security is still a matter of concern, as the decoupling expands the attack surface on the network. Denial of service (DoS) attacks is one of the major challenges for the SDN architecture, mainly due to the vulnerabilities existing between the control and data planes. This paper proposes an enhancement to the SDN architecture enhanced with DoS attack detection mechanisms. Two techniques have been evaluated to identify of DoS attacks: entropy and chi-square. Both techniques use OpenFlow switches statistics so that it is possible to distinguish benign traffic from spurious traffic. Experimental results show that entropy and chi-square present similar results in terms of spurious flow detection accuracy. However, on average, chi-square requires about 14.89% fewer packets to detect the attack when compared to entropy.
1. Introduction
Software Defined Networks (SDN) is an upcoming network architecture that provides a more simplified and flexible way to manage a network. One of the main aspects of a SDN network is decoupling the data plane from the control plane. When this architecture is employed, the control plane is responsible for managing the entire network through operational decisions, coordinating and adding new functionalities. While the data plane is classified as the network infrastructure and its tasks are routing, dropping packets on the network, as well as transmitting information regarding packets to the control plane The communication between the two planes (control and data plane) is carried out through a protocol. The most widely used protocol is OpenFlow, which is characterized as a generic method of communication between the controller (control plane) and switches (data plane) [1]. Despite the numerous benefits provided by an SDN architecture, network security is still a matter of concern [2]. Decoupling the two planes presents new challenges to network security, since in conventional networks, security mechanisms are often defined through a combination of configurations between both planes [3].
Denial of Service (DoS) attacks are one of the major challenges for a SDN network, mainly due to the vulnerabilities present in the communication between the two planes [4]. In this architecture, the ing capacity or reduce the bandwidth of an application, which is usually accomplished by generating large volumes of traffic through multiple hosts with spoofed addresses [5].
DoS attack detection has been broadly researched in traditional networks, where most of the proposed works employ knowledgebased methods, as can be seen in [6, 7, 8]. However, the use of statistical methods or machine learning also proves to be effective for detecting a DoS attack. Such methods are commonly used in the literature to identify deviations in traffic behavior patterns, presenting high accuracy for this purpose. In [9], for example, the authors suggested a scheme based on machine learning to detect DoS attacks in conventional networks, where they propose a neural network designed to classify legitimate from spurious traffic.
In contrast to the aforementioned works, this article proposes a DoS attack detection mechanism in SDN. In addition, this paper proposes an enhancement to the SDN architecture with a mechanism that works alongside the controller to detect DoS attacks. Two techniques are evaluated to detect DoS attacks: entropy [10] and chi-square [11]. In the OpenFlow protocol, the controller can collect information about the switches to calculate statistics. These values are used to differentiate spurious traffic from legitimate traffic. The main contributions of this paper are a mechanism that allows the definition of an adaptive detection threshold that may reflect optimal network behavior and the use of different OpenFlow protocol proposed mechanism encompasses the following characteristics:
- the implementation resides at the control plane SDN, allowing it to obtain data from the whole network with greater precision, instead of a specific switch as used in a conventional network;
- development of a mechanism to detect DoS attacks using OpenFlow switches statistics, thus enabling the use of different OpenFlow protocol header fields to characterize DoS traffic.
Experimental evaluation of the proposed solutions indicates that the entropy-based mechanism is slightly more accurate in identifying spurious flow at the cost of requiring a larger number of packets to detect attack compared to the chi-square-based mechanism.
The remainder of this paper is structured as follows. Section 2 introduces the SDN concepts. Section 3 presents how SDN DoS attacks work and how chi-square-based and entropy-based attack detection mechanisms work. Section 4 presents the anomaly detection techniques (entropy and chi-square) and how they can be used to detect DoS attacks. In Section 5 presents a brief overview of the related works. Section 6 introduces the proposed detection method applied to an SDN. Finally, Section 7 presents the simulation results, followed by the conclusion in Section 8.
2. Software Defined Networks and OpenFlow
The OpenFlow protocol is known as one of the first standards for Software Defined Networks (SDN), it enables communication between data planes and switch. It also allows the management of the query table used by the hardware to specify the next step of each received packet. There is a logical division between the data and control layers (a.k.a. planes), which establishes a programmable environment [1]. The planes that make up the SDN architecture are depicted in Figure 1.
The application layer consists of SDN applications for highlevel management of network resources and support of the control layer below. The north interface is used for establishing the communication between the application layer and the control layer [12]. The control layer is in charge of programming and managing the data plane. It is composed of controllers that use the data obtained by the data layer and establishes all the procedures and actions to be performed by the network infrastructure [13].
The infrastructure layer (data plane) is made up of forwarding devices (switches and routers). This layer is responsible for local information monitoring and statistical collection [1]. The south interface is responsible for the communication between data layer and controller [14]. The best-known interface is the OpenFlow protocol, which allows the controller to observe the flow table of the switches, in order to implement actions through a standardized interface.
The protocol architecture is composed of: (i) OpenFlow switches that form the data plane; (ii) the control plane, which includes one or more controllers; and (iii) a secure communication channel, which links the switches to the control layer. An OpenFlow switch consists of a flow table and a secure communication channel. The flow table is formed by a set of input flows in which each input has an associated behavior, such as discarding, forwarding and sending the packet to the controller. This table is formed by actions, rules and counters. The rules are constituted from one or more header fields and correlated to a set of actions, which specify how the packets will be processed. The counters store statistics for switch flows, such as bytes received and transmitted, number of packets and the elapsed time since the flow was inserted into the switch. This feature allows the collection of statistics that can be used for specific purposes, such as detecting network anomalies, estimating the delay and so on. The collection of statistics can be achieved with a flow or a group of flows. The secure communication channel is the path used to transport information between the controller and the switch and vice versa [15].
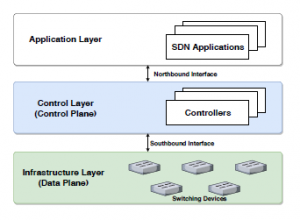
Figure 1: SDN architecture.
The packets processed by the OpenFlow switch are compared with the flow table and if a corresponding entry is found, the respective action will be taken. Otherwise, the packet will be forwarded to the control layer through the secure communication channel and the switch will wait for instructions from the controller. When receiving a packet, the controller performs the action that was previously established in its configuration for this type of flow. For example, remove or add new information from the flow table and apply the rule to the switches.
3. Denial of Service in SDN
A denial of service (DoS) attack on an SDN network can target both the data plane and the control plane [4]. These attacks are often known for generating excessive amounts of malicious traffic over a short period of time, in order to exhaust the resources of a victim or an infrastructure. DoS attacks are characterized by a high volume of traffic that floods the network, reducing or preventing a victim from being accessed [5]. In the data plane, this attack can deplete the flow table entries of the switches, through false streams generated by the attacker using the same source address [4]. In the control plane, the attack can cause a bottleneck in the communication channel between the controller and the switch [4]. In this situation, the attacker can exhaust the controller’s processing efficiency by forwarding packets with different headers that do not correspond to any flow already defined in the switch. This will force the switch to send control packets to the controller, since there is no rule to forward that malicious packet. DoS attacks can be even more complex when they are orchestrated in a distributed way and are known as Distributed Denial of Service (DDoS) attacks. These attacks can be even more detrimental to the network, while also increasing the complexity and the cost to defend the victim.
DoS attacks can be classified into two main groups: volumetric attacks and non-volumetric attacks (low volume or low rate) [16]. The latter covers attacks in which specific vulnerabilities of the communication protocol are exploited, causing the exhaustion of some of the victim’s resources. The former, on the other hand, includes attacks where large volumes of traffic flood the victim. It aims to exhaust the victim’s processing capacity or bandwidth preventing legitimate requests to reach the victim. Volumetric attacks can be further divided into direct and reflexive attacks. Direct attacks send traffic directly to the victim while reflection attacks use intermediate hosts (reflectors) to flood the victim. In this work, we restrict to SYN Flood-type attacks, characterized as a direct-volumetric attack.
The SYN Flood attack is based on sending a large number of
TCP connection requests to the server, the SYN segments are sent with different source addresses, that are usually spoofed. For each SYN sent, the server must respond with a SYN-ACK segment, waiting for a confirmation message (ACK) to configure the connection. Since the source address of the SYN packet is usually false, the
ACK response will never arrive because the SYN-ACK was sent to a nonexistent address. Causing TCP connections to remain in a semi-open state (SYN-RECV), where the memory resources are not released. With a large volume of false SYN segments sent, the server’s TCP connection queue is flooded, causing the server to eventually crash. This, in turn results in a state in which the server cannot respond to any requests from TCP clients [17].
4. Anomaly Detection Techniques
Anomaly detection techniques help in identifying patterns outside the expected behavior. They can be performed through collection, filtering, and data processing.
Detection mechanisms play a key role in the DoS attack detection scenario. Beitollahi et al. [18] classifies the detection mechanisms based on the algorithm used for the detection. According to this classification, there are four groups: (i) statistical techniques; (ii) wavelets analysis; (iii) point of sequential change; and (iv) machine learning techniques. In statistical techniques, the profile of normal traffic flow is provided by the header information in the packet, which is then compared to the spurious traffic. Wavelet analysis techniques describe an input signal in terms of spectral components, which are representations of amplitudes or intensities. At the point of sequential change, filtered traffic is treated as a time series, i.e. a collection of observations made sequentially over time. Detection of a change in time is provided by evaluating all past data, where one must distinguish between two processes states: out of control or under control. Finally, machine learning techniques are capable of transforming data into intelligent actions, allowing decision-making to be performed automatically. This work focuses on statistical techniques.
Statistical techniques analyze various properties of specific fields in packet headers during normal traffic conditions. Then, by using statistical properties, the system creates a reference model for normal traffic. When the statistical properties calculated for the traffic show differences from the reference model, it is possible to observe traffic conditions that could indicate an attack. This kind of technique uses two basic components for detection: an observation window and a detection threshold. The size of the observation window can be based on the length of time or the number of packets to be analyzed. The threshold is used to capture variations that go beyond predetermined limits. Some statistical methods, such as chi-square and entropy, can report such type of information [6] [19].
4.1 Chi-square (a.k.a. χ2)
Chi-square is a measure that portrays the difference between two probability distributions. The basic principle of this method is to compare proportions, that is, the possible divergences between the frequencies observed and expected for a certain event [20]. The equation is defined as follows:
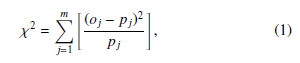
where m is the total number of occurrences observed in a window wi, oj is the observed frequency for each class and pj is the expected frequency for that class. When the frequencies observed are very close to the expected value, the chi-square value is small. Otherwise, chi-square will assume high values.
4.2 Entropy
Shannon entropy [10] is a well-known and valuable concept in information theory. It measures the probability of an event occurring concerning the total number of events, through which it is possible to describe the degree of dispersion or concentration of a distribution. The equation is defined as follows:
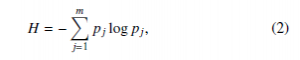
where m is the number of different occurrences in an observation window wi and pj is the probability associated with each occurrence j in the window. In other words, pj is the occurrence frequency of every single item divided by the total number of items. The result of this calculation varies between 0 and logm [21]. Higher values indicates more disperse data in the distribution. Lower value indicates maximum concentration in the distribution. In other words, if the entropy is low then the randomness of the distribution is also low and vice versa.
5. Related Works
Research on the use of statistical methods to detect DoS attacks has grown over the years [20]. Statistical methods such as chi-square and entropy are great representatives of this class, as they present excellent results for this purpose in traditional networks [22], [23], [7], [21].
One of the major problems with using such detection mechanisms in traditional networks is that each edge switch has only local network traffic, so it is not possible to have a global network scanning scenario. Therefore there is no mechanism that can provide a network overview. Such a limitation can make it difficult to detect an attack when it is distributed throughout the network. In addition, there is a relatively high cost of deploying the detection mechanism on each edge device that make up the network, which may become unfeasible depending on the infrastructure.
In the SDN context, there are some works that proposed the use of statistical analysis to evaluate possible changes in traffic from a DoS attack. In [24], the authors suggested a detection mechanism that uses data plane entropy from a programmable switch. The authors in [25] proposed the use of entropy in the control plane, taking advantage of the controller overview to detect traffic changes that may characterize the DoS attack. Although the mentioned works use entropy, they do not present the volume of packets necessary for the detection of the attack and other methods are not explored in the presented proposals.
This work proposes a solution for detecting DoS attacks in SDN that takes advantage of the controller’s network traffic knowledge. That is, unlike traditional network approaches where each switch implements local strategies, we take advantage of the controller overview to detect anomalies. To be more specific, this paper implements and evaluates statistical DoS detection mechanisms, entropy and chi-square, which are incorporated at the controller. The details of the proposed solution are presented and evaluated in the subsequent sections.
6. Proposed solution to detect DoS attacks in SDN
In the SDN architecture, traffic flow monitoring and the execution of pre-established actions are performed by the control plane. The controller operates with the OpenFlow switches, exchanging information and statistical data via specific communication channels [3]. This data includes the number of bytes, the number of packets and the elapsed time that the flow was established on the switch. These can be forwarded to the controller in an organized way, through a timer, which requests the current set of data from the switch for a group of flows or a certain flow. All input streams are managed by flow tables in the switch. If a stream is not configured in its flow table, the switch sends an asynchronous message named packet in to the controller. Otherwise, the stream follows the behavior determined by its flow table. This message is sent whenever there is no corresponding flow entry in the switch flow table. Thus, the controller will add a flow rule or eliminate flows from the flow table. The use of spurious IP addresses is common in DoS attacks. In the course of an SYN Flood DoS attack, all spoofed source IP addresses target the victim’s IP. In an SDN, there will be no entries in the flow tables for spoofed addresses, so the spurious flows will be forwarded to the controller via packet in. If the packet rate is too high, such as in a DoS attack, the controller’s resources will start to run out. In this situation, a high rate of spoofed addresses can overload the controller. The consequence of this will be the flooding of the communication channel between the data and the control plane, making it impossible for legitimate streams to be routed to their destination. Considering that it is possible to identify a new stream in the network and that during a DoS attack, this stream will have non-standard characteristics of the normal traffic. Then it is possible to measure this divergence through techniques that detect anomalies like chi-square and entropy. These techniques can identify changes in traffic that can be characterized as a DoS attack.
To develop the DoS attack detection mechanism using statistical analysis techniques it is necessary to define four components: observed field, observation window, statistical method, and the detection threshold.
6.1 Observed field
The available packet header fields to be analyzed include source IP address, destination IP address, source port, destination port, packet size, and etc. It is possible to extract packet header information at runtime. Each strategy should define the field to be analyzed that allows characterizing spurious traffic from legitimate traffic during a denial of service attack.
6.2 Observation window
The observation window corresponds to the number of packets
(window size L) that will be analyzed by the mechanism. Within each observation window wi, the frequency at which the field to be observed appears is computed in O(L2) time. The probability of occurrence of the fields of interest is measured as follows: oj
![]()
where oj,(1 ≤ j ≤ L) is defined as the frequency of the observed fields in wi, |wi| = L is the number of packets in wi and pj is the probability of occurrence of the field observed in wi.
6.3 Statistical method
The statistical method consists in applying one of the methods defined by the mechanism, chi-square (Equation 1) or entropy (Equation 2), defined as δ, from the observed frequency (o1 …oj) and the probability of occurrence of the field (p1 … pj) in the window (wi). The calculated values are stored in a list containing the previously calculated values. These values will serve as the basis for setting the detection threshold.
6.4 Detection threshold
The detection threshold Twi defines the sensitivity of the proposed mechanism. The calculation of the threshold is given as:
![]()
where Twi represents the current value of the applied anomaly method calculated, Tw−1 represents the estimated value in the previous window (wi−1) without attack and α is the smoothing coefficient. The coefficient α assumes values (0 ≤ α ≤ 1), then that the closer to 1, the greater the weight applied to recent information and the closer to 0 the greater the weight applied to past information. In this way, the threshold can be adjusted according to the characteristics of the network to reduce the incidence of false alarms.
6.5 DoS Attack Detection Mechanism
Based on the components above, this work presents a new statistical DoS attack detection mechanism for an SDN architecture. Note that, unlike other works presented in the literature, the proposed strategy can adjust the DoS detection threshold limits at runtime. The proposal is presented in Algorithm 1.
Algorithm 1 DoS Attack Detection Mechanism
| Input: Tw1, L, α
1: i ← 2 2: attack ← “false” 3: while true do 4: wi ← {} |
|
| 5: | while |wi| ≤ L do |
| 6: | f ← extract the observed field from packet in |
| 7: | wi ← wi ∪ { f } |
| 8: | end while |
| 9: | Compute oj and pj ∀ j ∈ wi |
| 10: | δ ← StatisticalMethodResult(wi) |
| 11: | if !attack then |
| 12: | Twi ← Twi α + (1 − α)Twi−1 |
| 13: | end if |
| 14: | if δ > Twi then |
| 15: | attack ← “true” |
| 16: | else |
| 17: | attack ← “false” |
| 18: | i ← i + 1 |
| 19: end if
20: end while |
|
Initially, the controller receives as input the initial threshold value (Tw1), window size (L) and smoothing coefficient (α). It is assumed that in the first window there is no attack and that the first threshold (Tw1) has already been calculated (lines 1 – 2). The controller starts a loop that always keeps analyzing all packet in’s (line 3). As packets enter the OpenFlow controller input queue, the controller start window as empty (line 4) and then extracts the field to be parsed by the proposed detection engine (lines 5 – 8). The parsed field corresponds to a predefined field from the available header fields in the packets. The observation window wi is composed of these fields until they reach a predetermined size.
In this article, we employ sizes of 20, 60, and 100 packets parsed for the source IP address field, as we will see in Section 7. When the observation window is filled, that is, when |wi| = L, the observed frequency (o1 …oj) and the probability of occurrence (p1 … pj), for all fields in the window (wi), as calculated in (line 9). With all observed frequency values and all calculated probabilities, it is possible to perform the statistical analysis defined for the detection mechanism (chi-square or entropy) in wi, where δ is defined (line
10). If the variable denoting the attack is set to false (line 11), then the window threshold (Twi ) is updated. If the value of the statistical method is above the threshold (δ > Twi )[1] the DoS attack is detected (lines 14 – 16), otherwise, it will be considered as legitimate traffic (attack = “false”), increments i and the loop runs again.
6.6 Complexity Analysis
The time complexity of the proposed solution is analyzed as follows. To calculate the frequency of the observed field, it is necessary to analyze the entire observation window, of size m, for each element, so its time complexity is O(m2). To calculate chi-square or entropy it is necessary to calculate the number of distinct occurrences in the window. So in the worst case, we have window size m, thus O(m). Thus, overall, the total time complexity of window detection analysis is O(m2).
7. Experiments
In order to evaluate the proposed architecture, we implemented the proposed detection model and analyzed its performance. The following sections present the experimental environment, the methodology, the metrics considered in our analysis and the results observed in the experiments.
7.1. Experimental Setup and Methodology
The experiments were performed using Mininet as an emulator of an SDN architecture [26]. In Mininet the switches and controllers operate under the OpenFlow protocol enabling the implementation of SDN applications. The controller used was POX, which enables rapid prototyping in the Python language to create features in the network [27]. The controller has been implemented to collect source IP addresses of new incoming packets. A function was developed for calculating packet statistics. The experiments were performed on the Ubuntu 16.04 LTS operating system, using a core i5 7400 3.0 GHz CPU with 4Gb of RAM.
The proposed detection mechanism is not influenced by the size of the network, but by the volume of packets that make up the observation window. To this end, using a network topology was considered in order to allow balancing the workload between the victim and the attacker. The topology consists of 4 OpenFlow switches, 9 hosts and 1 controller POX. The IPs range from 10.0.0.1 to 10.0.0.9, with host 10.0.0.3 being the victim server and host 10.0.0.7 the attacker. The range of spurious IPs are generated at random. The bandwidth of each link is 100 Mbps, as shown in Figure 2. The victim’s host is located on the “Switch OpenFlow 2” network and the DoS attacker performs the attack from the “Switch OpenFlow 4” network.
The generation of legitimate packets is performed using the Scapy [28]. Scapy is a tool that allows creating TCP and UDP packets. The spoofed SYN packets are generated using the tool Hping [29]. This tool is used for security testing on networks operating as a packet generator for the TCP/IP protocol. Two types of traffic were generated: normal traffic and spurious traffic. Normal traffic is used to obtain the statistical values used by the detection mechanisms of anomalies (chi-square and entropy) under normal conditions. With this, it is possible to define the detection threshold, based on Equation 4. Spurious traffic is injected to verify the behavior of the solution.
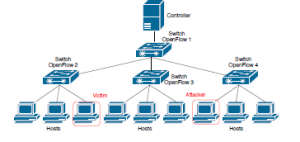
Figure 2: Network topology.
To analyze the proposed solution, SYN Flood attack were simulated by calculating the entropy and chi-square values using source IP addresses with different observation window sizes and smoothing coefficients (threshold) to identify the attack traffic. In the experiments, 20,500 packets were considered. The observation windows had the following sizes: 20, 60 and 100 packets. The window is moved sequentially with the same number of packets from the previous window without overlap, as shown in Figure 3. The smoothing coefficients (α) evaluated were: 0.1, 0.5 and 0.9. The simulation time of each experiment was 200 s, and in the hundredth second the SYN Flood attack was started at a rate of 250 packets per second from a host belonging to the “Switch OpenFlow 2” network. The rate of legitimate packets is 5 packets per second. Five simulations of each method were performed to analyze the behavior of the solution.

Figure 3: Moving windows
Figures 4 and 5 show the outputs of the chi-square and entropy values. Such values are obtained by Equations (1) and (2), respectively. The observed field was the source IP address, the observation windows have the size of 60 packets and the smoothing coefficient of 0.5 for the detection threshold.
The observation period shows 200 seconds of analysis, which at a rate of 250 packets per second generates about ≈833 windows of 60 packets. Before the onset of the attack, the chi-square and entropy measurements are in the range of 180 to 220 for the chi-square and 0.44 to 0.49 for the entropy for the normal traffic. During the attack, there is a considerable increase in these values in both techniques. The reason for this is that the source IP address is changed in each new packet, due to the attack characteristic, which causes the source IP address quantities to increase substantially filling the entire observation window, causing an anomaly. In the case of the chi-square, a peak is observed at the beginning of the attack injection, but during and after the attack, the values return to a normal traffic situation. entropy, in turn, best classifies the beginning and end of the attack, differentiating the attack period from a normal traffic situation. It is important to note that the chi-square is asymmetric, generating a peak only at the beginning of the attack, after the end of the attack there is a slight change between the observed values.
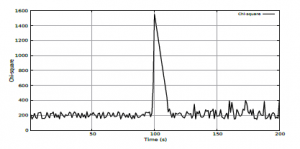
Figure 4: DoS attack identification using chi-square.
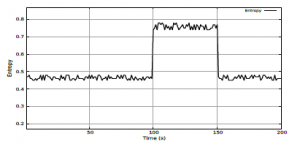
Figure 5: DoS attack identification using entropy.
It can be observed that both methods can identify anomalies in the network based on the deviation of the traffic distribution. The two methods were compared to identify which method has the highest detection rate and the lowest false alarm rate in the proposed SDN architecture model.
7.2. Metrics
The quality of the results was measured using a confusion matrix. Table 1 exemplifies the matrix model used. The matrix is composed of predicted values (results obtained) and actual values (expected results) of normal traffic and spurious traffic, based on the rates of false negative (FN), false positive (FP), true negative (TN) and true positive (TP).
Table 1: Confusion matrix.
| Predicted | Actual | |
| Attack | Normal | |
| Attack | TP | FP |
| Normal | FN | TN |
The FN rate is given by the number of packets classified as normal (negative) but that are confirmed as attack packets (positive). The FP rate is given by the number of packets classified as attack packets (positive) but they are confirmed as normal (negative) packets. On the other hand, TN rate indicates the number of packets correctly classified as legitimate (negative) and TP rate represents the number of packets correctly classified as attack packets (positive).
In this work, we use precision, recall and F1-score to evaluate the effectiveness of the proposed DoS detection mechanisms.
Precision represents the proportion of positive identifications that were correctly identified. This metric measures the quality of the results and is defined as follows:
![]()
Recall is the proportion of positives that have been identified correctly, measuring the completeness of the mechanism. This metric is defined as follows:
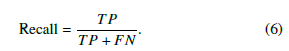
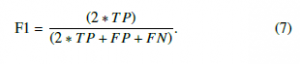
F1-score is defined as a harmonic mean between precision and recall, aiming to bring the balance between both, to indicate the overall performance of the technique. High F1-score values indicate that the detection technique presents more accuracy. this metric is defined as follows:
7.3. Results
The confusion matrix for the entropy and the chi-square can be seen in Table 2 and 3, respectively. The data in the table was obtained based on the simulation results for each statistical method presented. The smoothing coefficient can be observed immediately to the left at the beginning of each method analyzed.
The smoothing coefficient plays an important role in the definition of detection thresholds since it is responsible for defining the detection sensitivity of the proposed method. Through it is possible to assign weights to the values and thus the threshold represents an exponential weighted moving average, whose latest values have more weight. A very low coefficient may leave the solution more sensitive to small variations in the values obtained, providing a higher detection, but this sensitivity may cause an increase in the FP rate. On the other hand, a very high coefficient provides greater freedom for the change in the values obtained and consequently a lower detection resulting and an increase in the rate of FN. It is therefore ideal to seek a balance for the smoothing coefficient in order to provide it with an appropriate threshold that reflects well the characteristics of the network and can reduce these rates while maintaining an acceptable level of accuracy.
The size of the window is related to the accuracy of attack detection. We can note that the larger the window, the greater the accuracy in detecting the attack, this is due to the large number of packets that fill the window reflect in a greater representativity of the data to be observed, however this size can cause a greater consumption of resources by part of the controller and slower detection because the number of packets the solution needs to fill the window is larger. For a small window, we can observe a low precision in the results, because the observed values represent a small part of the total set to be analyzed, in contrast, we obtain a faster detection, providing a lower consumption of resources.
Considering the analyzed parameters of the smoothing coefficients and observation windows, the mechanisms had similar behaviors, although the entropy was 0.59% more accurate on average than the chi-square, due to the reduction of the FP and FN rate in both cases.
Figure 6 shows the result of the Precision. We can see that the mechanism can correctly identify spurious traffic in an acceptable way, avoiding false positives. Figure 7 shows the result of the Recall. The results show that the mechanism can effectively separate what is spurious traffic from legitimate traffic.
Figure 8 shows the result of the F1 score. Although entropy provides higher accuracy when compared to chi-square results, it requires a larger packet volume to detect any change in traffic, which can increase detection time. For example, for the 60-packet window with a smoothing coefficient of 0.1 (α = 0.1), the entropy needed to analyze approximately 582 packets to detect the attack, the equivalent of ≈10 windows, while the chi-square needed only 478 packets, the equivalent of ≈8 windows, reducing the volume of packets evaluated by about 17%, as shown in Figure 9. This is because chi-square allows the comparison between two consecutive distributions, allowing to detect much changes faster. Unlike entropy, which represents the dispersion of several values in a given probability distribution. In summary, chi-square has reduced on average by 14.89% of the number of packets to be analyzed in the observation windows used.
It is important to note that the results presented do not take into account the attack rate, because the proposed solution focuses on analyzing the behavior of the observation windows and the sensitivity of the detection thresholds, finding the ideal balance between these components in order to meet the needs of the network operator.
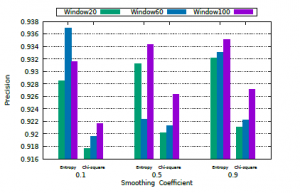
Figure 6: Precision results.
Table 2: Entropy confusion matrix.
| Window 20 | Window 60 | Window 100 | ||||||||
| Predicted | Actual | Predicted | Actual | Predicted | Actual | |||||
| Attack | Normal | Attack | Normal | Attack | Normal | |||||
| Attack | 95.5% | 8.9% | Attack | 95.7% | 8.6% | Attack | 95.9% | 8% | ||
| Normal | 4.5% | 91.1% | Normal | 4.3% | 91.4% | Normal | 4.1% | 92% | ||
α = 0.1
| Window 20 | Window 60 | Window 100 | ||||||||
| Predicted | Actual | Predicted | Actual | Predicted | Actual | |||||
| Attack | Normal | Attack | Normal | Attack | Normal | |||||
| Attack | 95.1% | 7.2% | Attack | 95.5% | 6.7% | Attack | 95.6% | 6.6% | ||
| Normal | 4.9% | 92.8% | Normal | 4.5% | 93.3% | Normal | 4.4% | 93.4% | ||
α = 0.5
| Window 20 | Window 60 | Window 100 | ||||||||
| Predicted | Actual | Predicted | Actual | Predicted | Actual | |||||
| Attack | Normal | Attack | Normal | Attack | Normal | |||||
| Attack | 94.4% | 6.6% | Attack | 94.7% | 6% | Attack | 94.8% | 5.9% | ||
| Normal | 5.6% | 93.4% | Normal | 5.3% | 94% | Normal | 5.2% | 94.1% | ||
α = 0.9
Table 3: Chi-square confusion Matrix
| Window 20 | Window 60 | Window 100 | ||||||||
| Predicted | Actual | Predicted | Actual | Predicted | Actual | |||||
| Attack | Normal | Attack | Normal | Attack | Normal | |||||
| Attack | 95% | 9.7% | Attack | 95.2% | 9.6% | Attack | 95.6% | 9.3% | ||
| Normal | 5% | 90.3% | Normal | 4.8% | 90.4% | Normal | 4.4% | 90.7% | ||
α = 0.1
| Window 20 | Window 60 | Window 100 | ||||||||
| Predicted | Actual | Predicted | Actual | Predicted | Actual | |||||
| Attack | Normal | Attack | Normal | Attack | Normal | |||||
| Attack | 94.7% | 7.6% | Attack | 95.1% | 7.1% | Attack | 95.3% | 7% | ||
| Normal | 5.3% | 92.4% | Normal | 4.9% | 92.9% | Normal | 4.7% | 93% | ||
α = 0.5
| Window 20 | Window 60 | Window 100 | ||||||||
| Predicted | Actual | Predicted | Actual | Predicted | Actual | |||||
| Attack | Normal | Attack | Normal | Attack | Normal | |||||
| Attack | 93.8% | 6.9% | Attack | 94% | 6.5% | Attack | 94.1% | 6.3% | ||
| Normal | 6.2% | 93.1% | Normal | 6% | 93.5% | Normal | 5.9% | 93.7% | ||
α = 0.9
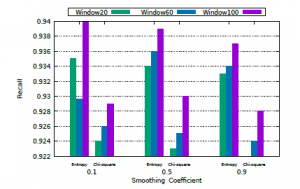
Figure 7: Recall results.
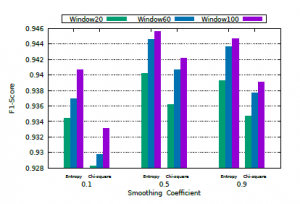
Figure 8: F1 Score results.
Finally, Figure 10 shows the result of time detection. The smoothing coefficient plays an important role in this regard as it allows manipulating the sensitivity of the mechanism which can result in faster or slower detection. For example, coefficient 0.1 provides more immediate alerts, unlike coefficient 0.9, at the cost of higher FP and FN rates. This is due to the weight of information given to the mechanism for calculating the detection threshold.
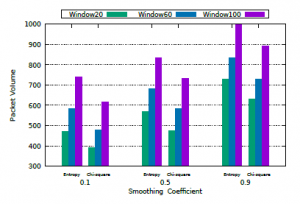
Figure 9: Packet volume.
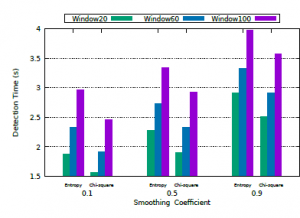
Figure 10: Detection Time.
8. Conclusion
This paper proposes a solution for the detection of DoS attacks based on the use of any mechanism for the detection of network anomalies. The mechanism works alongside the controller. Two techniques are evaluated for the detection of DoS attacks: entropy and chi-square. Both techniques were evaluated in terms of the rate of false positives and false negatives. From the experimental results, chi-square and entropy could detect the TCP-SYN Flood attack with an acceptable accuracy rate. The entropy was a little more accurate due to the reduction in the number of false positives and false negatives, around 0.59%, while the chi-square detects the anomaly with a smaller number of packets, on average 14.89% less entropy. One of the main benefits of the proposed solution is its versatility. Any parameter in the solution can be changed to suit the characteristics of the network. The detection field (i.e, source IP, destination IP, source port and source port), detection threshold and window size can be configured to meet SDN requirements. As future work, we want to handle this information to establish mitigation strategies in SDN architectures under different scenarios and different attack rates.
Conflict of Interest
The authors declare no conflict of interest.
Acknowledgment
This work is partially supported by the MCTIC/RNP/CTIC (Brazil) through the project P4Sec. [1] The relationship between the δ and Twi depends on the field to be analyzed. For example, if the field is the source IP, use δ> Twi , if the field is the destination IP, use (δ< Twi ).
- D. Kreutz, F. Ramos, P. Verssimo, and C. Rothenberg, “Software-Defined Networking: A Comprehensive Survey,” IEEE, 2014.
- D. Kreutz, F. M. Ramos, and P. Verissimo, “Towards Secure and Dependable Software-defined Networks,” in Proceedings of the Second ACM SIGCOMM Workshop on Hot Topics in Software Defined Networking, ser. HotSDN ’13. New York, NY, USA: ACM, 2013, pp. 55–60. [Online]. Available: http://doi.acm.org/10.1145/2491185.2491199
- A. Lara, A. Kolasani, and B. Ramamurthy, “Network innova- tion using openflow: A survey,” IEEE communications surveys & tutorials, vol. 16, no. 1, pp. 493–512, 2014.
- D. M. F. M. e Otto Carlos Muniz Bandeira Duarte, “Authflow: authentication and access control mechanism for software de- fined networking,” in Ann. Telecommun, vol. 71, 12 2016, pp. 607 – 615.
- F. Lau, S. H. Rubin, M. Smith, and L. Trajkovic, “Distributed denial of service attacks,” vol. 3, 02 2000, pp. 2275 – 2280 vol.3.
- S. Tritilanunt, S. Sivakorn, C. Juengjincharoen, and A. Siri- pornpisan, “Entropy-based input-output traffic mode detection scheme for DoS/DDoS attacks,” in 2010 10th International Symposium on Communications and Information Technologies, Oct 2010, pp. 804–809.
- A. Bhandari and A. Sangal, “Destination Address Entropy based Detection and Traceback Approach against Distributed Denial of Service Attacks,” I. J. Computer Network and Infor-
mation Security, vol. 8, pp. 9–20, jul 2015. - K. Kurihara and K. Katagishi, “A Simple Detection Method for DoS Attacks Based on IP Packets Entropy Values,” in 2014 Ninth Asia Joint Conference on Information Security, Sep. 2014, pp. 44–51.
- J. Li, Y. Liu, and L. Gu, “DDoS attack detection based on Neural Network,” in 2010 2nd International Symposium on Aware Computing, Nov 2010, pp. 196–199.
- C. Shannon, “A mathematical theory of communication,” vol. 27, pp. 379–423, 1948.
- M. Broniatowski and S. Leorato, “An estimation method for the Neyman chi-square divergence with application to test of hypotheses,” Journal of Multivariate Analysis, vol. 97, no. 6, pp. 1409 – 1436, 2006. [Online]. Available: http://www. sciencedirect.com/science/article/pii/S0047259X06000194
- A. Taha, “Software-Defined Networking and its Security,” 2014.
- M. Casado, T. Koponen, R. Ramanathan, and S. Shenker, “Virtualizing the Network Forwarding Plane,” Workshop on Programmable Routers for Extensible Services of Tomorrow, 2010.
- N. McKeown, T. Anderson, H. Balakrishnan, G. Parulkar,
L. Peterson, J. Rexford, S. Shenker, and J. Turner, “Open- Flow: Enabling Innovation in Campus Networks,” SIGCOMM Comput. Commun. Rev., vol. 38, no. 2, pp. 69–74, Mar. 2008. - O. N. Foundation, “Openflow switch specification 1.0,” vol. 1, pp. 1–44, december 2009.
- R. A. J. Gondim, “Mirror Saturation in Amplified Reflec- tion DDoS,” JNIC-Jornadas Nacionales de Investigacin en Ciberseguridad, 2019.
- R. Bani-Hani and Z. Al-Ali, “Syn flooding attacks and coun- termeasures: A survey,” 04 2013.
- H. Beitollahi and G. Deconinck, “Analyzing well-known coun- termeasures against distributed denial of service attacks,” Com- puter Communications, vol. 35, no. 11, pp. 1312 – 1332, 2012.
- J. Tajer, A. Makke, O. Salem, and A. Mehaoua, “A comparison between divergence measures for network anomaly detection,”
in 7th International Conference on Network and Service Man- agement, 2011. - L. Feinstein, D. Schnackenberg, R. Balupari, and D. Kindred, “Statistical approaches to DDoS attack detection and response,” in Proceedings DARPA Information Survivability Conference and Exposition, vol. 1, April 2003, pp. 303–314 vol.1.
- S. Sharma, S. K. Sahu, and S. K. Jena, “On selection of at- tributes for entropy based detection of DDoS,” in International Conference on Advances in Computing, Communications and Informatics, 2015.
- F. Leu and C. Pai, “Detecting DoS and DDoS Attacks Us- ing Chi-Square,” in 2009 Fifth International Conference on Information Assurance and Security, vol. 2, Aug 2009, pp. 255–258.
- S. Oshima, A. Hirakawa, T. Nakashima, and T. Sueyoshi, “DoS/DDoS Detection Scheme Using Statistical Method Based on the Destination Port Number,” in 2009 Fifth International Conference on Intelligent Information Hiding and Multimedia Signal Processing, Sep. 2009, pp. 206–209.
- A. C. Lapolli, J. A. Marques, and L. P. Gaspary, “Offload- ing Real-time DDoS Attack Detection to Programmable Data Planes,” in IFIP/IEEE International Symposium on Integrated Network Management, 2019.
- R. Carvalho, J. L. Bordim, and E. A. P. Alchieri, “Entropy- based DoS Attack identification in SDN,” 21st Workshop on Advances in Parallel and Distributed Computational Models, 2019.
- M. Team, “Mininet – an instant virtual network on your laptop (or other pc).” [Online]. Available: http://mininet.org/
- M. MC, “NOX.” [Online]. Available: https://github.com/ noxrepo/pox
- Scapy, “Packet crafting for Python2 and Python3.” [Online].
Available: https://scapy.net/ - S. Sanfilippo, “Hping – Active Network Security.” [Online]. Available: http://www.hping.org/