
Dynamic Behavior of Multi-Story Concrete Buildings Based on Non-Linear Pushover & Time History Analyses
Volume 5, Issue 2, Page No 143-153, 2020
Author’s Name: Sherif Gamal Abd-Elhamid1,a), Reham Mohamed Galal Ebrahim El-Tahawy2, Mohamed Nour El-Din Fayed3
View Affiliations
1Structural engineer at ENNPI, Structural engineering Department, Ain Shams University, 11311, Cairo, Egypt
2AssociateProfessor, Structural engineering Department, Ain Shams University, 11311, Cairo, Egypt
3Professor, Structural engineering Department, Ain Shams University, 11311, Cairo, Egypt
a)Author to whom correspondence should be addressed. E-mail: sherif_gamal9@yahoo.com
Adv. Sci. Technol. Eng. Syst. J. 5(2), 143-153 (2020); ![]() DOI: 10.25046/aj050219
DOI: 10.25046/aj050219
Keywords: Reinforced concrete structures, Non-linear time history analysis, Pushover analysis, Response reduction/modification factor

Export Citations
In many countries and regions in the world, earthquakes are one of the most common natural disasters, which affect both human life and property. To avoid negative effects of earthquake, the nonlinear response of structures under dynamic loading should be accurately modeled to investigate their actual behavior under earthquake loading to ensure safe and sound design. To yield proper results, accurate representative structural models should be developed for the elements resisting lateral loading and representative ground motions pertaining to the site should be employed. Then relating such response to that of elastic behavior should be conducted to correlate response modification factors in design codes with actual response. The main objective of the research is to investigate the effect of basements existence and considering soil pressure on retaining walls on the seismic response modification factor for reinforced concrete structures, based on ABAQUS software analysis results using pushover analysis and time history analysis. For this purpose, experimental results of individually tested RC structures are used in order to verify modeling technique to be adopted.
Received: 01 January 2020, Accepted: 22 February 2020, Published Online: 09 March 2020
1. Introduction
RC structures designed to withstand earthquakes must have enough strength and stiffness to control deflection and prevent any possible collapse. Recent seismic design codes include R factors in definition of lateral forces used for seismic design to reduce the design elastic spectral acceleration to account for its components yielding.
R factor reflects the structure capacity to behave in-elastically without collapsing. In fact, the response reduction / modification factor is a combined effect of over strength, redundancy and ductility. Response modification factors play an important role in the seismic design. No other parameter in the design base shear equation affects the design actions in a seismic framing system as does the value assigned to R-factor.
2. Literature Review
A summary of previously available analytical work was conducted for this study is presented as follows.
- In 2008, Asgarian and Shokrgozar [1] evaluated response reduction/modification factor(R), over-strength and the ductility of buckling-restrained braced frames. Seismic building codes considered a decrease in design loads; considering that, the RC structures have substantial over-strength and the capacity of energy dissipation. The ductility and over-strength were included in design through a reduction/modification factor(R). The basic fault in code actions was using linear methods not considering nonlinear behavior. Over strength in RC structures is connected to the fact that, maximum lateral strength of a RC structure usually beats its design strength. It was perceived that the response reduction/modification factor(R) decreases as the building height increases.
- In 2014, Apurba Mondal [2] focused on estimating the value of the response reduction/modification factor (R) for realistic reinforced concrete(RC) structures detailed and designed based on Indian standard (IS) for that they made models consist of 3, 5, 9 & 13 stories reinforced concrete (RC) frames and analysis was carried out with non-linear static method using static push-over analysis The results explained that the Indian standard (IS) recommendation for a higher value response reduction/modification factor (R) than actual value of response reduction/modification factor (R) is potentially dangerous.
- In 2014, Hakim [3] aimed to investigate building performance on resisting expected seismic loadings. Two 3D reinforced concrete(RC) frames were analyzed using the push-over analysis following (ATC-40). One was designed based on a design practice which takes in account only gravity load and other frame was designed based on Saudi Building Code (SBC-301) [4]. The results explained that the RC structure designed considering only gravity load was found not sufficient. While, the RC frame designed based on (SBC 301) satisfies Immediate Occupancy (IO) acceptance criteria following (ATC-40).
- In 2015, El Azizi [5] tested six RC walls under displacement controlled quasi-static cyclic lateral loading. The walls had three different configurations, rectangular, flanged and end confined. The study aimed at calculating and comparing the ductility capacities of the three configurations. Figure (1) shows the used wall configurations and reinforcement details. The results of the study show that the flanged and end confined walls had a significantly higher ductility capacity than their rectangular counterparts. El-Azizi suggested assigning different seismic force reduction factors for walls with different cross sectional configurations.
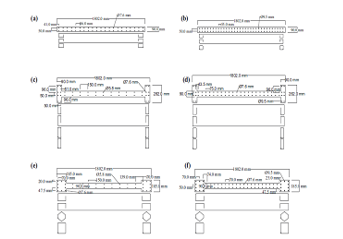 Figure 1: Wall Configurations and Reinforcement (El-Azizi et al., 2015)
- In 2016, Bholebhavi [6] modeled RC SMRF with medium rise that have irregularity in elevation, vertical irregularity and in Plan irregularities to evaluate the (R) factor for irregular RC structures using the non-linear static analysis. The results explained that as percentage of horizontal irregularities increases R-value decreases, as a percentage of sudden vertical irregularities increases, R-value was decreasing and a structure with gradual irregularities in elevation didn’t show considerable deviation in R-value.
- In 2004, Sungjin [7] studied the different factors that have effect on ductility. Evaluation of distortion capacity of the RC columns was important in performance-based seismic design. The capacity of RC columns in deformation was being expressed in various ways, which are drift, curvature ductility or displacement ductility. The effect of axial load, reinforcement ratio, volumetric ratio, concrete strength and shear span to depth ratio of the confining reinforcement, on various ductility factors were discussed and evaluated.
3. Non-Linear Numerical Model for RC Structures
3.1. Element Model
The ABAQUS program [8] is a powerful, intuitive, finite element program developed and maintained by Hibbitt, Karlsson and Sorensen, Inc. (HKS) through their company established in 1978. The ABAQUS system consists of a pre-processor ABAQUS/Standard, ABAQUS/Explicit and a postprocessor ABAQUS/Viewer or ABAQUS/CAE. The program is completely modular allowing the user to acquire and load only the modules that are needed. The input data for the program include nodal points, type of element, loading condition, material properties, dimensioning of the geometry of the structure, the restraints of nodes, the required type of analysis and the termination criteria.
3.2. Material model
In order to obtain accurate analysis, proper material models were needed. To be able to understand the mechanical behavior to final failure, it was important that this non-linear behavior could be simulated in the finite element analyses. The nonlinearities of the concrete in compression and the steel were accounted for with plasticity models. Three major effects cause the non -linear response of reinforced concrete namely:
- Crushing of concrete in compression.
- Cracking of concrete in tension.
- Yielding of reinforcement.
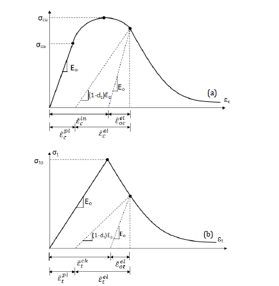 Figure 2: Behaviour of concrete under axial compressive (a) and tension (b) strength (ABAQUS User Manual, 2008 [9])
Nonlinearities also arise from the interaction of the constituents of reinforced concrete such as, bond – slip between reinforcing steel and surrounding concrete, aggregate interlock at a crack and dowel action of the reinforcing steel crossing a crack. The steel elements were provided with isotropic multi linear elasto-plastic material model.
The degradation of the elastic stiffness is characterized by two damage variables, dt and dc, which are assumed to be functions of the plastic strains, temperature, and field variables:
 The damage variables can take values from zero, representing the undamaged material, to one, which represents total loss of strength. If E0 is the initial (undamaged) elastic stiffness of the material, the stress–strain relations under uni-axial tension and compression loading are, respectively:
 4. Response Reduction Factor
The response reduction/modification factor (R) simply represents the ratio of the maximum lateral force if the structure remains elastic (Ve) to the lateral force (Vd), it is designed to withstand [10]. R factor is an essential seismic design parameter that is typically used to describe the inelasticity level expected in lateral load resisting systems during earthquakes. And depends on the over-strength factor (Ω), the ductility factor (??), the damping factor (?ξ), and the redundancy factor (??) as indicated in equation (5) as suggested by ATC-19 [11].
![]() The relationship between response reduction/modification factor (R), over-strength factor (Ω) and ductility factor (Rμ) is presented in Figure (3), assuming that ?ξ and ?? equal to (1.0).
The relationship between response reduction/modification factor (R), over-strength factor (Ω) and ductility factor (Rμ) is presented in Figure (3), assuming that ?ξ and ?? equal to (1.0).
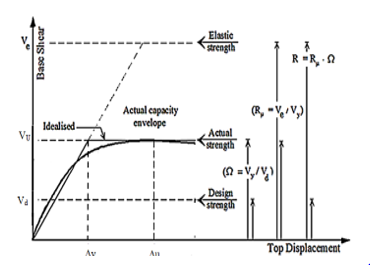 Figure 3: Relationship between response reduction/modification factor(R), over-strength factor (Ω) and ductility factor (Rμ)
4.1. Response Reduction Factor (R) in International Codes
- ECP and ASCE Codes
The seismic force values used in design of RC buildings are conducted by dividing forces that would be associated with elastic response by a response modification factor. Table 1 illustrates the values recommended for the response modification factors in ECP code [12] and ASCE code [13].
Table 1: R factor in ECP &ASCE codes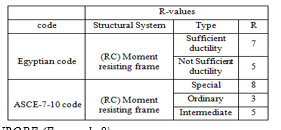
- EUROPE (Eurocode 8)
The seismic design procedure in Euro-code is a single level design procedure that reduces the elastic spectral demands to the strength design level through use of a period-dependent response factor, known as “behavior factor q”. This behavior factor differs as a function of building stiffness, regularity, strength, structural system and ductility. As shown in Figure (4), if , then the structure is irregular. Hence behavior factor shall be reduced by 20%. Table 2 shows the basic values of the behavior factor q0.
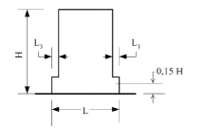 Figure (4): Criteria for regularity in Euro code [14]
Table 2: Basic value of the behavior factor, qo, for systems regular in elevation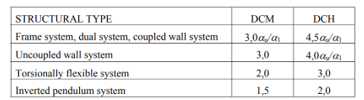
α1 and αu are defined as follows:
α1 is the value by which the horizontal seismic design action is multiplied in order to first reach the flexural resistance in any member in the structure, while all other design actions remain constant.
αu is the value by which the horizontal seismic design action is multiplied, in order to form plastic hinges in a number of sections sufficient for the development of overall structural instability, while all other design actions remain constant. The factor αu may be obtained from a nonlinear static (pushover) global analysis.
, frames or frame-equivalent dual systems:
− One-storey buildings: αu/α1=1.1,
− Multistory, one-bay frames: αu/α1=1.2,
− Multistory, multi-bay frames or frame-equivalent dual structures: αu/α1=1.3.
5. Model Verification
In this respect, two experimental output data for reinforced concrete(RC) frames using pushover analysis and an additional experimental output data based on nonlinear time history analysis (three records for each) were compared with the output results from ABAQUS 6.14 software analytical models in order to check the reliability and validity of a nonlinear finite element model. As a measure for the evaluation, the error in the results were calculated as follows.
% Error = ( ) x100%
5.1. Experimental Data
Model-1:
- Z. Korkmaz et al. 2010 [15] Tested one bay, two-story bare reinforced concrete (RC) specimen with no infill wall under a reversed cyclic loading. The goal of this test was to report on an experimental study about the Turkish EQ Code on proposed strengthening method. The specimens were subjected to lateral load that simulate the seismic action at the story level. Cycles were named as forward and backward cycles. Also, axial load was applied to top of columns. The test setup, instrumentation and loading system is presented in Figure (5). Dimensions and details of test specimens are presented in Figure (6). Figure (7) shows the ABAQUS analysis model conducted for this model. While Figure (8) shows plastic hinges formation & crushing in concrete.
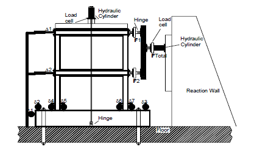 Figure 5: Test setup, loading system and instrumentation
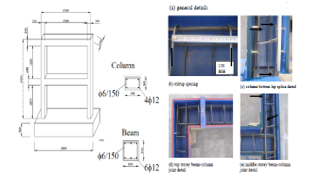 Figure 6: Dimensions and details of test specimens
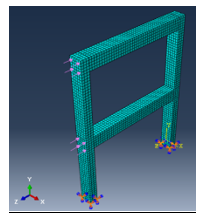 Figure 7: ABAQUS analysis model conducted for model 1
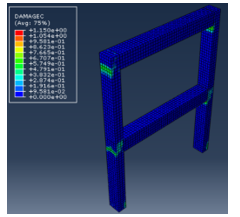 Figure 8: Plastic hinges formation & crushing in model-1
Model-2:
Ch. G. Karayanniset al.2005 [16]. Tested single bay single story bare reinforced concrete (RC) frame specimen was constructed and tested under lateral loading. The test aims to study behavior of bare and masonry in-filled reinforced concrete (RC) frames under lateral cyclic loading, Reinforcement detailing of the reinforced concrete (RC) frame model is presented in Figure (9). Test setup is shown in Figure (10). Propagation of cracks was recorded for bare frame as presented in Figure (11). Figure (12) shows the ABAQUS analysis model conducted for this model. While Figure (13) shows plastic hinges formation & crushing in concrete.
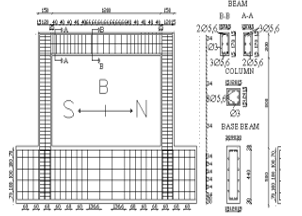 Figure 9: Reinforcement detailing of the reinforced concrete (RC) frame model (mm)
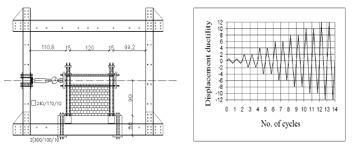 Figure 10: Test setup (cm) and loading program
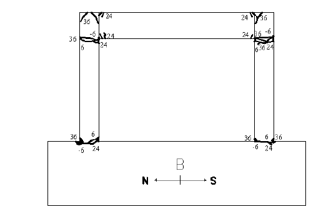 Figure 11: Propagation of cracks for bare frame
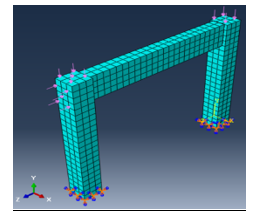 Figure 12: ABAQUS analysis model conducted for model-2
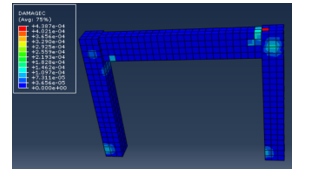 Figure 13: Plastic hinges formation & crushing in model 2
Model-3:
Behzad Fatabiet al.2012 [17]. Tested ten story height moment resisting building frame under shaking table using time history analysis with three records of earthquake to study dynamic response of structures. Benchmark earthquakes including the 1995 Kobe, the 1994 Northridge and the 1940 El Centro earthquakes are adopted. Figure (14) illustrate the shaking table tests on the fixed-base ten story model structures. Figure (15) shows the ABAQUS analysis model conducted for this model.
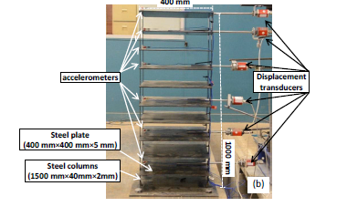 Figure 14: Ten story fixed-base model structure for shaking table tests
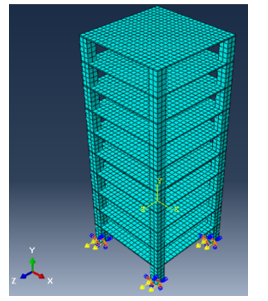 Figure 15: ABAQUS analysis model conducted for model-3
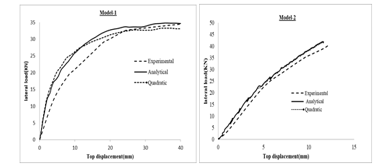 Figure 16: Modeling Results for reinforced concrete (RC) frames specimens
5.2. Verification of Experimental Results
A comparison between experimental and analytical load-displacement curves for all reinforced concrete frames is presented in Figures (16) & (17). The figure shows that the analytical load-displacement curves are matching the experimental load-displacement curves. The quadratic curve also refers to the analytical results but using quadratic meshing instead of linear meshing, considering that using quadratic meshing in the analysis increases the accuracy of results. As shown in Figure (16), using quadratic meshing make the error smaller.
Table (3) shows the comparison between experimental and analytical values of ultimate flexural strength.
Table 3: Results for models-1 & 2 (Pushover analysis)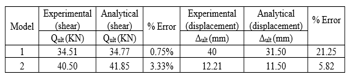
While for model-3, time history results were verified as shown in Table (4) & Figure (17)
Table 4: Results for model-3 (Time history analysis)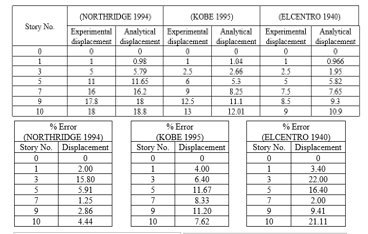
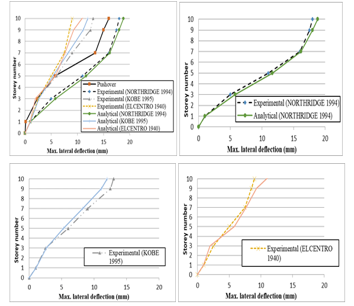 Figure 17: Results for Time history Analysis Records.
5.2.1. Observations from verification models:
Since the comparison between experimental and analytical results showed a negligible error, consequently the ABAQUS analytical models could be considered to capture the real behavior of the RC concrete frames.
- It’s observed that using quadratic meshing in ABAQUS increased the accuracy in results because:
- The high order approximation for the finite element (keeping the same size) leads to a smaller error for the solution if all parameters (boundary conditions, geometry, materials) are sufficiently smooth. Thus the quadratic approximation is better than linear one.
- Triangular shapes for FE of low order (linear) leads to the larger error (locking for bending)
- Small size of FE leads to the smaller error (but it leads to many FE’s).
- It’s observed that full detailed reinforcement modeling for columns & beams in ABAQUS model increased accuracy of results.
6. Parametric Study
6.1. Modeling Data
Three case studies were analyzed to investigate the effect of basements on (R) factor. Figures (18), (19), (20) & (21) show the case studies geometry (plans, sections & details) used for modeling. The case studies configurations were selected to simulate a huge number of buildings that contain the same elements with a proper distribution in plan. In the first two cases, retaining walls were used to support the two stories in basement, as the RC building contains two stories in basement and five typical stories above ground with an upper roof, but in the first case the soil pressure on retaining walls was taken in account while modeling, while in the second case the soil pressure was neglected. In the third case, no retaining walls were used, so the RC building contains ground, first floors and five typical floors with an upper roof. Their structural system is combined between RC frames and cores. Figure (16) shows reinforcement details for columns, beams & cores.
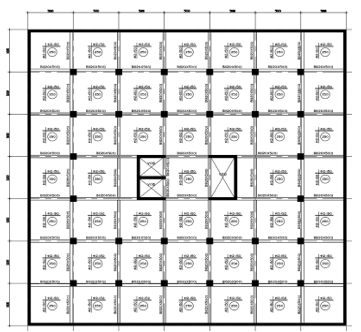 Figure 18: 1st & 2nd case study geometry (for two stories in basements)
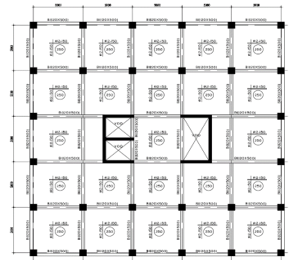 Figure 19: 1st & 2nd case study geometry (for five stories in super structure)
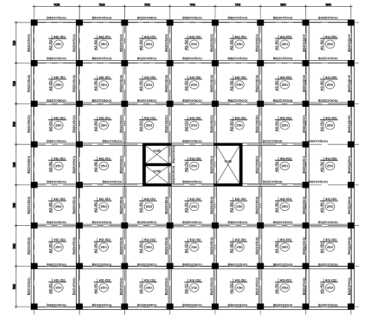 Figure 20: 3rd case study geometry (for ground & first floors)
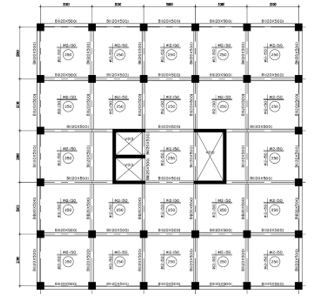 Figure 21: 3rd case study geometry (for five typical stories)
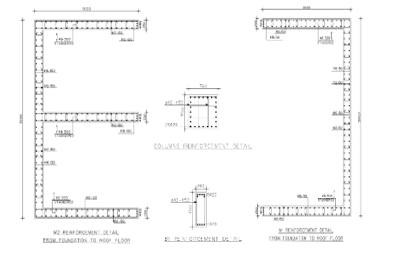 Figure 22: Case studies geometry (reinforcement details)
The following material properties were used in the parametric study:
- Concrete compressive strength (cube) (fcu) =40 MPa
- Concrete young’s modulus (Ec) = 26587.215 MPa
- Specific weight for concrete =25 kN\m3
- Steel yield strength (fy) = 400 MPa for vertical reinforcement and stirrups
- Steel young’s modulus (Es) =200 GPa
- Specific weight for steel =78.5 kN\m3
- Specific weight for steel =78.5 kN\m3
Vertical load was assigned to all levels, as follows:
- For basement stories & typical floors:
Floor Cover = 2 kN/m2, Walls load = 2 kN/m2 and Live Load = 2 kN/m2.
- For roof floor & upper roof floor:
Floor Cover = 2.5 kN/m2 and Live Load = 2 kN/m2.
Figure (23) shows the ABAQUS modeling for concrete solid meshed elements and steel wire elements, while Figure (24) shows the boundary conditions for the concrete footing had locked translational degrees of freedom in all directions.
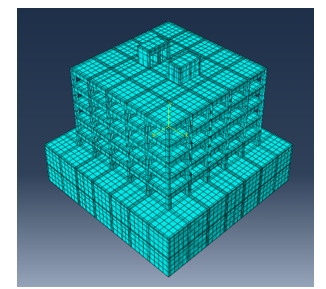
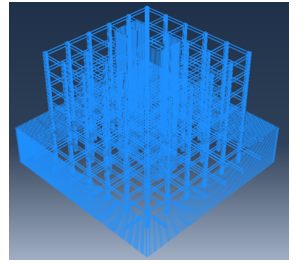 Figure 23:.(a): 1st Case study ABAQUS model (concrete meshed elements & steel wire elements)
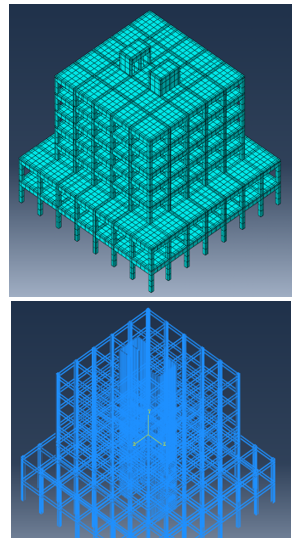 Figure 23.(b): 3rd Case study ABAQUS model (concrete meshed elements & steel wire elements)
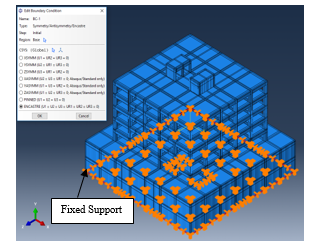 Figure 24.(a): 1st Case study ABAQUS model (boundary conditions)
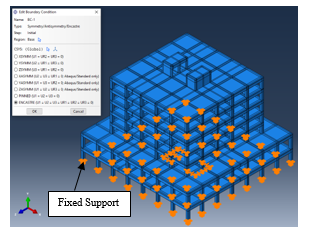 Figure 24.(b): 3rd Case study ABAQUS model (boundary conditions)
6.2. Methods of Analysis
Two methods of analysis are used in the parametric study in order to model RC buildings considered in this study. These methods are non-linear static pushover analysis and non-linear time history analysis.
6.2.1. Pushover model
The incremental load assigned in pushover analysis model developed for RC buildings was considered to increase from basement to the top level of the building until amplification factor for load = 1.0, as shown in Figure (25).
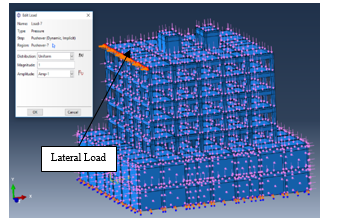 Figure 25.(a): 1st Case study ABAQUS models (loading)
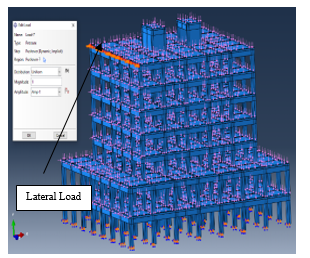 Figure 25.(b): 3rd Case study ABAQUS models loading
6.2.2. Time history models
A series of three earthquakes with low, medium, and high frequencies were selected for the nonlinear dynamic analyses to be assigned for the 1st case study and the 3rd case study. By reference the PEER database (PEER 2006) [18], time history of selected earthquakes along with peak ground acceleration (PGA) and year of occurrence of the earthquake are illustrated in Figure 26. The maximum value for base shear is considered as per ECP code recommendations; in case of studying three earthquakes.
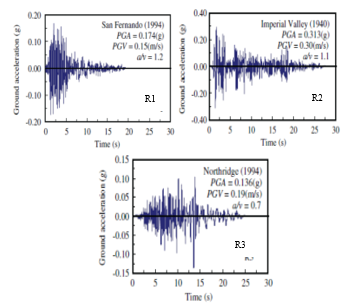 Figure 26: Time history of selected ground motions
6.3. Failure criteria
The analyses were continued until the earlier from two options as per ECP code requirements:
- Stress in reinforcement = 400MPa
- Strain in concrete = 0.002 at maximum compressive strength according to ECP code [19], as shown in Figure (27). Figure (28) shows deformation for the 1st case study, while figure (29) shows plastic hinges formation & crushing in concrete for the 3rd case study.
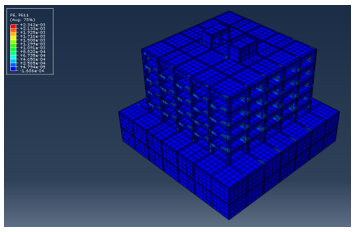 Figure 27: Strain for concrete
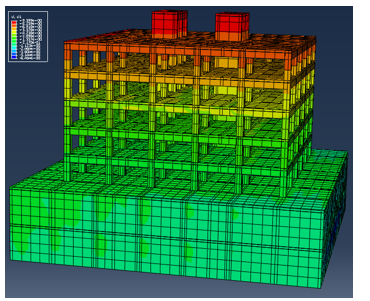 Figure 28: Deformed shape for the 1st case study
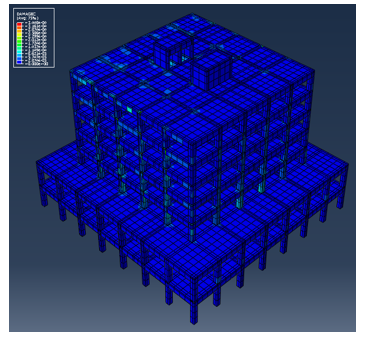 Figure 29: Plastic hinges formation & crushing in concrete for the 3rd case study
6.4. Observations from The Parametric Study
6.4.1. Pushover Results
The results for base shear, displacement & calculated response modification factor considering pushover analysis are listed in Table (5) and Figures (30), (31) & (32).
Table (5): Results for studied RC buildings based on pushover analysis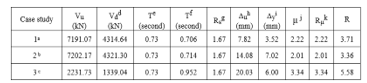
aThe first case study where retaining walls were used and soil pressure was assigned to them.
bThe second case study where retaining walls were used and soil pressure wasn’t assigned to them.
cThe third case study where retaining walls weren’t used.
dVd Design base shear equal 60% of the ultimate load capacity as suggested by Uang (1991) [20].
eT Calculated max. time period as per ECP requirements, time period shall not exceed (1.2*0.05 *h0.75)
fT Fundamental period obtained from ETABS model for multi degree of freedom
gRs =Vu / Vd
hΔu Max Top displacement at Vu, calculated based on peak load, as recommended by Park, R., and Paulay, T,1988 [21].
IΔy yield displacement, calculated based on equivalent elasto plastic yield as recommended by Park, R. & Paulay, T,1988 [21].
jμ =Ratio between the ultimate displacement and the yield displacement (Δu/ Δy).
kRμ Function of μ depends on time period, as per Newmark & Hall assumptions [22]:
T < 0.2 seconds Rμ=1
0.2 < T < 0.5 seconds Rμ=
T > 0.5 seconds Rμ=μ
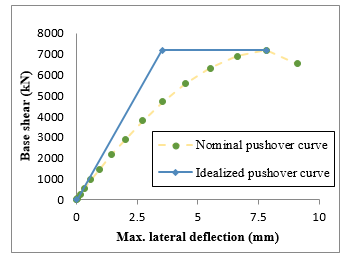 Figure 30: Base shear versus top displacement (nominal curve & idealized curve) for 1st case study
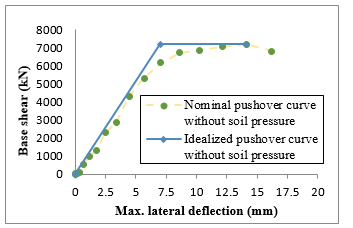 Figure 31: Base shear versus top displacement (nominal curve & idealized curve) for 1st case study without soil pressure
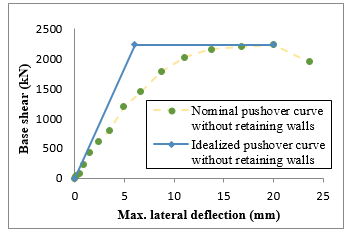 Figure 32: Base shear versus top displacement (nominal curve & idealized curve) for 2nd case study
6.4.2. Time history Results
The results for time history analysis models developed for the RC building (1st & 3rd case studies) are listed in Tables (6) & (7).
Table (6): Results for all reinforced concrete (RC) frames models based on time history analysis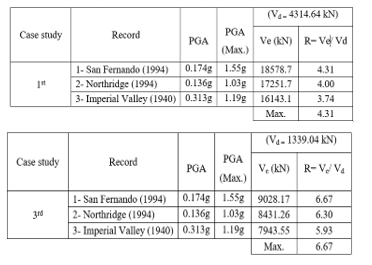
Table 7: Comparison between time history results and pushover results for the 1st & 3rd case study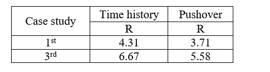
7. Conclusions
A parametric study was conducted to illustrate how the response modification factor would be affected in case of existence of multi-story basements, number of stories underground and taking in account the pressure effect from soil besides the retaining walls. The first main objective was to determine the R-value. While the second main objective was to compare the calculated response modification facto (R) values for reinforced concrete (RC) shear walls with those specified in ECP and international codes.
Some interesting conclusions could be extracted from the parametric study regarding the building behavior, taking in account that the calculated R values could be related only to similar RC structures, as follows:
- The (R) factor values, calculated for the RC structures with two basement stories and supporting retaining walls doesn’t match ECP code recommended values, because the stiffness increases due to existence of retaining walls, which isn’t considered in ECP code.
- The (R) factor values calculated using pushover analysis & time history analyses for the RC structures without basement stories (3rd case study) are close to that recommended in ECP & ASCE codes.
- The (R) factor values, calculated from analytical models for the RC structures with basement stories (1st case study), match the recommended values in Euro code. As the Euro code specify unique values for (R) factor for RC structures that have irregularity in elevation (a reduction of 20% shall be used), which is not considered in ECP code.
- The (R) factor increases with a significant value when removing retaining walls, while it decreases when neglecting soil pressure on retaining walls, as the ductility factor increases and the time period increases.
- The time period calculated from analysis models increases when removing retaining walls, as the RC structure stiffness decreases when removing retaining walls.
- The (R) factor is very sensitive to the existence of the retaining wall, while it isn’t as much as sensitive for considering soil pressure on retaining walls, due to changing in stiffness in case of existence of retaining walls.
- Pushover analysis gives results for (R) factor that are close to time history analysis results.
- From pushover analysis, Increasing number of stories from five, ten to fifteen leads to a larger displacement, also a larger ductility factor.
- From pushover analysis, Increasing number of stories from five, ten to fifteen leads to a bigger (R) factor.
Conflict of Interest
The authors declare no conflict of interest.
Notations
- DCM: Ductility Class Medium
- DCH: Ductility Class High
- Es: Steel Young’s Modulus
- Ec: Concrete Young’s Modulus
- Fcu: concrete Compressive Strength
- EQ: Earthquake
- fy: Steel Yield Stress
- FE: Finite Element
- R: Response Reduction/Modification Factor
- RC: Reinforced Concrete
- Rμ: Ductility Factor
- Vu: Maximum Base Shear
- ∆y: Yield Displacement
- μ: Ductility Capacity
- Ω: Over-Strength Factor
- Asgarian and Shokrgozar et al. “BRBF response modification factor”, Journal of Constructional Steel Research, 2008.
- Apurba Mondal et al. (Performance-based evaluation of the response reduction factor for ductile RC frames), 2014. DOI: 10.1016/j.engstruct.2013.07.038
- Hakim et al.“Seismic Assessment of an RC building using pushover analysis”, Saudi Arabia, 2014. DOI:5281/zenodo.14043
- (SBC-301) Saudi Building Code.
- El Azizi et al., “Assessment of the seismic performance of reinforced masonry and reinforced concrete shear wall buildings”, M.Sc. Thesis, Faculty of Engineering, Ain Shams University, Cairo, Egypt, 2015.
- Bholebhavi Rahul D.1, Inamdar V.M.,” An Evaluation of Seismic Response Reduction Factor for Irregular Structures Using Non-Linear Static Analysis” International Journal of Innovative Research in Science, Engineering and Technology, ISSN (Online): 2319-8753, ISSN (Print): 2347-6710, Issue 5, May 2016. DOI:10.15680/IJIRSET.2016.0505136
- Sungjin BAE, “What Do We Know About The Performance-Based Design Of Columns?” Issue August 2004.
- ABAQUS software V6.14.
- ABAQUS/Standard Analysis User’s Manual, Version 6.14.
- Bedeir, H., “Assessment of the seismic performance of reinforced masonry and reinforced concrete shear wall buildings”, M.Sc. Thesis, Faculty of Engineering, Ain Shams University, Cairo, Egypt, 2016.
- Applied Technology Council (ATC). (2008). “Quantification of building seismic performance factors.” ATC-63, Project rep., 90% draft, Redwood City.
- ECP (Egyptian Code of Practice for loading), 2012.
- ASCE 7 (Minimum Design Loads for Buildings and Other Structures. American Society of Civil Engineers. USA), 2005. https://doi.org/10.1061/(ASCE)0733-9445(2005)131:3(507)
- Eurocode 8 Provisions (2004).
- Z. Korkmaz, “Experimental study on the behavior of non-ductile infilled RC frames strengthened with external mesh reinforcement and plaster composite, Issue 18 November 2010. https://doi.org/10.5194/nhess-10-2305-2010
- G. Karayanniset al. “Seismic behavior of infilled and pilotis RC frame structures with beam–column joint degradation effect”, The Democritus University of Thrace, Greece, 2005. DOI: 10.1016/j.engstruct.2011.06.006
- Behzad Fatabiet, , Effect of Dynamic soil-pile-structure interaction on seismic response of mid-rise moment resisting frames”, Issue June 2012.
- PEER database (PEER 2006).
- ECP (Egyptian Code of Practice for design), 2017.
- Uang, C., “Establishing R (or Rw) and Cd factors for building seismic provisions”, J. Struct. Eng., 117(1). 19-28, (1991). DOI: 10.1061/(ASCE)0733-9445(1991)117:1(19)
- Park, R., and Paulay, T ”Reinforced Concrete Structures”,Wiley,New York, 1988. DOI: 1002/9780470172834.ch5
- Newmark, N. M., and Hall, W. J., “Earthquake spectra and design”, EERI Monograph Series, Earthquake Engineering Research Institute, Oakland, Calif, 1982. DOI: 10.1007/s11803-016-0341-1