
Review on Outliers Identification Methods for Univariate Circular Biological Data
Volume 5, Issue 2, Page No 95-103, 2020
Author’s Name: Siti Zanariah Sataria), Ku Muhammad Naim Ku Khalif
View Affiliations
Centre for Mathematical Sciences, Universiti Malaysia Pahang, 26300 Gambang, Kuantan, Pahang, Malaysia
a)Author to whom correspondence should be addressed. E-mail: zanariah@ump.edu.my
Adv. Sci. Technol. Eng. Syst. J. 5(2), 95-103 (2020); ![]() DOI: 10.25046/aj050212
DOI: 10.25046/aj050212
Keywords: Biological Data, Outliers, Circular Data, Abnormality

Export Citations
Circular data are common in biological studies which are involved angle and direction measurements. An outlier in circular biological data mostly related to the abnormality of the data set. The existence of outliers may affect the final outcome of a data analysis. Thus, an outliers’ identification method is essential in circular biological data to determine the stage of abnormality for the sample that has been studied. Past studies were mostly focusing on detecting outliers for multivariate circular biological data. However, identifying outlier for univariate data is more essential in the abnormality stage investigation. In this study, outliers’ identification methods for univariate circular biological data have been reviewed. The strength and weaknesses of the methods are investigated and discussed.
Received: 01 January 2019, Accepted: 22 February 2020, Published Online: 09 March 2020
1. Introduction
Biology involves the studies on living organism evolution, growth, function, dissemination or advancement. Biological research currently covers a variety of fields of experimental biology; including biochemistry, bioinformatics, biotechnology, biomedicine, genetics, genomics, molecular biology, neuroscience and system biology. Biological data that related to angle and direction measurement is classified as circular biological data. This paper investigates the wide use of biomedical and ecological circular data from biological branches. For example, biomedical data involving circular values are bone structure measurement [1] and heart rhythm analysis [2]. While ecological circular data involve animal mobility such as bison trails shaped [3] and movement of intertidal gastropods [4]. Due to circular characteristic, circular biological data requires special care and a suitable circular distribution model is needed. Specific outliers’ detection method also need to be used to get accurate and precise results during analysis. An extreme outlier may affect the result especially on modeling and forecasting purposes [5]. An outlier in circular biological data mostly related to the abnormality of the data set which may affect the final finding of the analysis and lead to erroneous in decision making. For example, in biopharmaceuticals especially for vaccines research, drug productions will effected by outliers that can cause of the false acceptance or rejection of a bad or good drug [6].
While in phylogenomic studies, errors during orthology detection, may cause a systematic error which can effect regulation of biological process that need to be taken [7]. Therefore, outliers can cause misdirecting factual outcomes and estimation of parameters which are may not bring precise forecasts. There is a great deal of difficulties in outliers detection with the expanding complexity, size and assortment of biological datasets. Thus, a lot of study has been done to identify outliers in biological data, but most of them for circular regression model. For example on eye dataset of glaucoma patient [8,9], on circadian data taken from systolic blood pressure reading [10] and on angular of protein chain shapes [11]. Hence, there is a need to explore more outliers’ detection technique for univariate circular biological data. Identifying outlier for univariate data is more essential in the abnormality stage investigation [6,7]. Also, previous study shows that, most data are from environmental study such as wind direction [12] and direction of sandstone [13]. Therefore, the aim of this paper is to review outliers’ identification methods for univariate biological circular data. The strength and weaknesses of the methods are reviewed and discussed to highlight the similarity and differences of each method. Besides that, the trend of univariate circular biological data types that has been used and its distribution models also been investigated.
2. Circular Biological Data
In biological study, there are two types of directional data represented either in two or three dimensions. It is called circular data for the two dimensions. Circular data can be represented as measurements in the clockwise or anti-clockwise direction, and can be measured in degrees (0o, 360o), or radians (0, 2π). Meanwhile, it’s defined as spherical data for the three dimensions where the data is measured as points on a unit sphere’s surface by two angles, such as the points measured by longitude and latitude on the surface of the earth [14]. There are a lot of biological circular data. There are few examples in ecology studies such as the vanishing angle of the pigeon after release [14], the homing ability of the frog [15,16], and the direction of the sea star after removal from the natural habitat [15].
In addition, there are also many angles involved in molecular research. For example, protein structure shape that determines by dihedral angle sequence [17], protein structure pairing angles [18,19], protein angle formation [11], and protein structure prediction [18]. Biomedical also includes some circular data such as heart rhythm analyst [2], corneal shape anomaly after cataract surgery [19], psoriasis observation of psoriatic plaque segmentation in skin images [20], and angular measurement of craniofacial disease (angel of jaw) [21]. Circular statistics and vector strength were used in the analysis of heart rhythm by measuring angular histogram in the R-wave vector to analyze ECG-waves. Circular linear analysis was used in Psoriasis by applying circular copula model means.
3. Univariate Circular Model for Biological Data
There are few types of univariate circular distribution such as Uniform distribution, Cardioid distribution, a triangular distribution, Circular Normal (CN) distribution, off set normal distribution, Wrapped Normal (WN) distribution, Wrapped Cauchy (WC) distribution, general Wrapped Stable (WS) distribution, variations of CN distribution, a Circular Beta Model and Asymmetric Circular distributions. The most commonly used circular distribution for circular biological data is Circular Normal (CN) distribution or called as von Mises distribution which can be found in many literatures [22,23,24]. The probability density function of the Von Mises distribution is given by
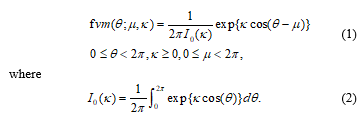 The mean direction is stated as µ parameter. The concentration parameter κ, influences the concentrated distribution around the mean direction. The larger values of κ will show the result of the distribution which is more closely grouped around the mean direction. The von Mises distribution is continuous on the circle and is the circular analogue of a linear normal distribution. For example, in biological studies, [25] used frog data following a von Mises distribution and identifying outliers in the data. Meanwhile, [26] suggested that circular data could be tested by considering the probability ratio test for slippage location in a von Mises distribution or the probability ratio test for slippage concentration in a Fisher distribution by [27].
Also, [28] used von Mises distribution to propose a new definition of truncated probability distribution for univariate and bivariate circular data which is applied to protein chains for angular values. Besides, [15] used von Mises distribution for adjusting and detecting outliers of the sea star directions using robust circular distance. In other hand, some researcher used other probability distribution such as by mixing a wrapped stable distribution with a circular uniform distribution in identifying outliers. For example, [14] used Symmetric Wrapped Stable (SWS) and Circular Uniformity (CU) to analyse the distribution of pigeon’s vanishing angles data.
4. Outlier Identification in Circular Biological Data
Outliers are data that do not appear as normal with the remaining data in the same set. An outlier may be data that is novel, new, anomalous, abnormal, strange or noise. Circular biological data contains two types of outliers, including any analytical or biological data [29]. During the analytical process, analytical outliers consist of one or more abnormal values among all the samples. Thus, the researcher needs to determine whether the outliers need to be removed or adjusted. While, the biological outliers occur when the sample value tends to be extremely higher or lower than other sample values [30]. Many researchers did a lot of studies to identify outliers for biological circular data. [15] have suggested two main ways to deal with this problem which are outliers either can be deleted or adjusted. Besides that, robust statistical methods also can be used to detect outliers. However, it has been used only in the circular regression model that is applied to environmental data in particular for wind direction data [31], not for biological data. Therefore, it is very important to choose suitable methods of identifying outliers in circular data for proper data handling. Graphical and numerical methods are the most common tools used in investigating the existence of outliers in circular data. Thus, all those methods have been reviewed intensively in the next section.
5. Outlier Identification for Univariate Circular Biological Data
There are several graphical techniques used to detect outliers in univariate circular biological data. The summary of all the graphical methods in identifying outliers for univariate circular biological data is shown in Table 1. There are three common types of graphical techniques such are P-P Plot, Q-Q Plot and Circular Boxplot. As example, [14] used the P-P Plot and Q-Q plot to identify outliers in the pigeons vanishing angles after been released. Meanwhile, [32] used the Q-Q plot to identify outliers in the sea star movement directions after they were displaced from their natural habitat. The P-P Plot is simple and easy to obtain by finding the best-fitting circular normal distribution model but it need supplement from numerical test. The Q-Q plot is obtained by calculating the sample quartiles, but the technique was harder to get accurate result especially for outlier that situated too close to the other sample values. Meanwhile, [24] and [33] proposed Circular Boxplot which is modification from the normal boxplot. The technique is applied to the frog’s directions data. Homing ability of northern cricket frog, Acris Crepitans has been taken from [34]. The proposed method (Circular Boxplot) performed better when both value of κ and the sample size are larger.
Table 2 to Table 4 show few numerical methods for identifying outliers of univariate circular biological data particularly for ecological data which are frog, sea star and pigeon movement. From the tables, it can be seen that the homing ability
Table 1: Review on Outliers Identification in Univariate Circular Biological Data Using Graphical Methods
|
Biological Data (Ecological Data) |
Model Distribution | Outliers Identification Methods | Strength | Weakness | Analysis tool | References |
| Pigeons- Vanishing angles of pigeons released | Circular Normal (CN) or Von Mises (VM) model | P-P Plot | Simple graphical way to detect outlier and easier to obtain by finding the best-fitting CN distribution, and then plot it. | Need to support by numerical test for a more accurate result. | Statistical package: SPlus |
[14]
|
| Q-Q Plot | Approximate plot is obtained by calculating the sample quantiles. | It is harder to get the result especially for outlier that situated too close to the other sample values. | ||||
| Sea stars directions – after they were displaced from their natural habitat | Von Mises (VM) model | Q-Q Plot | The extra feature of the Q-Q plot is that may reveal an outlying value. | The type of plot may very vary even when the hypothesized model is appropriate to the data, therefore need to supplement by numerical test. | Not Mention | [32] |
| Frog – homing ability of the northern cricket frog, Acris Crepitans | Von Mises (VM) model | Circular Boxplot |
Performs better when both the sample size and value of κ are greater. It advisable to use different values of resistant constant ν for identifying possible outliers in the circular variable. |
Overlapping lower and upper fences may occur.
|
Statistical package: SPlus |
[24, 33]
|
of northern cricket frog data has been widely used to illustrate the capability of the proposed numerical methods. As example in 1980, [27] proposed four test statistics, namely L, C, D, and M’ Statistic to identify a single outlier in univariate circular data, particularly for the frog data (refer Table 2). It was found for small samples sizes that; it is better to use the C and D statistics. However, no single statistic was recommended to detect multiple outliers, and typical methods are only successful in detecting a single outlier at one time. Furthermore, there was no discussion on how to identify an outlier when the sample size is large.
One Spurious Observation which is introduced by [25], also been implied to the frog data to present more than one outlier by using the posterior probabilities of sets of m spurious observations (refer Table 2). However, this technique is too sensitive to small data. Later, [16, 24, 35] intensively done research on the frog data and proposed few methods for identifying outliers in univariate circular data (refer Table 2 and Table 3). The authors proposed three methods which are A Statistic, Chord Statistic and An Alternative Test of Discordance.
Firstly, [35] introduced A Statistic which is based on the summation of the circular distances from the point of interest to all other points. It performed well in large sample sizes and provide an alternative test of discordancy in circular sample, especially with the known problem of finding the estimate of the concentration parameter κ, using maximum likelihood method. Secondly, [24] proposed Chord Statistic which is more simpler and easier to interpret. This method is based on the summation of the chords’ length between the circular observations which is using circular distance as parameter. Finally, [16] proposed a discordance test which is based on the circular distance between sample points. The test is called as An Alternative Test of Discordance. This test can be applied to detect possible outliers in both univariate and bivariate data. All simulations and tests done by [16, 24, 35] were using SPlus Statistical Package.
On the other hand, [23] used R Statistical Package to detect outliers in the frog data (refer Table 3). The authors introduced triple measure of robustness which is called a Robust Circular Distance Statistic (RCDu). A high probability of outliers detected, and low rates of masking and swamping are always considered as the good robustness properties for any outlier detection methods. RDCu successfully detect outliers with high levels of contamination in large univariate circular biological data.
Table 4 shows the review of the outliers identification methods for the sea star movement directions, vanishing pigeon’s angles and Jander’s ant orientation. Two methods have been introduced for sea star data that apply to the von Mises (VM) distribution model. Firstly, [32] proposed Mn Statistic (based on resultant length) which is adapted from [27]. The method suitable for small sample size and for single outlier. Secondly, [15] proposed a method based on circular distance between circular data points and circular mean direction by adjusting the outlier. The procedures provided results of the mean resultant length as close as the results of the clean data and minimize MCD (Mean Circular Distance) with low and high contamination levels.
Few other methods have been introduced by [14]. The authors proposed Likelihood Ratio Testing (LRT) Statistic and Locally Most Powerful Invariant (LMPI) Statistic which are applied to vanishing angles of pigeons once released. The results show that, LRT has best performance when location parameter value is moderate. While LMPI has best performance when location parameter µ1 value is small. It shows the same result when the ant orientation data have been applied to LMPI [36]. Two types of statistical package have been applied to LMPI which are SPlus and DDSTAP Statistical package developed by [37].
In addition, Table 5 shows the studies in identifying outliers for biomedical circular data. Only one research that used von Mises distribution model which is study on eye data set of glaucoma patients. [38] proposed Ga Statistic, which is based on the spacing theory. Other studies have been done on eye and circadian rhythm data set but for Multiple Circular Regression (MCR) model. [10] using DMCEs Statistic to analyse circadian data base on systolic blood pressure. The DMCEs Statistic performed well when the sample size n and the value of concentration parameter κ are large. Other statistics called DFBETAc Statistic and COVRATIO Statistic are introduced by [8, 9] applying to the eye data set. It is shown that, DFBETAc Statistic performed well and more accurate when parameters estimation become smaller after removing the outliers.
6. Discussion
Currently, review on circular biological data shows that, most of the data are from ecological area of study. Only one biomedical data has been found recently that using univariate circular distribution model. While the other biomedical study involves multiple regression analyses for example eye data of glaucoma patients [8,9], and on circadian data which take from systolic blood pressure reading [10]. Hence, we believe there is a need to explore more on univariate circular data related to human being especially in biomedical research and health informatics since identifying outlier for univariate data is crucial in the abnormality stage investigation.
Outlier identification obviously becoming more important for identifying of abnormality or error in circular biological data. From the review tables, numerical techniques more frequently used compared to graphical techniques. Although graphical technique more interesting and simpler to calculate, the results still need to be supplement by numerical technique to get adequate and precise results. The graphical techniques also have disadvantage when the sample size and value of κ are smaller. It is shown that, a lot of new technique has been evolving from Mardia (M) Statistic by [39]. More new procedures have been proposed, mainly calculated based on circular distance between circular observations such as A Statistic [35], Chord Statistic [24] and An Alternative Test of Discordance [16]. It shows that, those proposed statistic performed well compared to C, D, L and M’ Statistics and can be applied to both univariate and bivariate data for large sample size. The SPlus Statistical Package become the most popular analysis tools that has been used for a lot of proposed techniques.
Table 2: Review on Outliers Identification in Univariate Circular Biological Data Using Numerical Method
| Biological Data (Ecological Data) | Model Distribution | Outliers Identification Methods | Strength | Weakness | Analysis tools | References |
| Frog – homing ability of the northern cricket frog, Acris Crepitans. | Von Mises (VM) model |
L Statistic (LRT Statistic): based on maximum likelihood ratio. C Statistic: based on sample mean resultant length. D Statistic: based on relative arc lengths. M’ Statistic: adaptation from Mardia (M) Statistic. |
For large values of κ, M Statistic is better and formed asymptotic distribution. Small sample size better to use C and D statistics. D statistic is easier to calculate than C Statistic. |
There was no discussion on how to identify an outlier when the sample size is large and when it has multiple outliers. | Not Mention |
[27]
|
| Frog – homing ability of the northern cricket frog, Acris Crepitans. | Von Mises (VM) model |
One spurious observation
|
Proposed method may indicate whether the data implies the presence of more than one spurious observation using the subsequent probabilities of sets of m spurious observations. Extremely potent method in identifying outliers for small samples. |
Too sensitive to small data, most of the result detect more than one spurious observation, therefore need to be validate more. | Not Mention | [25] |
| Frog – homing ability of the northern cricket frog, Acris Crepitans. | Von Mises (VM) model |
A Statistic: based on the summation of circular distances between circular observations.
|
Perform well in detecting outlier especially for sample size of 10 and above. An alternative test of discordance in the circular sample using the maximum likelihood method, especially with the known of estimated κ |
The result not accurate when sample size is small. | Statistical package: SPlus | [35] |
Table 3: Review on Outliers Identification in Univariate Circular Biological Data Using Numerical Method
| Biological Data (Ecological Data) | Model Distribution | Outliers Identification Methods | Strength | Weakness | Analysis tools | References |
| Frog – homing ability of the northern cricket frog, Acris Crepitans. | Von Mises (VM) model |
A Statistic: based on the summation of circular distances between circular data. Chord Statistic: based on the summation of the chords’ length between the circular observations. |
A and Chord statistics have similar performance but perform better than the other tests (C, D, M tests) of discordancy in a circular data set. The proposed statistics are simple and easy to interpret by practitioners.
|
The test not been done for small κ. All the successful test presented only done by a large κ. | Statistical package: SPlus | [24] |
| Frog – homing ability of the northern cricket frog, Acris Crepitans. | Von Mises (VM) model | An alternative test of discordance: proposed based on the circular distance between sample points. |
It enables users to detect outliers in univariate and bivariate data. It can be used for large sample sizes. |
The propose method did not evaluate their statistic by comparing with others any statistical measures. | Statistical package: SPlus | [16] |
| Frog – homing ability of the northern cricket frog, Acris Crepitans. | Von Mises (VM) model |
A Robust Circular Distance (RCDu) Statistic.
|
Triple measures of robustness to evaluate the proposed method: · Proportion of outliers detected. · Rate of masking. · Rate of swamping. A high proportion of outliers detected, and low masking and swamping rates, are always considered to be good robustness properties for any outlier detection statistic. Able to detect outliers in data with a high level of contamination. Successful in detecting outliers in a large data set. |
The performance of the RCDu statistic is relatively low for small values of κ because the circular data is more widely distributed around the circumference of the circle for low values of the κ. | Statistical package: R codes | [23] |
Table 4: Review on Outliers Identification in Univariate Circular Biological Data Using Numerical Method
| Biological Data (Ecological Data) | Model Distribution | Outliers Identification Methods | Strength | Weakness | Analysis tools | References |
| Sea stars directions – after they were displaced from their natural habitat. | Von Mises (VM) model | Mn Statistic: based on resultant lengths -adaptation from [22] | Mn performed better than Q-Q plot, suitable for small sample size and for a single outlier. | Cannot detect multiple outliers and not suitable for large sample sizes. | Not Mention | [32] |
| Sea stars directions – after they were displaced from their natural habitat. | Von Mises (VM) model | Adjust Outlier: based on circular distance between the circular data points and the circular mean direction |
The procedure decreases the bias of both the circular mean and the κ values. The procedure provides results of the mean resulting length as close as clean data results and minimizes MCD (Mean Circular Distance) with low and high contamination levels. Successful for various sample sizes. |
The performance not yet been tested with other methods such as L, C, D statistics. | Not Mention | [15] |
| Pigeons- Vanishing angles of pigeons once released. | Symmetric Wrapped Stable (SWS) and Circular Uniformity (CU) mixture model |
Locally Most Powerful Invariant (LMPI) Statistic
|
Applied this test in two cases: 1. When location parameter μ; µ0, µ1, and κ are all known. 2. When only κ is known. Best performing when small values of µ1.
|
Did not propose a way to test circular data if κ is unknown.
|
Statistical package: SPlus | [14] |
| Likelihood Ratio Testing (LRT) Statistic | The LRT performs best for moderate values of µ1. |
Very computation-intensive and hard to apply as they can’t be written in any closed form. The exact LRT statistic distribution is intractable. |
||||
| Jander’s ant data – orientation of ants towards a black target when released in a round arena. | SWS-CU mixture model | Locally Most Powerful Invariant (LMPI) Statistic | Easy to obtain and, as is seen, enjoy nice properties, namely monotonicity of the power function and consistency. | Small departures from the null hypotheses are difficult to detect while large departures can be easily detected by any reasonable test. | Statistical package: DDSTAP by [37] | [36] |
Table 5: Review on Outliers Identification in Circular Biological Data Using Biomedical Data
| Biological Data (Biomedical Data) | Model Distribution | Outliers Identification Methods | Strength | Weakness | Analysis tools | References |
| Eye data set obtained from a glaucoma patient. | Von Mises (VM) model (for univariate circular data) | Ga Statistic: based on the spacing theory in circular data |
Identification of a patch of two outliers in the data successfully. Expected to improve performance when using a robust approach that warrants further investigation. |
Application for multiple outliers is difficult. The swamping rates are relatively high in identifying error as outliers. |
Statistical package: SPlus | [38] |
| Eye data set obtained from a glaucoma patient. | Multiple Circular Regression (MCR) model | COVRATIO Statistic: determinant of the covariance matrix | Clearly favorable and are showing good performance in identifying outliers in MCR model, even though it was extended from a linear regression model. | Detect one single outlier at one time. | Not Mention | [9] |
| Eye data set obtained from a glaucoma patient. | Multiple Circular Regression (MCR) model | DFBETAc Statistic (extended from DFBETAS Statistic): based on row deletion approach | Performed well and more accurate when parameters estimation become smaller after removing the outliers. | Regression model needs to refit in order to get accurate parameter estimations. | Not mention | [8] |
| Circadian data | DM Circular Regression model |
DMCEs statistic: based on row deletion approach
|
Good performance when κ value is large. Performs better for larger sample size. |
Performance not much clearly small κ and when sample size is small. | Not Mention |
[10]
|
7. Conclusion
In conclusion, outliers detection method for univariate circular biological data has been transform a lot. The graphical techniques are good in detecting outliers when both the sample size, n and the value of concentration parameter, κ are larger. Meanwhile, the numerical techniques that based on the maximum likelihood ratio, mean resultant length, arc lengths, circular distances and chord lengths as its mainly parameters have been used to identify outliers for univariate circular biological data. Circular distance was widely used, and few methods has been proposed either to detect, adjust or remove the outliers. However, the numerical method mostly focused on identifying a single outlier at one time only. Other techniques such as clustering has been used recently for detecting outliers in circular regression models [22,40,41]. Hence, clustering also can be as one other alternative that can be explored to detect outliers in univariate circular biological data.
Currently, most of the outliers detection methods proposed in literature have been applied to study animal orientation data that follows Von Mises Distribution Model. Only few studies on outliers detection for biomedical data such as using spacing theory [38], and row deletion approach [8,10] are used. Therefore, more modern approaches can be explored to identify outliers in circular biological data especially in biomedical study such as 3D analysis [21], computer simulation and statistical modeling [42]. Finally, analysis tools that mostly used for univariate circular biological data analysis are SPlus and R Codes statistical packages. Thus, we can explore other analysis tools such as Python and MatLab, since circular package can also be found in both tools.
Acknowledgment
Authors would like to thank all the associate editors and referees for their thorough reading and valuable suggestions which led to the improvement of this paper. The Universiti Malaysia Pahang is acknowledged for the financial support received for this study (RDU190363).
- H. Oulhaj, M. Rziza, A. Amine, H. Toumi, E. Lespessailles, R. Jennane, E. M. Hassouni, “Trabecular bone characterization using circular parametric models” Biomed. Signal Proces, 33, 411–421, 2017. https://doi.org/10.1016/j.bspc.2016.10.009
- J-D. Janßen, T. Schanze, “Analysis and classification of ECG-waves and rhythms using circular statistics and vector strength” Current Directions in Biomedical Engineering, 3(2): 91–94, 2017. https://doi.org/10.1515/cdbme-2017-0020
- L. Rivest, T. Duchesne, “A general angular regression model for the analysis of data on animal movement in ecology” Appl. Statist., 65, 445–463, 2016. https://doi.org/10.1111/rssc.12124
- N. I. Fisher, A. J. Lee, “Regression Models for an Angular Response” Biometrics, 48, 665, 1992. https://doi.org/10.2307/2532334
- I. B. Mohamed, A. Rambli, N. Khaliddin, A. Ibrahim, “A New Discordancy Test in Circular Data Using Spacings Theory” Commun. Stat. Simulat., 45, 2904–2916, 2015. https://doi.org/10.1080/03610918.2014.932799
- P. Sondag, L. Zeng, B. Yu, R. Rousseau, B. Boulanger, H. Yang, S. Novick, “Effect of a statistical outlier in potency bioassays” Pharm. Stat., 17, 701–709, 2018. https://doi.org/10.1002/pst.1893
- J. F. Walker, J. W. Brown, S. A. Smith, “Analyzing Contentious Relationships and Outlier Genes in Phylogenomics” Syst. Biol., 67(5), 916–924, 2018. https://doi.org/10.1093/sysbio/syy043
- N. A. Alkasadi, A. H. M. Abuzaid, S. Ibrahim, M. I. Yusoff, “Outliers Detection in Multiple Circular Regression Model via DFBETAc Statistic” Int. J. Appl. Eng. Res., 13(11), 9083–9090, 2018.
- N. A. Alkasadi, S. Ibrahim, M. F. Ramli, M. I. Yusoff, “A comparative study of outlier detection procedures in multiple circular regression” AIP Conf. Proc., 1775, 2016. https://doi.org/10.1063/1.4965152
- A. Rambli, A. H. M. Abuzaid, I. B. Mohamed, A. G. Hussin, “Procedure for Detecting Outliers in a Circular Regression Model” PLoS One, 11(4), 2016. https://doi.org/10.1371/journal.pone.0153074
- K. V.Mardia, C. C. Taylor, G. K. Subramaniam, “Protein Bioinformatics and Mixtures of Bivariate von Mises Distributions for Angular Data” Biometrics, 63(2), 505–512, 2007. https://doi.org/10.1111/j.1541-0420.2006.00682.x
- A. Rambli, S. Ibrahim, M. I. Abdullah, A. G. Hussin, I. Mohamed, “On Discordance Test for the Wrapped Normal Data” Sains Malaysiana, 41(6), 769-778, 2012.
- A. SenGupta, A. K. Laha, “Theory & Methods: The Slippage Problem for the Circular Normal Distribution” Aust. N. Z. J. Stat., 43(4), 461–471, 2001. https://doi.org/10.1111/1467-842X.00194
- S. R. Jammalamadaka, A. SenGupta, Topics in Circular Statistics, World Scientific, 2001.
- E. A. Mahmood, S. Rana, A. G. Hussin, H. Midi, “Adjusting Outliers in Univariate Circular Data” Pertanika J. Sci. Technol., 25(4), 1147–1158, 2017.
- A. H. Abuzaid, A. G. Hussin, A. Rambli, I. Mohamed, “Statistics for a New Test of Discordance in Circular Data” Commun. Stat. Simul. Comput., 41(10), 1882–1890, 2012. https://doi.org/10.1080/03610918.2011.624239
- M. D. Marzio, S. Fensore, A. Panzera, C. C. Taylor, “Circular local likelihood” Test, 27, 921–945, 2018. doi:10.1007/s11749-017-0576-9
- S. Kim, A. SenGupta, “ Multivariate-multiple circular regression” J. Stat. Comput. Simul., 87(7), 1277–1291, 2017. https://doi.org/10.1080/00949655.2016.1261292
- J. Jha, A. Biswas, “Circular-circular regression model with a spike at zero” Stat. Med., 37(1), 71–81, 2018. https://doi.org/10.1002/sim.7496
- A. Roy, A. Pal, U. Garain, “JCLMM: A finite mixture model for clustering of circular-linear data and its application to psoriatic plaque segmentation” Pattern Recogn., 66, 160–173, 2017. https://doi.org/10.1016/j.patcog.2016.12.016
- H. A. Hasan, M. K. Alam, A. Yusof, S. Matsuda, M. Shoumura, N. Osuga, “Accuracy of Three Dimensional CT Craniofacial Measurements Using Mimics and InVesalius Software Programs” J. Hard Tissue Biol., 25, 219–224, 2016. https://doi.org/10.2485/jhtb.25.219
- S. Z. Satari, “Parameter Estimation and Outlier Detection for some Types of Circular Model,” Ph.D Thesis, University of Malaya, 2015.
- E. A. Mahmood, S. Rana, H. Midi, A. G. Hussin, “Detection of Outliers in Univariate Circular Data using Robust Circular Distance” Journal of Modern Applied Statistical Methods, 16(2), 418-438, 2017. doi: 10.22237/jmasm/1509495720
- A. H. Abuzaid “Some Problems of Outliers in Circular Data,” Ph.D Thesis, University of Malaya, 2010.
- P. Bagchi, I. Guttman, “Spuriosity and outliers in directional data” J. Appl. Stat., 17(3), 341–350, 1990. https://doi.org/10.1080/02664769000000006
- K. V. Mardia, P. E. Jupp, Directional Statistics, John Wiley and Son, 2000.
- D. Collett, “Outliers in Circular Data” J. Appl. Stat., 29(1), 50–57, 1980. https://doi.org/10.2307/2346410
- P. Fernandez-Gonzalez, C. Bielza, P. Larrañaga, “Univariate and bivariate truncated von Mises distributions” Progress in Artificial Intelligence, 6(2), 171–180, 2017. https://doi.org/10.1007/s13748-016-0109-x
- L. Zhang, J. J. Zhang, R. J. Kubiak, H. Yang, “Statistical methods and tool for cut point analysis in immunogenicity assays” J. Immunol. Methods, 389, 79–87, 2013. https://doi.org/10.1016/j.jim.2012.12.008
- R. J. Kubiak, J. Zhang, P. Ren, H. Yang, L. K. Roskos, “ Excessive outlier removal may result in cut points that are not suitable for immunogenicity assessments” J. Immunol., 463, 105–111, 2018. https://doi.org/10.1016/j.jim.2018.10.001
- S. Rana, E. A. Mahmood, H. Midi, A. G. Hussin, “Robust Detection of Outliers in Both Response and Explanatory Variables of the Simple Circular Regression Model” J. Math. Sci., 10(3), 399–414, 2016.
- N. I. Fisher, Statistical analysis of circular data, Cambridge: Cambridge University Press, 1993.
- A. H. Abuzaid, I. B. Mohamed, A. G. Hussin, “Boxplot for circular variables” Comput. Stat., 27 381–392, 2012. https://doi.org/10.1007/s00180-011-0261-5
- D. E. Ferguson, H. F. Landreth, J. P. McKeown, “Sun compass orientation of the northern cricket frog, Acris crepitans” Anim. Behav., 15(1), 45-53, 1967. https://doi.org/10.1016/S0003-3472(67)80009-5
- A. H. Abuzaid, I. B. Mohamed, A. G. Hussin, “A New Test of Discordancy in Circular Data” Commun. Stat. Simul. Comput., 38(4), 682–691, 2009. https://doi.org/10.1080/03610910802627048
- A. Sengupta, C. Pal, “ On optimal tests for isotropy against the symmetric wrapped stable-circular uniform mixture family” J. Appl. Stat., 28(1), 129–143, 2001. https://doi.org/10.1080/02664760120011653
- A. SenGupta, DDSTAPÐ Statistical package for the analysis of directional data, Applied Statistics Division Calcutta: Indian Statistical Institute, 1998b.
- I. B. Mohamed, A. Rambli, N. Khaliddin, A. I. N. Ibrahim, “New Discordancy Test in Circular Data Using Spacings Theory” Commun. Stat-Simul C, 45(8), 2904–2916, 2016. https://doi.org/10.1080/03610918.2014.932799
- K. V. Mardia, “Statistics of Directional Data”, J. R. Statist. Soc., 37(3), 349–393, 1975. https://doi.org/10.1111/j.2517-6161.1975.tb01550.x
- N. F. M. Di, S.Z. Satari, R. Zakaria “Outlier Detection In Circular Regression Model Using Minimum Spanning Tree Method” J. Phys. Conf. Ser. 1366 012102, 2019. https://doi.org/10.1088/1742-6596/1366/1/012102
- S.Z. Satari, N. F. M. Di, R. Zakaria. “Single-linkage Method to Detect Multiple Outliers with Different Outlier Scenarios in Circular Regression Model” AIP Conference Proceedings 2059, 020003, 2019. https://doi.org/10.1063/1.5085946
- J. Jin, Evaluation System for Craniosynostosis Surgeries with Computer Simulation and Statistical Modelling, The University of Western Ontario, 2016.