A Regenerative Energy Recovery System for Electric Vehicles Charging A Battery at A Low Speed

Adv. Sci. Technol. Eng. Syst. J. 5(2), 64–73 (2020);
 DOI: 10.25046/aj050208
In this paper, a regenerative energy recovery system for electric vehicles charging a battery at a low speed is proposed. When a permanent magnet synchronous motor driving the electric vehicles is driven by a generator, the generated voltage is controlled to rise or drop by using the L-C resonance circuit. As the circuit only has three capacitors and three IGBTs, the proposed system is very simple. A resonance frequency is found through frequency analysis of the L-C resonance circuit; furthermore, using the resonance effect, a generated voltage control algorithm is proposed. PI duty control in the algorithm raises the generated voltage and reverse PI duty control in the algorithm reduces the generated voltage. The results of simulations and experiments confirm that a remodeled electric vehicle by the proposed system is charged to the driving battery. The results also demonstrate that a small energy storage capacity, which is a disadvantage of the electric vehicle, is largely compensated without increasing the complexity of the electric vehicle.
1. Introduction
Due to emitting zero greenhouse gas, electric vehicles (EVs) are completely eco-friendly [1]. In addition, heat loss of a motor in EVs is very low as compared to that of internal combustion engines, so a high driving efficiency can be expected. Accordingly, the interest in the EVs that can solve the problems of internal combustion engine cars has been increasing worldwide. However, energy storage capacity of batteries, energy storage devices of EVs, is significantly smaller as compared to that of internal combustion engines [1,2]. Therefore, commercialization of EVs requires that EVs have efficient use and management of energy.
The main components of an EV include inverter, cluster, battery, driving motors, and battery management system (BMS) (see Figure 1). Due to the characteristics of the EVs, the most driving motor is a permanent magnet synchronous motor (PMSM) which has a high starting torque and a high efficiency [3,4]. To briefly describe each component, the battery is an energy storage device for driving EVs, while the BMS protects the battery and is a system for efficient energy use and charging [5]. The inverter converts DC voltage into AC voltage, while the PMSM generates driving force by using the converted AC voltage. When the PMSM operates as a generator, back EMF of the PMSM is converted from AC voltage to DC voltage through freewheeling diodes of the inverter [5].
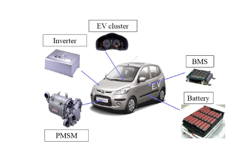 Figure 1: Main components of EVs
The PMSM may be operated as the generator when driving downhill or in coasting operation. The generated electrical energy can be used in two ways. Firstly, a method commonly called a dynamic braking consumes electric energy with resistances mounted in the EVs or eddy currents. However, a disadvantage of this method is an increase of heat inside, because electric energy dissipates into heat energy [6-8]. Secondly, a method called the regenerative energy recovery returns the generated electrical energy to the power supply system [6]. Therefore, the small energy storage capacity, which is the disadvantage of the EVs, can be compensated by using a regenerative energy recovery system (RERS) [5].
The conventional RERS recovers small energy. It increases the complexity of the EV system by using a DC/DC converter to charge the regenerative energy into supercapacitors. [5,6,9]. In addition, a maximum energy recovery switching scheme is developed [6]. This system is charging supercapacitors using switches at the bottom of the inverter. At present, several RERS studies are underway.
In this paper, a very simple new RERS charged in a driving battery with a high capacity and a high nominal voltage through a L-C resonance circuit in EVs is proposed. As the circuit has only three capacitors and three IGBTs, the proposed system is simple. The proposed system is then analyzed by simulations using Matlab Simulink and experiments using a remodeled commercial EV.
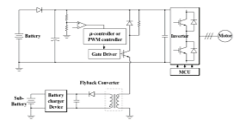 Figure 2: Regenerative energy control device for the motor driving system (Korean Patent)
2. Conventional RERS
An example of the RERS is shown in Figure 2. The battery on the upper side is used for the driving motor on the right. The flyback DC/DC converter is used to reduce the generated voltage of the motor [5]. The reduced voltage charges a sub-battery of a low capacity and a low nominal voltage. There are three disadvantages to this method. Firstly, it can be used only when the generated voltage is higher than chargeable voltage. Secondly, it cannot be used in the EV without the sub-battery. Thirdly, the regenerative power is small and has a small braking force, because it is charged in the sub-battery of a low capacity.
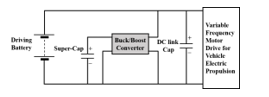 Figure 3: RERS using a supercapacitor
An example of the RERS using the supercapacitors is shown in Figure 3 [10]. When braking, the energy is charged in the supercapacitor using the buck converter and, when driving, the energy is discharged in the supercapacitor using the boost converter. Depending on the type of the RERS, the energy stored in the supercapacitor is either used directly for driving or is charged by the battery [6,10,11]. The use of DC/DC converters increases the complexity of the EV.
On the other hand, the proposed system has two advantages over the system shown in Figure 2. The first advantage is that even if the generated voltage is lower than the chargeable voltage, charging is possible by controlling the voltage through the L-C resonance control technology. Furthermore, the second advantage is that sufficient regenerative energy can be obtained because the proposed system is charging the driving battery instead of the sub-battery. Compared to the system in Figure 3, the proposed system is advantageous in the EV complexity due to its simple hardware configuration.
3. Proposed RERS Analysis
3.1. Simple Hardware Structure
Figure 4 shows a conceptual diagram of the proposed RERS. As shown in Figure 4, since the DC link voltage is short-circuited with the driving battery, the driving battery is charged only when the DC link voltage is upper than the driving battery. However, if the DC link voltage is higher than the maximum voltage of the driving battery, the BMS disconnects the driving battery to protect the battery. Therefore, the driving battery can be charged only when magnitude of the DC link voltage is within a certain range depending on the driving battery condition. In order to control DC link voltage, capacitors of are used to generate resonance in a circuit consisting of inductors and resistors of the PMSM, and a resonance rate is changed by three IGBTs above the capacitors [5]. For the purpose of three-phase equilibrium, the capacitance of is selected equally even in the resonance.
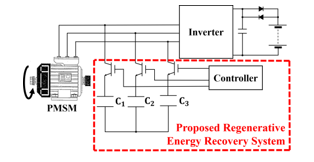 Figure 4: Conceptual diagram of the proposed system
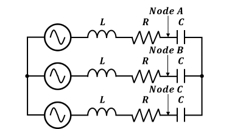 Figure 5: PMSM equivalent circuit for L-C resonance
3.2. Resonance Frequency Analysis
Figure 5 shows a PMSM equivalent circuit for L-C resonance. The and the are equivalent phase leakage inductance and resistance of the PMSM, and voltage sources are a three-phase voltage source generated by the PMSM. The DC link voltage varies in proportion to the voltage of nodes A, B, and C. The resonance is caused by using the capacitors in each phase for varying the voltages at nodes A, B, and C. As the circuit is a balanced three-phase circuit, the nodes A, B, and C all have same equivalent impedance. The equivalent impedance of each node is obtained as shown in Equation (1).
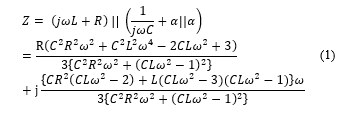
 where is an electrical angular frequency. The frequency at which the imaginary part of the impedance is zero and the voltage response is the largest is a resonance frequency. There are five solutions where the imaginary part becomes zero, because degree of is five. The solutions are shown in Equation (2).
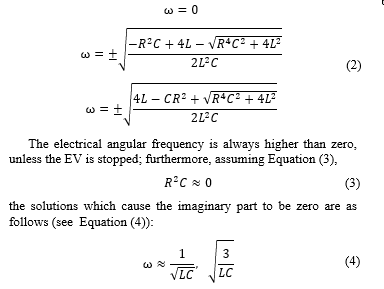
Among the two frequencies, the frequency with a larger voltage response is the resonance frequency. The resonance frequency is selected considering the vehicle’s main speed, wheel radius, gear ratio, number of poles [5]. The speed of the motor is 1km/h and the electric frequency of the motor to match the resonance frequency is : fe=1km/1h*1h/3600sec*1000m/1km *1/2πrm*poles/2*gear ratio. The capacitance is calculated from this electric frequency(fe) and equation (4) [5]. In order to achieve the resonance effect frequently, it is advantageous to match the main driving speed of the vehicle with the resonance frequency.
3.3. Generated Voltage Control Algorithm
A flow chart of the generated voltage control algorithm is shown in Figure 6. The flow chart shows a method of controlling the DC link voltage to the suitable voltage for the driving battery charging according to the condition of the DC link voltage. If there is no a wide gap between the DC link voltage and flag voltage , voltage control is possible by the resonance rate. Therefore, the is compared with the minimum controllable voltage and the maximum controllable voltage . If the is between the and the , compare with the . If the is higher, a reverse PI duty control is performed. A pulse width modulation of 1kHz is then generated through a pulse generator and used as IGBT gate input signals. There are the three IGBTs in the proposed RERS in Figure 4. In the opposite case, the PI duty control is performed.
The reverse PI duty control in the proposed system sets P gain and I gain to negative values, and the PI duty control sets P gain and I gain to positive values. Therefore, the PI duty control increases the duty, as the difference of DC link voltage at the reference voltage increases, and the reverse PI duty control decreases the duty. The adjusted duty increases or decreases the DC link voltage to match the reference voltage.
If the reference voltage of the PI duty control and the reference voltage of the reverse PI duty control are equal to , the ripple of the makes comparison between and very difficult. Therefore, the is set above the and below the battery maximum voltage and the is set below the .
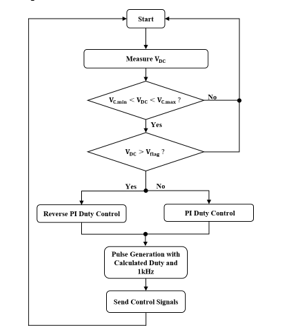 Figure 6: Flow chart
4. Simulations
Three simulations have been performed. First, a simulation of frequency response has been performed. Characteristic of frequency response is that the equivalent circuit of a PMSM’s stator is taken into account. The second simulation has been performed to verify the generated voltage control algorithm. The characteristic to verify the generated voltage control algorithm is that the DC link voltage response is fast because of low inertia, low viscous friction and short battery response time. Using this fast response, the proposed system algorithm is verified. The third simulation has been performed taking into account the remodeled commercial EV. The characteristics considered the EV are that the DC link voltage response is slow, because the EV has high inertia, high viscous friction, and long battery response time.
4.1. Frequency Response of Equivalent Circuit
If the main driving speed of the car is set to 42km/h, the electric frequency of the motor is about 288Hz. And if the resonance frequency in Figure 5 is determined as 288Hz and using Equation (2), the R and the L are substituted for the parameters of Table 1, the capacitance is computed to 250 F. Using Equation (1), Figure 7 shows the real part and the imaginary part of equivalent impedance according to frequency in Figure 5. The frequencies which cause the imaginary part to be zero are 288Hz and 499Hz.
Table 1: 3kW PMSM Parameters Used for the Remodeled Commercial EV
| Parameter | Value | Unit |
| Rated Power | 3 | |
| Rated Current | 17.2 | |
| Rated Speed | 3000 | |
| Rated Torque | 9.54 | |
| Stator Phase Resistance | 0.102 | |
| Stator Phase Inductance | 1.22 | |
| Poles | 8 | – |
| Inertia | 0.28 | |
| Viscous friction | 0.026 |
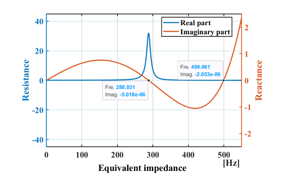 Figure 7: Frequency response of PMSM equivalent circuit for L-C resonance
The simulator for the frequency response with the capacitors and without the capacitors is shown in Figure 8. If capacitors in a red box in Figure 8 is removed, the simulator is a common 3-phase rectifier circuit. The opposite case is the L-C resonance circuit. This simulator can find the resonance frequency, which is either 288Hz or 499Hz, and also shows the resonance effect.
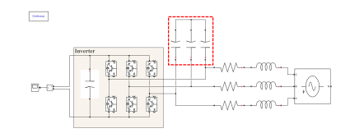 Figure 8: Simulator for frequency response
In this simulation, the DC link voltage for frequency is shown in Figure 9. The frequency of the highest voltage response is 288Hz in the L-C resonance circuit. Therefore, the resonance frequency is 288Hz. From 1Hz to 416Hz, the DC link voltage of the circuit with the capacitors is higher than the DC link voltage of the circuit without capacitors. In addition, after 416Hz, the DC link voltage of the circuit with the capacitors is lower than the DC link voltage of the circuit without the capacitors. In PMSM, generated voltage is generally proportional to frequency. When the frequency and generated voltage are low, the generated voltage can be raised using the L-C resonance circuit [5]. In contrast, when the frequency is high, and the generated voltage is high, the generated voltage can be reduced using the L-C resonance circuit. In this way, it is possible to control voltage, since the resonance rate is changed when the capacitors and the IGBTs switching duty are adjusted.
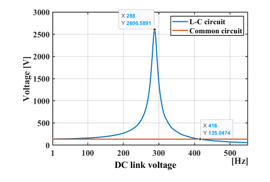 Figure 9: Simulation results of frequency response
4.2. Generated Voltage Control Algorithm Verification
The simulator to verify the generated voltage control algorithm is shown in Figure 10. The parameters used in this simulator are shown Table 2. Due to the high back EMF of the PMSM, RCD snubber is used to reduce the switching stress of the IGBTs. Due to the small inductance of 4.5kW PMSM, voltage rise using resonance is low at the desired speed. To maximize the voltage rise, the inductance (15mH) is added in front of the capacitance (1.25mF).
Table 2: Parameters Used in the Algorithm Verification
| Item | Parameter | Value | Unit |
| PMSM | Rated Power | 4.5 | |
| Rated Current | 17.9 | ||
| Rated Speed | 2000 | ||
| Rated Torque | 21.5 | ||
| Stator Phase Resistance | 0.2 | ||
| Stator Phase Inductance | 2.625 | ||
| Poles | 6 | – | |
| Inertia | 0.00369 | ||
| Viscous friction | 10 | ||
| Driving Battery | Initial SoC | 84 | |
| Rated Power | 3 | ||
| Rated Voltage | 295 | ||
| Maximum Voltage | 340 | ||
| Minimum Voltage | 224 | ||
| Response Time | 30 | ||
| Proposed System | Phase Capacitance | 1.25 | |
| Phase Inductance | 15 | ||
| Snubber Resistance | 500 | ||
| Snubber Capacitance | 4.7 | ||
| 332 | V | ||
| 280 | V | ||
| 400 | V | ||
| 335 | V | ||
| 330 | V |
Simulation results without the algorithm are shown in Figure 11, while simulation results with the algorithm are shown in Figure 12. The torque input from 0 to 15 seconds is -5Nm, and torque input from 15 to 30 seconds is -10Nm. A flag in Figures 11 and 12 is a variable for distinguishing the control (1 : reverse PI duty control, 2 : PI duty control, 3 : no control). In a voltage waveform
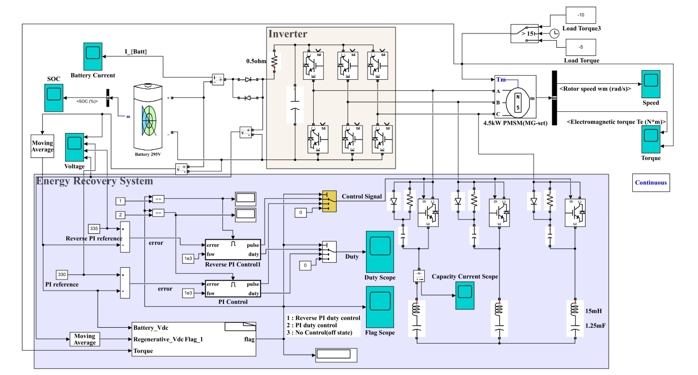 Figure 10: Simulator for the generated voltage control algorithm verification
of Figure 12 from 0 to 15 seconds, the PI duty control (flag 2) is performed, because the is lower than the . In order to raise the generated voltage, the duty ratio of the PI duty controller steady state output is 1. The voltage and current waveforms in Figure 12 are higher than those in Figure 11. In the voltage waveform of Figure 12 from 15 to 30 seconds, the reverse PI duty control (flag 2) is performed, because is higher than . The resonance rate is changed by the reverse PI duty control so that is controlled to in voltage in Figure 12. On the other hand, in the voltage in Figure 11, the battery voltage rises above the battery maximum voltage. In the EV, when the battery voltage rises above the battery maximum voltage, the BMS disconnects the DC link capacitor from the battery. Therefore, battery charge current does not flow when EVs are applied. Because in Figure 12 does not exceed the battery maximum voltage, the battery charge current flows when the proposed system is applied to the EVs.
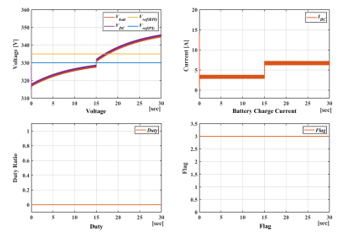 Figure 11: Simulation results without the voltage control algorithm on torque variation
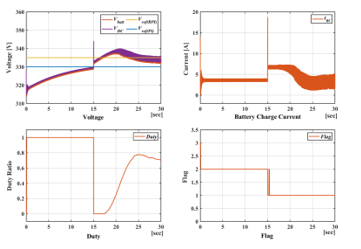 Figure 12: Simulation results without the voltage control algorithm on torque variation
4.3. Energy Recovery Rate Considered the Remodeled EV
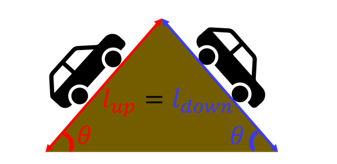 Figure 13: Road environment measured by the energy recovery rate
An energy recovery rate is defined by Equation (5). is battery charge energy, and is battery discharge energy.
![]()
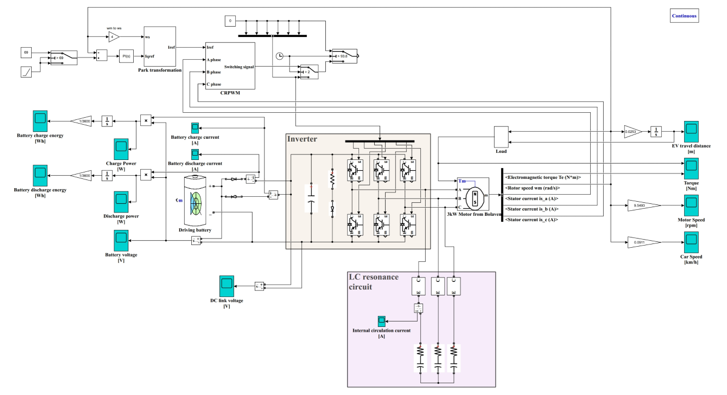 Figure 14: Simulator considered the remodeled commercial EV
Measurement road environment is a road with the same travel distance and the same slope as shown in Figure 13. Since the EV input by the slope is the force of , this torque is put into the mechanical input of the PMSM in the simulation.
Travel distance of the EV is calculated using Equation (6). When the EV moved 150m, PMSM is stopped so that the same travel distance is obtained.
![]() A is the speed of the PMSM (rad/s), the is the gear ratio and is the wheel radius of the EV.
A is the speed of the PMSM (rad/s), the is the gear ratio and is the wheel radius of the EV.
Table 3: Parameters of the Remodeled Commercial EV
| Item | Parameter | Value | Unit |
| Driving Battery | Initial SoC | 10.5 | |
| Rated Power | 3 | ||
| Rated Voltage | 295 | ||
| Maximum Voltage | 340 | ||
| Minimum Voltage | 224 | ||
| Response Time | 500 | ||
| Proposed System | Phase Capacitance | 250 | |
| Power Transmission Device | Gear | 9.3 | |
| Road Environment | Torque | 13.5 | |
| Distance | 150 | ||
| Wheel Radius | 0.235 |
A simulator considered the remodeled commercial EV is shown in Figure 14. Applying the environment in Figure 13, the parameters in Tables 1 and 3 to this simulator, the 3kW PMSM cannot run the high speed needed for the reverse PI duty control. For that reason, only the PI duty control has been performed. Also, due to the slow DC link voltage response, the duty of the PI duty control output is 100%. Therefore, the three IGBTs of the proposed system are replaced by shorting a emitter and a collector. The three IGBTs are short-circuited only in the downhill condition where the PMSM can act as a generator. The resistance of the L-C resonance circuit is equivalent to lead resistance, which is very small. The PMSM is driven by speed control in the uphill condition.
Two simulations considered the remodeled commercial EV have been performed. Firstly, to see change in the generated voltage, existence and non-existence of the proposed system have been simulated after removing the driving battery. Secondly, to see change in the energy recovery rate, existence and nonexistence of the proposed system have been simulated after installing the battery.
The generated DC link voltage and the remodeled EV travel distance after the proposed system is removed are shown in Figure 15 (a). Before connecting the battery, the simulation results in the capacitor model without the battery to see the controllability with the voltage that can be charged to the battery through the proposed system. The generated DC link voltage and the remodeled EV travel distance after the proposed system is installed are shown in Figure 15 (b). The remodeled EV travels the same distance of 150m, but the DC link voltage in Figure 15 (b) nearly doubles as compared to the DC link voltage in Figure 15 (a). The DC link voltage in Figure 15 (a) is always lower than the minimum voltage of the driving battery, so the battery cannot be charged. However, the DC link voltage in Figure 15 (b) can be charged, because there is a section higher than the minimum voltage of the driving battery. At brake points in Figure 15 (a) and Figure 15 (b), a mechanical brake is activated, after which the DC link voltage is reduced.
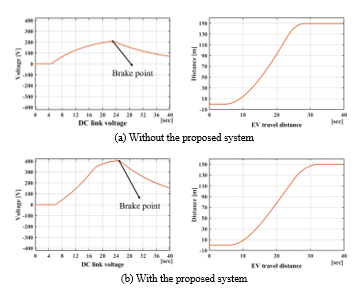 Figure 15: Downhill simulation results without the driving Battery
Battery voltage, discharge current, discharge energy, and the remodeled EV travel distance in the driving uphill condition are shown in Figure 16. In this condition, the driving battery is discharged. 32.8689Wh is consumed while traveling 150m. As the driving battery’s energy is consumed, the battery voltage in Figure 16 decreases. The battery discharge current in Figure 16 is displayed because the remodeled EV is initially driven at the accelerated speed, while the remodeled EV is driven at the constant speed after 18 seconds.
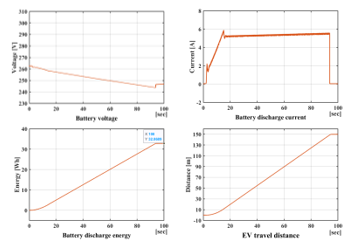 Figure 16: Uphill simulation results with the driving battery
Battery voltage, charge current, charge energy, and the remodeled EV travel distance in the driving downhill condition without the proposed system are shown in Figure 17 (a). Although the remodeled EV traveled 150m, the energy is not recovered, as the generated voltage is lower than the battery voltage.
Battery voltage, charge current, charge energy and remodeled EV travel distance in the driving downhill condition with the proposed system are shown in Figure 17 (b). While the remodeled EV traveled 150m, the energy is recovered because the generated voltage is lower than the battery voltage. Therefore, the battery voltage and the charge current raise. At the brake point, the mechanical brake is activated, after which the battery stops charging. The charged energy in the battery is 4.451Wh. The energy recovery rate is computed to 13.54% using Equation (5).
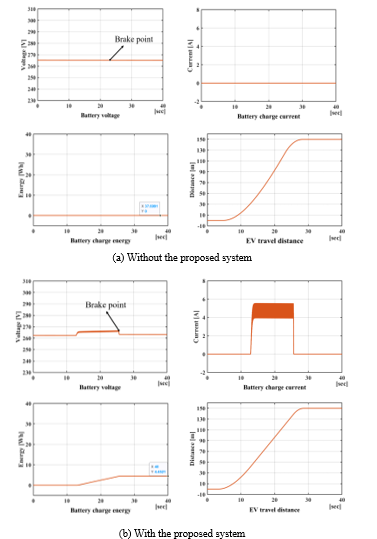 Figure 17: Downhill simulation results with the driving battery
Battery voltage, charge current, charge energy, and the remodeled EV travel distance in the driving downhill condition without the proposed system are shown in Figure 17 (a). Although the remodeled EV traveled 150m, the energy is not recovered, as the generated voltage is lower than the battery voltage.
Battery voltage, charge current, charge energy and remodeled EV travel distance in the driving downhill condition with the proposed system are shown in Figure 17 (b). While the remodeled EV traveled 150m, the energy is recovered because the generated voltage is lower than the battery voltage. Therefore, the battery voltage and the charge current raise. At the brake point, the mechanical brake is activated, after which the battery stops charging. The charged energy in the battery is 4.451Wh. The energy recovery rate is computed to 13.54% using Equation (5).
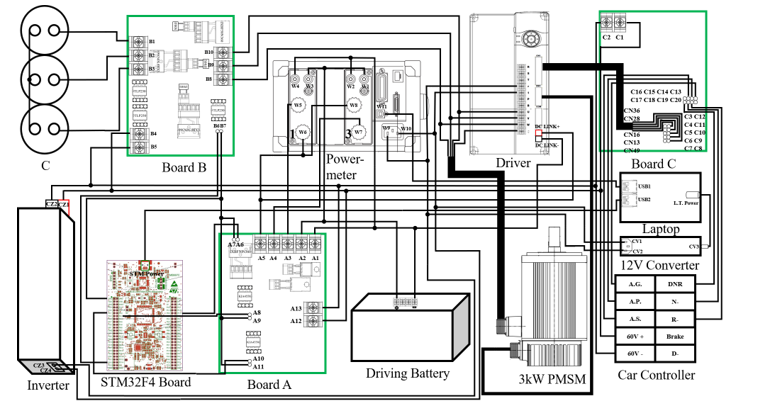 Figure 19: Connection diagram of the remodeled commercial EV
5. Experiment
A small commercial EV has been replaced with the 3kW PMSM, motor driver, gear and driving battery; then the proposed system has been installed in a small commercial EV. Interior and exterior of the remodeled commercial EV are shown in Figure 18. The upper left is a front part of the remodeled EV, while the upper right is a picture of installing the replaced 3kW PMSM. The bottom left shows equipment installed in a back seat of the remodeled EV. This equipment includes a board C for connecting the remodeled EV, motor driver, board A and B for the proposed system, inverter for driving the motor driver, laptop, power meter, and so on. In the bottom right, there are the power meter and laptop for measuring the energy recovery rate, and three capacitors of the proposed system.
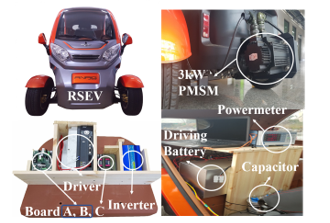 Figure 18: The remodeled commercial EV
A wiring diagram of the equipment has mounted on the remodeled EV is shown in Figure 19. A car controller, which send signals from the remodeled EV, has been connected to the motor driver via the board C.
A map and road at the experimental site place in Figure 13 are shown in Figure 20. Two experiments have been performed. First, to see the change in the generated voltage, existence and nonexistence of the proposed system have been experimented with after removing the driving battery. Second, to see the change in the battery charge energy, existence and nonexistence of the proposed system have been experimented with after installing the driving battery. The parameters used in the experiments are shown in Tables 1 and 3.
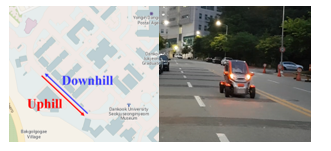 Figure 20: Map and road of the experiment place
In downhill experiments, the low slope of the road cannot output the high speed needed for the reverse PI duty control. For that reason, only the PI duty control has been performed in the experiments. Also, due to the slow DC link voltage response, the duty of the PI duty control output is 100%. Therefore, the three IGBTs of the proposed system have been replaced by shorting a emitter and a collector.
5.1. Energy Recovery Rate Considered the Remodeled EV
Figure 21 shows experimental results without the driving battery. Figure 21 (a) shows DC link voltage without the proposed system and (b) shows DC link voltage with the proposed system. Comparing the (a) and (b) in Figure 21, the DC link voltage almost doubled. The driving battery cannot be charged in Figure 21 (a), because the DC link voltage is always lower than the minimum voltage of the driving battery. However, the DC link voltage in Figure 21 (b) can be charged, because there is a section higher than the minimum voltage of the driving battery. At brake points in Figure 21 (a) and (b), the mechanical brake is activated, after which the DC link voltage is reduced.
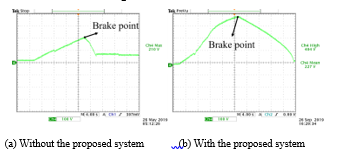 Figure 21: DC link voltage of downhill experiment without the driving battery
Battery voltage, discharge current, discharge power, and discharge energy in the driving uphill condition are shown in Figure 22. As much as the driver activates the accelerator, the battery discharge current and discharge power is shown. 32.878Wh is consumed while traveling 150m. As the driving battery’s energy is consumed, the battery voltage is reduced.
The results on the driving downhill condition without the proposed system are shown in Figure 23 (a). Since the generated DC link voltage is lower than the battery voltage, the energy is hardly recovered.
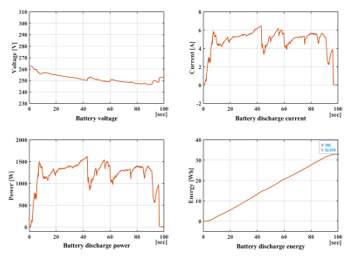 Figure 22: Uphill experiment results with the driving battery
Experimental results for the driving downhill condition with the proposed system are shown in Figure 23 (b). The generated DC link voltage is higher than the battery voltage. Therefore, the energy is charged to the battery, increasing the battery voltage and charge current and showing the charge power in Figure 23 (b). At the brake point in Figure 23 (b), the mechanical brake is activated, after which the generated voltage reduces, and the battery charge stops. The charge energy in the battery is 4.4521Wh. The energy recovery rate is computed to 13.54% using Equation (5). This result complements the small energy storage capacity of the EVs, increasing travel distance on a single charge.
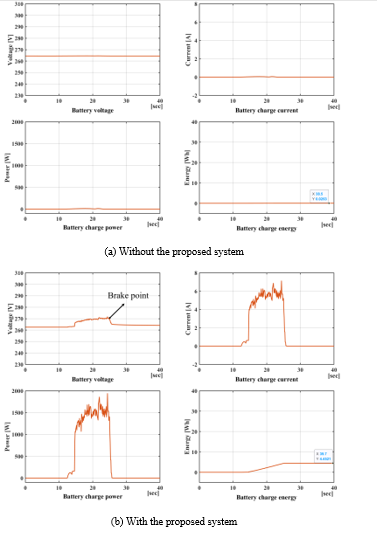 Figure 23: Downhill experiment results with the driving battery
6. Conclusion
In this paper, a very simple new RERS was proposed to complement the EVs with a low energy storage capacity. The conventional RERS uses DC/DC converters to increase the complexity of the EV or has a small recovery area. The proposed system does not increase the complexity of the EVs, as the hardware is very simple. Furthermore, the recovered energy is large, because the generated voltage is controlled to the optimal level for the driving battery.
Three major analyses were performed. Firstly, the proposed system was analyzed. The results of this analysis showed that the circuit is very simple, and resonance frequency was formulated. Secondly, the simulation of the proposed system was performed, which allowed us to test the formulated resonance frequency and the generated voltage control algorithm. In addition, the energy recovery rate amounted to 13.54% in the simulation considering the remodeled commercial EV. Third, the using the remodeled commercial EV was performed. In the experiment, the energy recovery rate amounted to 13.54%. The results showed that the proposed system can very simply significantly compensate for the small energy storage capacity, which is a disadvantage of the EVs.
Acknowledgments
The present research was supported by the research fund of Dankook University in 2020.
- C. C. Chan, “The State of the Art of Electric, Hybrid, and Fuel Cell Vehicles,” in Proceedings of the IEEE, vol. 95, no. 4, pp. 704-718, Apr. 2007. https://doi.org/10.1109/JPROC.2007.892489
- C. Zheng, W. Li and Q. Liang, “An Energy Management Strategy of Hybrid Energy Storage Systems for Electric Vehicle Applications,” in IEEE Transactions on Sustainable Energy, vol. 9, no. 4, pp. 1880-1888, Oct. 2018. https://doi.org/10.1109/TSTE.2018.2818259
- G. Pellegrino, A. Vagati, B. Boazzo and P. Guglielmi, “Comparison of Induction and PM Synchronous Motor Drives for EV Application Including Design Examples,” in IEEE Transactions on Industry Applications, vol. 48, no. 6, pp. 2322-2332, Nov. 2012. https://doi.org/10.1109/TIA.2012.2227092
- J. Nerg, M. Rilla, V. Ruuskanen, J. Pyrhönen and S. Ruotsalainen, “Direct-Driven Interior Magnet Permanent-Magnet Synchronous Motors for a Full Electric Sports Car,” in IEEE Transactions on Industrial Electronics, vol. 61, no. 8, pp. 4286-4294, Aug. 2014. DOI:10.1109/TIE.2013.2248340
- K. Park, S. Jung, S. Kim and J. Ko, “Generated Voltage Control of EV PMSM for Maximizing Energy Recovery Rate using Switched Resonant L-C,” 2019 14th Annual Conference System of Systems Engineering (SoSE), Anchorage, AK, USA, May 2019, pp. 195-199. https://doi.org/10.1109/SYSOSE.2019.8753832
- R. E. Hellmund, “Regenerative Braking of Electric Vehicles,” in Transactions of the American Institute of Electrical Engineers, vol. XXXVI, pp. 1-78, Jan. 1917. https://doi.org/10.1109/T-AIEE.1917.4765458
- Sung-Chul Jung, In-Sik Yoon, and Jong-Sun Ko, “Electromagnetic Retarder´s Power Recovery Device and Voltage Control,” in The Transactions of Korean Institute of Power Electronics, vol. 21, no.5, pp. 396-403, Oct. 2016.
- Sung-Chul Jung, Jong-Sun Ko, “A Study on Electromagnetic Retarders Power Recovery System and Regenerating Voltage Control,” in The Transactions of The Korean Institute of Electrical Engineers, vol. 66, no. 8, pp. 1207-1214, Aug. 2017.
- P. J. Grbovic, P. Delarue, P. Le Moigne and P. Bartholomeus, “The Ultracapacitor-Based Regenerative Controlled Electric Drives With Power-Smoothing Capability,” in IEEE Transactions on Industrial Electronics, vol. 59, no. 12, pp. 4511-4522, Dec. 2012. https://doi.org/10.1109/TIE.2011.2181 129
- S. Lu, K. A. Corzine and M. Ferdowsi, “A New Battery/Ultracapacitor Energy Storage System Design and Its Motor Drive Integration for Hybrid Electric Vehicles,” in IEEE Transactions on Vehicular Technology, vol. 56, no. 4, pp. 1516-1523, July 2007. https://doi.org/10.1109/TVT.2007.896971
- J. Cao and A. Emadi, “A New Battery/UltraCapacitor Hybrid Energy Storage System for Electric, Hybrid, and Plug-In Hybrid Electric Vehicles,” in IEEE Transactions on Power Electronics, vol. 27, no. 1, pp. 122-132, Jan. 2012. https://doi.org/10.1109/TPEL.2011.2151206