
Seismic Response Modification Factor for Special Concrete Structures Based on Pushover & Non-linear Time History Analyses
Volume 5, Issue 1, Page No 436-445, 2020
Author’s Name: Rasha Attia Ahmed Attiaa), Reham Mohamed Galal Ebrahim El-Tahawy, Mohamed Nour El-Din Fayed
View Affiliations
Structural Department, AinShams University, 11311, Cairo, Egypt
a)Author to whom correspondence should be addressed. E-mail: rasha.attia@hotmail.com
Adv. Sci. Technol. Eng. Syst. J. 5(1), 436-445 (2020); ![]() DOI: 10.25046/aj050156
DOI: 10.25046/aj050156
Keywords: Ductility Factor, Pushover analysis, Reduction Modification Factor, Time history analysis

Export Citations
Reinforced concrete (RC) structures are able to dissipate a large amount of energy during earthquake (EQ). RC structures designed to resist EQs must have enough strength and stiffness to prevent any possible collapse as well as to control deflection. Seismic codes include the response reduction/modification factor(R) in calculation of equivalent lateral forces used for EQ resistant buildings design to reduce elastic design spectral acceleration of the RC structure to account for ductility and over strength. Furthermore, the aim of this research is to investigate the variation of seismic response of special RC structures with different configurations, such as elevated metro stations. Consequently, the response reduction factor can be evaluated. Then the calculated response reduction/modification factors (R) for reinforced concrete (RC) structures will be compared to those specified in ECP and the ASCE code. For this purpose, a 3D Finite Element Method was used for modelling RC structure using ABAQUS V.6.14 program.
Received: 01 January 2020, Accepted: 12 February 2020, Published Online: 25 February 2020
1. Introduction
Experience in the past EQs has demonstrated that many typical methods of construction lack basic resistant to EQ forces, so that the concept of EQ design has been developed [1]. The basic approach of EQ design should depend on lateral strength, ductility and deformability capacity of reinforced concrete (RC) structure with specific level of damage while preventing collapse. Therefore, one of the primary tasks of the structural engineer designing an earthquake resistant building is to ensure that the RC building possess enough ductility and strength to resist the expected levels of EQs during its lifetime.
In design codes, Non-linearity of structures in linear analysis is indirectly considered by reducing the seismic demand on RC structures or a (R) factor proportional to the expected ductility of structures. Pushover & non-linear time history analyses could also be performed for better estimate for EQ forces [2].
2. literature Review
A summary of previously available work was conducted on different fields like response reduction/modification factor(R), displacement ductility capacity, ductility, pushover and time history for this study is presented as follows.
- In 2016, The author [3] modeled RC SMRF with medium rise that have irregularity in elevation& plan to evaluate the (R) factor for irregular RC structures using the non-linear static analysis. The results explained that increasing in horizontal & vertical irregularities percentage leads to a smaller value for the (R) factor.
- In 2015, The author [4] modeled two reinforced concrete(RC) frames types, (SMRF) & (OMRF) with a constant number of bays and number of stories (regular RC frame and soft storied frame), mass irregular frame and geometric irregular frames. The results explained that both (SMRF) and (OMRF) failed to reach the target values of (R) factor specified in Indian standards code.
- In 2014, The author [5] evaluated (R) factors of frames from their pushover curves to check its adequacy if compared to the R-value recommended in Indian standards (IS). RC frames with number of stories varying from two to twelve with four bays were analyzed. The aspect ratios of frames evaluated were not the same. The results explained that, over strength factor decreases with increasing in number of stories, (R) factor decrease with increase in a number of stories and Indian standards (IS) code giving conservative value of (R) factor for regular RC frames structures.
- In 2009, The author [6] modeled two RC structures with varying configurations to estimate (R) factor for the RC frames in Pakistan. This research included a different analysis including incremental dynamic analysis and inelastic static pushover. Seven natural records of EQ were selected. This study explained that the analysis of the proposed (R) factor in codes gives a false representation of the structure response during EQs. Also the results explained that the (R) factor mentioned in BCP2007 (UBC 97) or the NESPAK2006 become un-conservative by up to 11% and 22%, respectively.
- In 2008, The author [7] proposed the use of pushover analysis as a method to specify the performance level of a RC structure designed according to the Algerian code. Since behavior of RC structures could be highly inelastic if subjected to lateral loads, plastic yielding effects would conquer the total in-elastic performance of RC constructions.
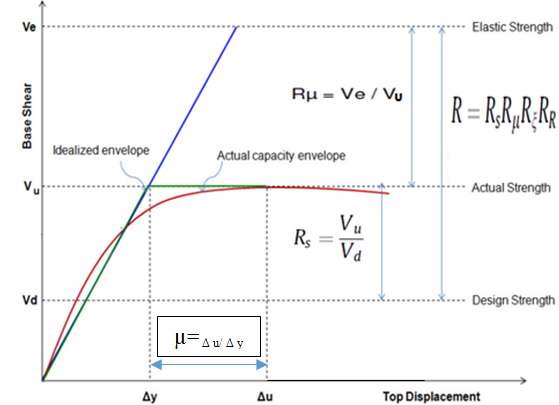
3. Response Reduction Factor
The (R) factor is a measure of the RC structure ductility and over strength in inelastic phase. It also can be expressed as a function of different parameters of RC structural system as damping, ductility, redundancy, and strength as per ATC-19 [8 & 9].
R= RsRμRRRξ (1)
,where (Rs): over strength factor, (Rμ): ductility factor, (Rξ): damping factor.
- The over-strength factor (Rs) is defined in ASCE 7(2008) by the ratio between (Vu) & (Vd), where the design lateral load equal 60% of (Vu) to satisfy the system requirement to remain elastic as suggested by Uang (1991) [10]. Design displacement (Δd) is defined as the displacement corresponding to the design load.
- (Rμ): Ductility factor is a function of μ, for short, intermediate and long period structures is presented below in equation (2) as suggested by Newmark and Hall (1982) [11]:
Short period T < 0.2 seconds Rμ=1
Intermediate period 0.2<T<0.5 seconds
Rμ=√2μ – 1 (2)
Long period T > 0.5 seconds Rμ=μ
- (Rξ): Damping factor balances the effect of supplementary viscous damping and is mainly applicable in case of structures with additional energy dissipating devices. In the absence of such devices, the damping factor is generally assumed as 1.0.
- (Rξ): Redundancy factor depends on the number of vertical elements participating in seismic resistance and can be assumed as unity as per ASCE7 guidelines.
Figure 1 illustrate relationship between (R) factor, over-strength factor (Rs) and ductility factor Rμ; taking RR& Rξ =1
3.1. Response Reduction Factor (R) in ECP and Other International Codes
The (R) factor is assumed to represent ratio between forces that would develop under lateral loads if the framing system was to behave entirely elastically to the prescribed design forces at the strength level. (R) factors are used in current building codes to estimate RC structures strength designed using linear and nonlinear methods. Use of (R) factor has been clarified in the seismic design codes in many parts of the world, which are affected by earthquakes. A brief overview of (R) factor in the design seismic codes of ECP [12] and ASCE [13] for special RC structure is illustrated in the following tables.
i. ASCE (American Society of Civil Engineers)
(R) factor values for RC structures recommended in ASCE-7-10, the (R) defined for cantilever beam supported on RC column systems detailed to conform to the requirements for moment resisting frames, based on special or intermediate or ordinary MRF systems these values are presented in Table 1.
Table 1: R factor in ASCE code
| R factor in ASCE7-10code | ||
| Structural Systems | Type | R |
| (RC)Moment resisting frame | Special | 8 |
| Ordinary | 3 | |
| Intermediate | 5 | |
Table 2: R factor in ECP code
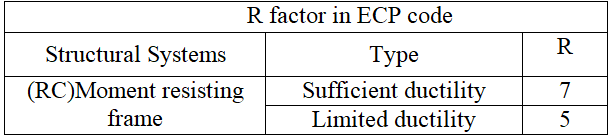
ii. ECP (Egyptian Code of Practice)
ECP code doesn’t specify a unique value for the response reduction factor for special structures like elevated metro stations where the structural system consists of a single column with double cantilevers supporting a multi-story reinforced concrete building. But a table showing R factor for sufficient and non-sufficient can be used in comparison as shown in Table 2.
iii. UBC (Uniform Building Code)
Values of (R) factor for RC structures recommended in UBC code (1997) [14] are presented in Table3.
Table 3: R factor in UBC code
| R factor in ASCE-7-10code | ||
| Structural Systems | Type | R |
| (RC)Moment resisting frame | Special | 8.5 |
| Ordinary | 3.5 | |
4. Non-Linear Numerical Model For RC Structures
4.1. Element Model
ABAQUS V.6.14 program [15] is a finite element package for structural analysis, able to simulate behavior of different types of structures and materials by elements which can be adjusted to fit the geometry of the model. The program offers a wide range of capabilities to solve complex problems in mechanics.
4.2. Material Model
ABAQUS (Hibbitt, Karlsson and Sorensen, 2001) supplies the Concrete Damaged Plasticity (CDP) model for dynamic loading. Tensile & compressive response of concrete can be characterized by CDP in Figure 2.
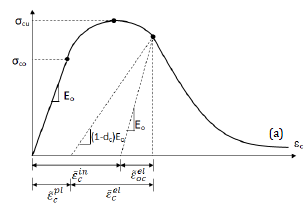
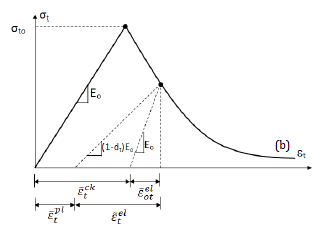
σtt = ( 1 – dt ) EO ( εt – εt≈pl ) (3)
σtc = ( 1 – dc ) EO ( εc – εc≈pl ) (4)
An exponential function has been used to calculate do compression & tension damage, as follows:
dc =1 – (5)
dt =1 – (6)
at and ac are model parameters for uni-axial tension & compression, and can be calibrated from the following conditions:
εcpl = 0 → dc = 0 & εcpl = εcplmax → dc = 1 (7)
εtpl = 0 → dt = 0 & εtpl = εtplmax → dt = 1 (8)
4.3. Model Characterization
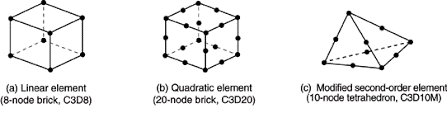
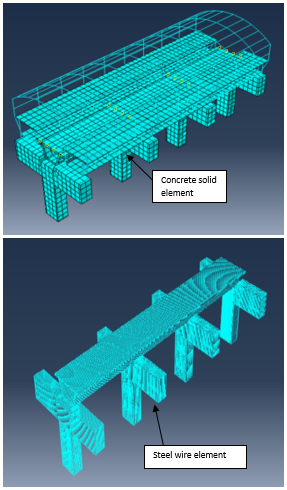
The goal is to establish a simple 3D nonlinear model for RC model. The model employed element C3D20, which is a nonlinear 20-node solid element for concrete and steel rebar’s.
The elements were connected together with appropriate constraints to represent the interaction between various components of the model assembly.
Element size has significant effect on accuracy of finite element results. Two types of mesh elements were used; linear and quadratic, Figure 6 shows that using quadratic meshing made the error smaller due to Small size of FE leads to the smaller error with less computational time.
5. Verification Examples
Two experimental output data for reinforced concrete (RC) frames using pushover and one using time history in order to check reliability and validity of a nonlinear finite element model.
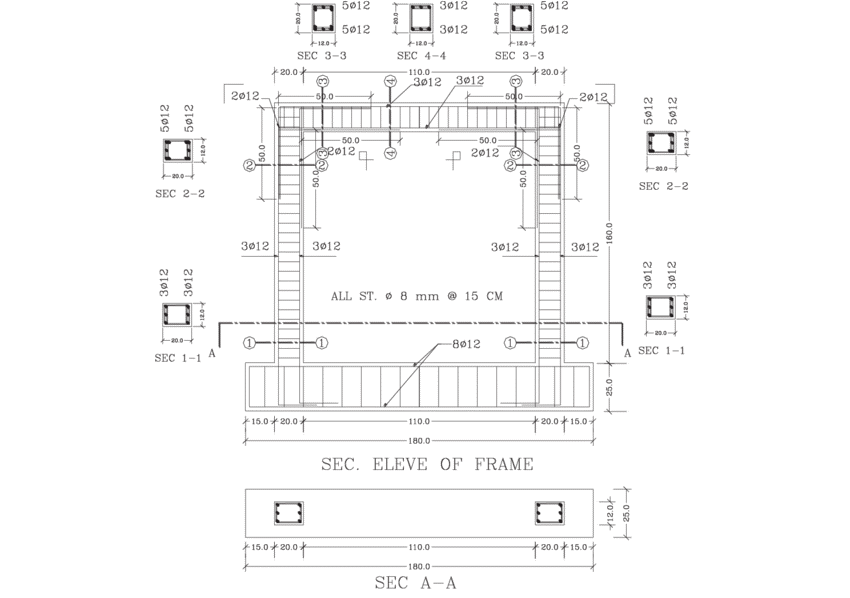
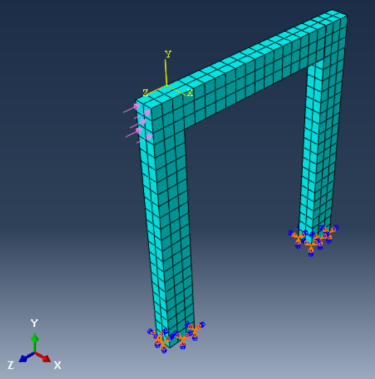
For the numerical Pushover investigation, two reinforced concrete frame specimens experimentally tested by Lila M.Abdel-Hafez et.al. (2015) [17] and Ali Mansouri et al. (2013) [18] under lateral loading were modeled. Figure 4 presents the cross-section details of the tested RC frames and their dimensions. Figure 5 shows the ABAQUS analysis models developed for the tested models respectively. While Figure 6 shows the plastic hinges formation and crushing in concrete for both models.
5.1. Experimental models
- Lila M.Abdel-Hafez et.al. (2015)
- Ali Mansouri et al. (2013)
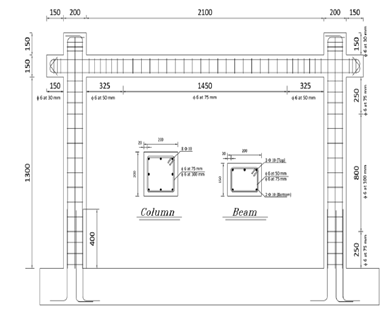
Figure 4: Cross-Sections of the tested RC frames and their dimensions
- Aslan Sadeghi Hokmabadi et, al.(2014)
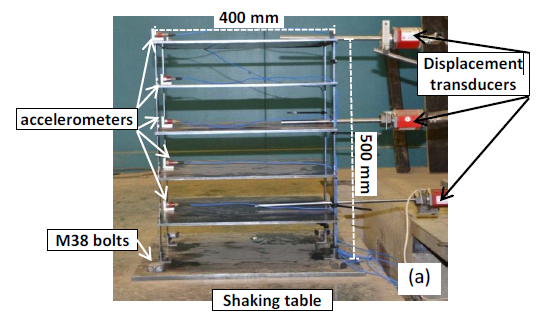
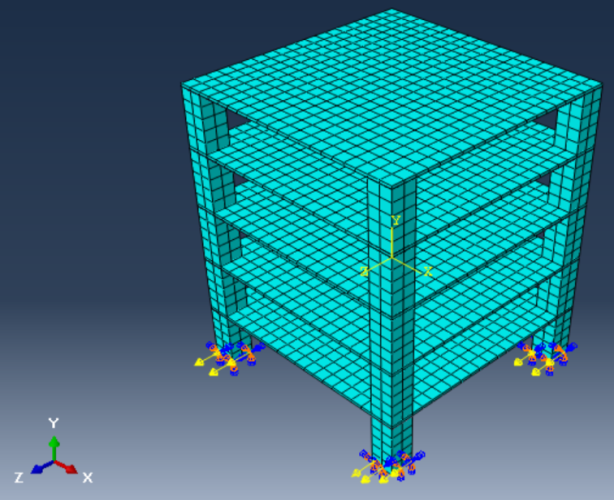
For the numerical nonlinear time history analysis investigation, three records for each were compared by Aslan Sadeghi Hokmabadi (2014) [19]. Figure 7 illustrate the shaking table tests were performed by applying scaled earthquake acceleration records of 1994 Northridge, 1995 Kobe, and 1940 El Centro to the fixed-base structural models. Figure 8 shows the ABAQUS analysis model using time history analysis.
5.2. Evaluation of the Numerical Results
Figure 9 and 10 show that there is a good agreement between the experimental results and the corresponding results from the pushover analysis for tested RC frames. A comparison between analytical & experimental results is presented regarding to pushover curve in Table 4, 5 and the error in results as shown is taken as the ratio between the difference of analytical and experimental result to the experimental value.

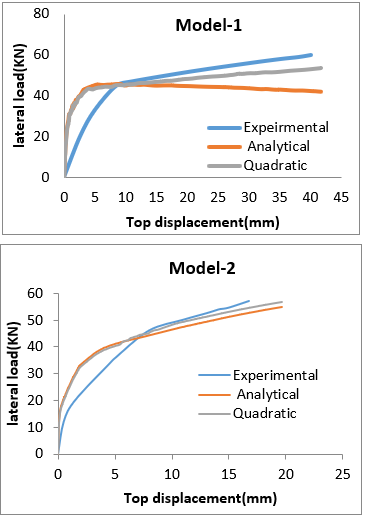
Table 4: Results for the two reinforced concrete (RC) frames specimens
| Model |
Experimental (shear) |
Analytical (shear) | % Error |
| Qult(KN) | Qult(KN) | ||
| 1 | 65 | 55 | 15.3 |
| 2 | 60 | 57 | 5.00 |
| Model |
Experimental (displacemen) |
Analytical (displacement) | % Error |
| Δult (mm) | Δult (mm) | ||
| 1 | 40.07 | 41.70 | 4.07 |
| 2 | 16.8 | 19.53 | 16.2 |
6. Applications for Special Structures, RC Elevated Metro Stations
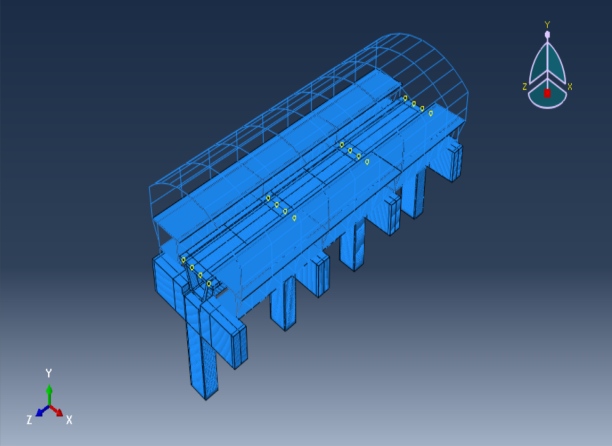
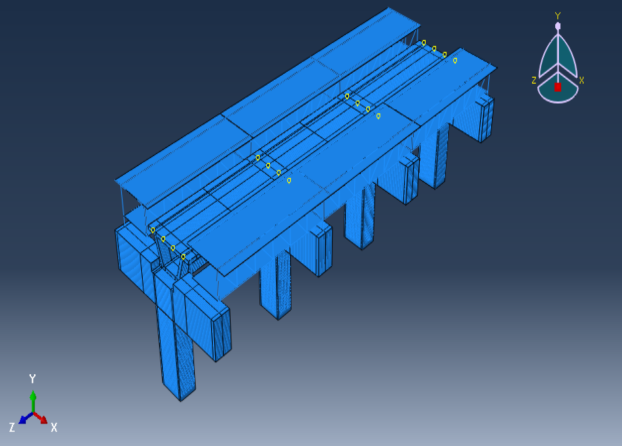
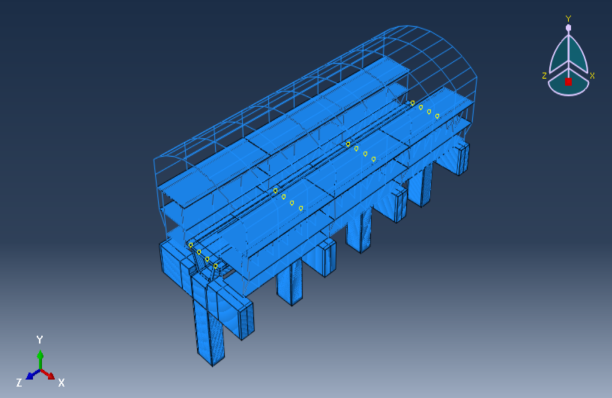
In this study, RC elevated metro station supported on fixed base is utilized to estimate the response reduction/modification factor(R) using time history and static push-over analysis. Estimation of R value in this study depends significantly on how well the non-linear behavior of this RC system is presented in analysis. The selected studied RC metro station and it’s details is shown in Figure 11 and 12. RC elevated metro station is designed according to ECP code for design 2017 [20] & ECP code for loading 2012 [12] and material properties are taken as following:
- Concrete compressive strength (cube) (fcu) =40 MPa
- Steel yield strength (fy) = 400 MPa for vertical reinforcement and stirrups.
- Steel young’s modulus (Es) =200 GPa
- Specific weight for wall =18 kN\m3
- Dimension of concrete column (2000×3000) mm with height equal to 8m.
- Dimension of beam girder (2000×3750) mm.
- Height of platform level and mechanical level =2.80m
- Spacing between columns equal to 14m, total length of metro station equal to 42 m with height 21.9m.
- All RC sections were designed using ETABS software.
RC elevated metro station loads are considered according to ECP code of loads as follow:
- Considered loads for platform and under platform level, FC= 4 kN/m2 and LL= 6kN/m2.
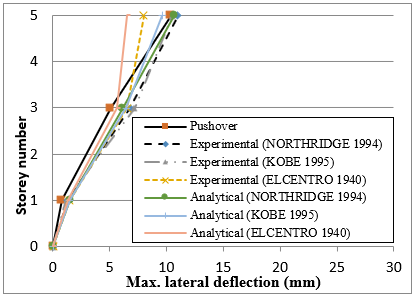
Table 5: Results for nonlinear time history analysis
| Story No. | (NORTHRIDGE 1994) | (KOBE 1995) | (ELCENTRO 1940) | ||||
| Experimental | Analytical | Experimental | Analytical | Experimental | Analytical | ||
| 0 | 0 | 0 | 0 | 0 | 0 | 0 | |
| 1 | 1.3 | 1.55 | 1.2 | 1.473 | 1.5 | 1.32 | |
| 3 | 6.8 | 6.14 | 7.2 | 6.43 | 6.5 | 5.67 | |
|
% Error (NORTHRIDGE 1994) |
% Error (KOBE 1995) |
% Error (ELCENTRO 1940) |
|||||
| Story No. | Displacement | Story No. | Displacement | Story No. | Displacement | ||
| 0 | 0 | 0 | 0 | 0 | 0 | ||
| 1 | 19.2 | 1 | 22.75 | 1 | 12.00 | ||
| 3 | 9.7 | 3 | 10.69 | 3 | 12.77 | ||
| 5 | 3.1 | 5 | 8.19 | 5 | 18.63 | ||
Considered loads for box girder supporting the train according to ECP code in the following table:
| Live Loads | |
|
Sample model |
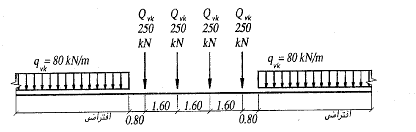 |
| Pulling Force | 300+24(Lo-7)KN |
| Braking Force | 250+20((Lo-7)KN |
| Lateral Shock Effect | 100 KN (in horizontal direction perpendicular to railway direction) |
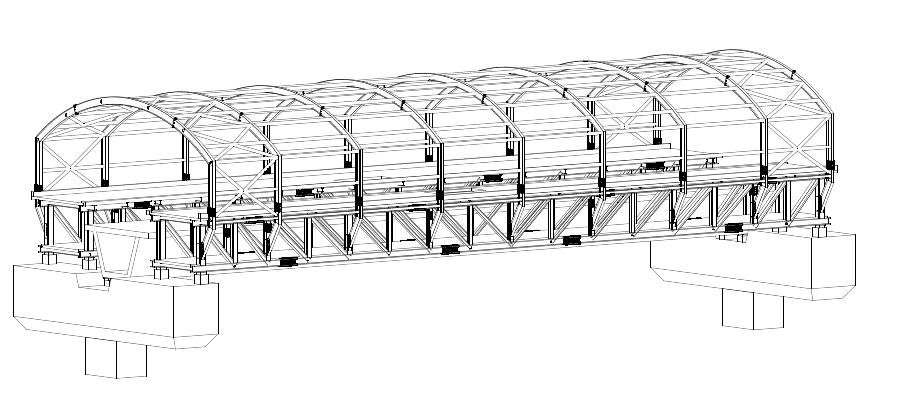
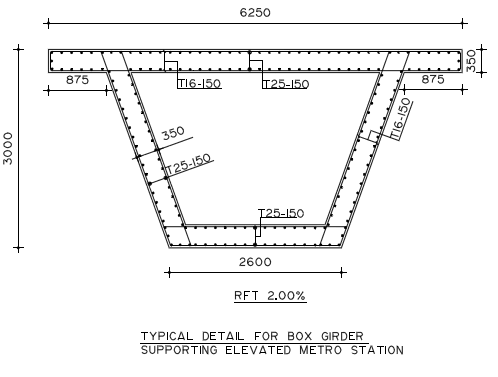
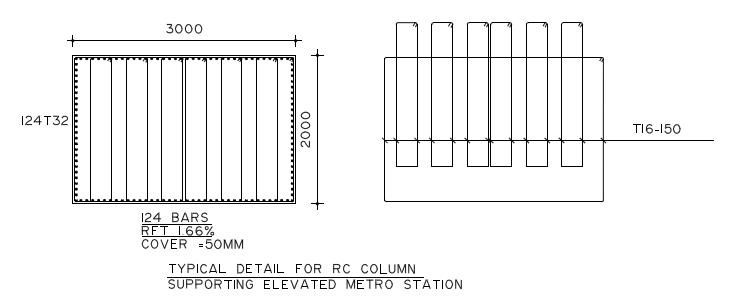
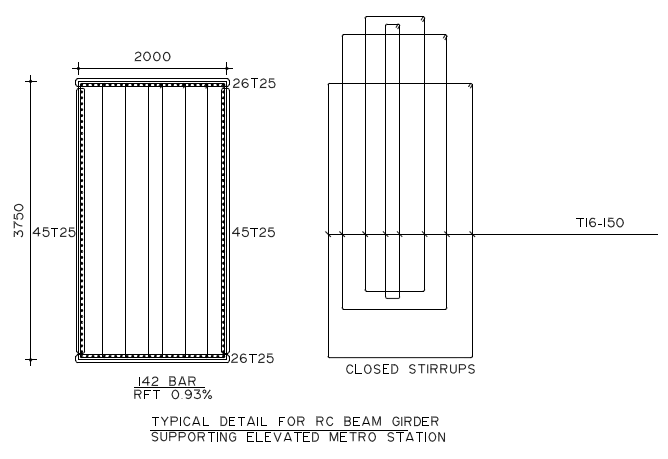
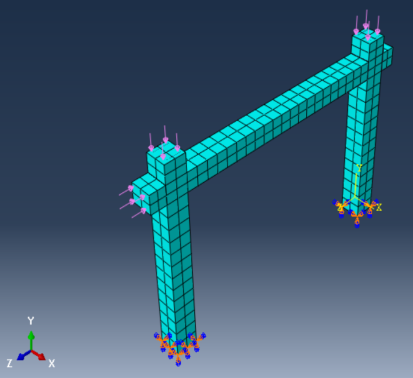
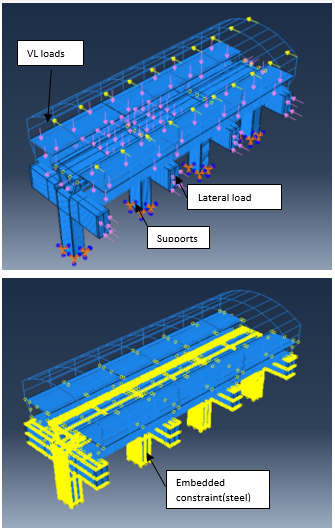
Figure (13) shows the ABAQUS modeling for concrete solid elements and steel wire elements, while Figure (14) shows the boundary conditions for the concrete footing had locked translational degrees of freedom in all directions.
7. Cases of Study
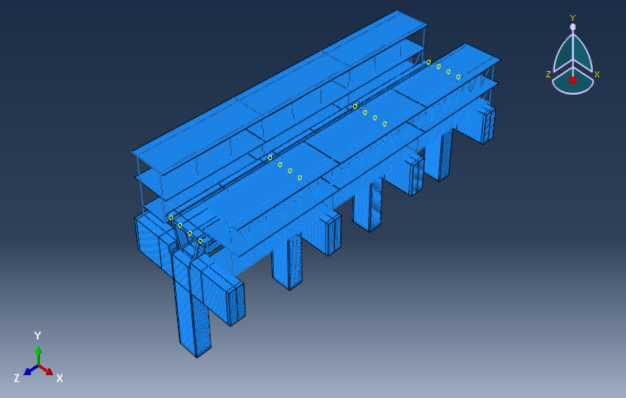
Four configurations for RC elevated metro stations were analyzed as follows:
- 2 platform levels, considering under platform & platform levels with and without steel cladding, as shown in Figure 15.
- 3 platform levels, considering under platform, platform levels & mechanical level with and without steel cladding, as shown in Figure 16.
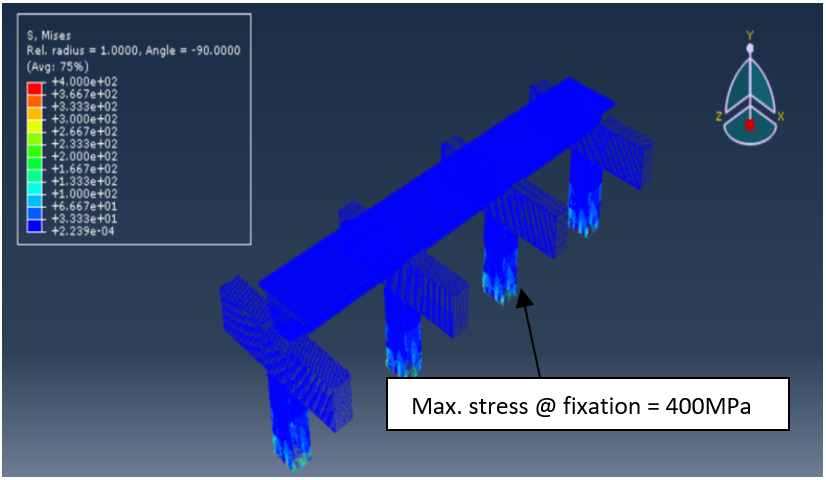
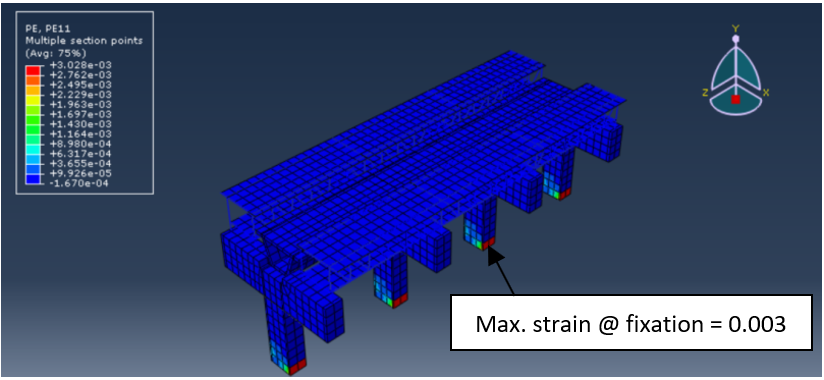
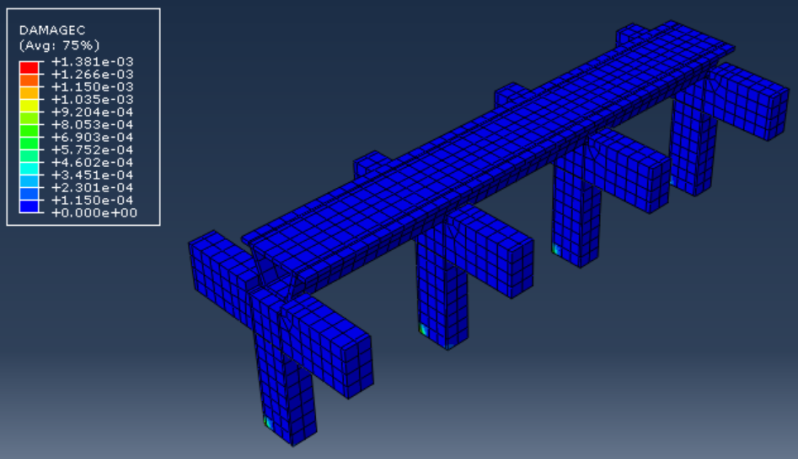
8. Failure Criteria
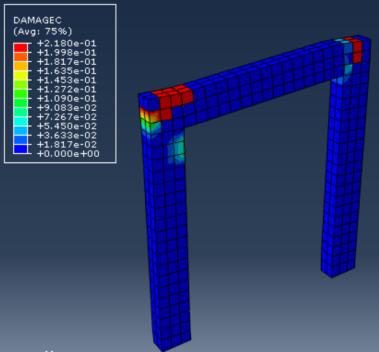
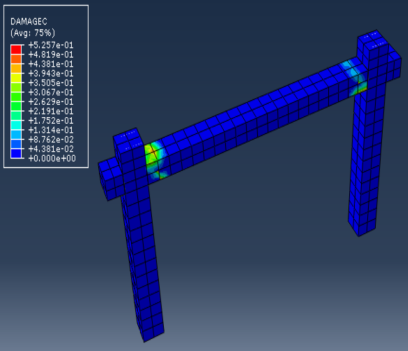
The analyses were continued until the stress in reinforcement reached 400MPa as shown in Figure 17 or the strain in concrete reached 0.003 (according to ECP code [12]) as shown in Figure 18. While Figure 19 shows plastic hinges formation at fixation and crushing in concrete.
9. Observations from The Parametric Study
9.1. Pushover Results
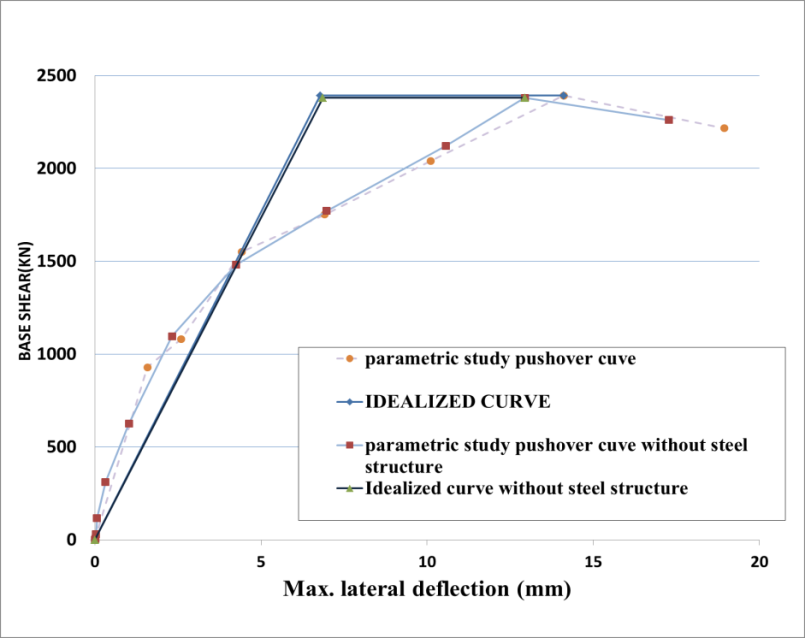
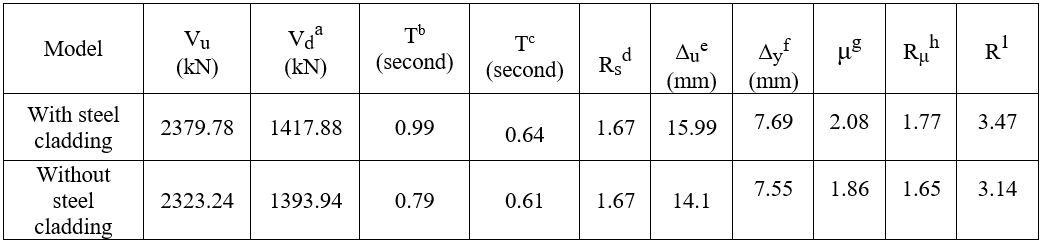
- 2 Stories:
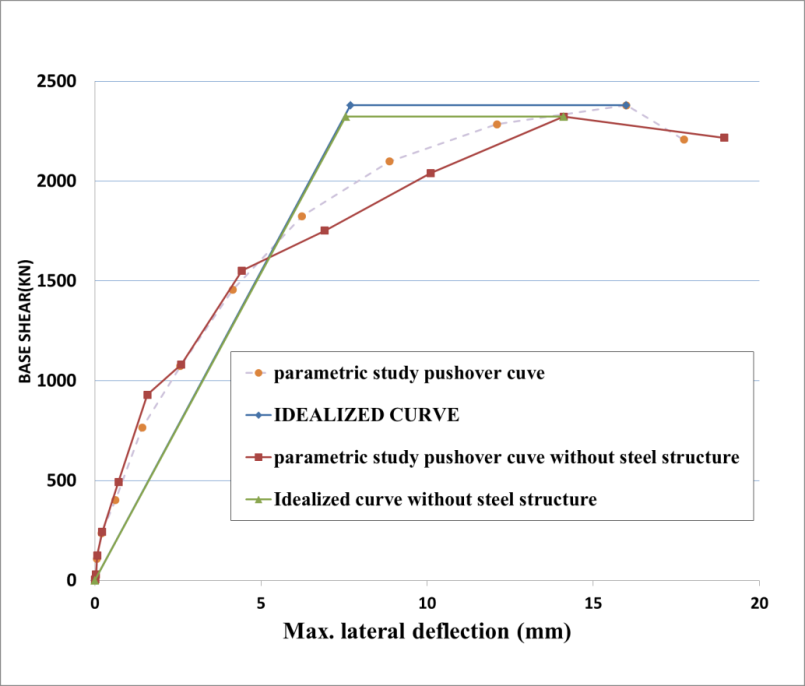
The results of RC elevated metro stations (2 stories, considering under platform and platform levels) with and without steel cladding are listed in Table 6 and Figure 20.
Table 6: Results for RC (2 stories elevated metro stations) based on pushover analysis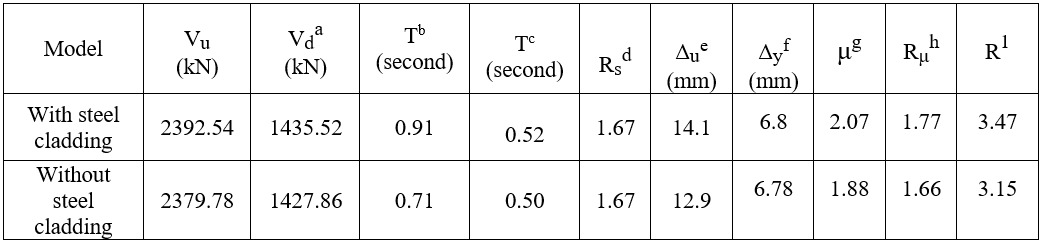
aVd Design base shear equal 60% of the ultimate load capacityas suggested by Uang (1991) [10]
bT Calculated time period based on ECP requirements, time period don’t exceed:(1.2*0.075 *h0.75) (5)
cT Fundamental period obtained from ETABS model for multi degree of freedom.
dRs =Vu / Vd
eΔu Max Top displacement at Vu, calculated based on peak load, as recommended by Park, R., and Paulay, T,1988 [21].
fΔyyeild displacement, calculated based on equivalent elasto plastic energy absorption, as recommended by Park, R., and Paulay, T,1988 [21].
gμ =Ratio between the ultimate displacement and the yield displacement ((Δu/ Δy).
hRu Function of μ depends on time period:
T < 0.2 seconds Ru=1
0.2 < T < 0.5 seconds Ru=
T > 0.5 seconds Ru=μ
(1): R calculated based on time period as suggested by Newmark and Hall (1982)[11] in equations (2).
- 3 Stories:
The results of RC elevated metro stations (3 stories, considering under platform, platform and mechanical levels) with and without steel cladding are listed in Table 7 and Figure 21.
Table 7: Results for RC (3 stories elevated metro stations) based on pushover analysis
9.2. Time history Results
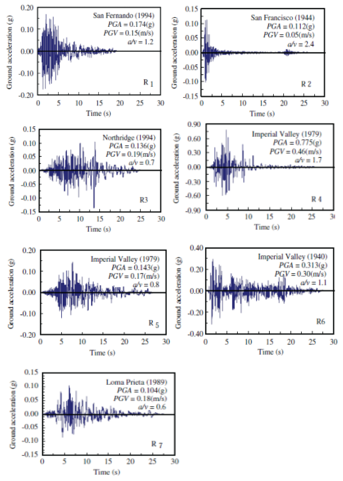
A series of seven EQs with different frequencies were selected for nonlinear analyses. By reference PEER 2006 database [22], time history of selected earthquakes along with peak ground acceleration (PGA) and year of occurrence of the earthquake are illustrated in Figure 22.
Each frame model is subjected to selected records with incremental increase (scaling) of the PGA until a performance limit state is reached. The overall procedure to quantify the seismic force reduction factor (R) is based on the approach presented by Uang (1991) [10]. The R values as shown in Table 9 are assumed as the ratio between elastic lateral load (Ve), which would develop in the seismic force resisting system if the system remained entirely elastic under the design earthquake ground motions, and design lateral force (Vd). A comparison between time history results and pushover results are listed in Table 10.
Table 8: Properties of ground motions (adopted from PEER 2006)
| Record | Earthquake | Site | Date |
PGA (g) |
PGA (MAX) (g) |
| 1 | San Fernando |
La Hollywood Stor Lot |
Feb- 09, 1994 | 0.174 | 1.55 |
| 2 | San Francisco | Golden Gate | March-22, 1944 | 0.112 | 2.90 |
| 3 | Northridge | Playa Del Rey | Jan- 17, 1994 | 0.136 | 1.03 |
| 4 | Imperial Valley | Bonds Corner | Oct- 15, 1979 | 0.775 | 1.13 |
| 5 | Imperial Valley | El-Centro | May- 19, 1940 | 0.143 | 1.29 |
| 6 | Imperial Valley | El-Centro | May- 19, 1940 | 0.313 | 1.19 |
| 7 | Loma Prieta |
Apeel Crystal- Spr Res |
Oct- 18, 1989 | 0.104 | 1.33 |
Table 9: Results for all reinforced concrete (RC) frames models based on time history analysis
| Record | Vd=1417.5 KN | |
| Ve (KN) | R= Ve/ Vd | |
| 1- San Fernando(1994) | 7205 | 5.03 |
| 2- San Francisco(1944) | 5668 | 3.95 |
| 3- Northridge(1994) | 6498 | 4.53 |
| 4- Imperial Valley(1979) | 5300 | 3.7 |
| 5- Imperial Valley(1979) | 6756 | 4.7 |
| 6- Imperial Valley(1940) | 3805 | 2.65 |
| 7- Loma Prieta(1989) | 6164 | 4.3 |
| AVG. | 3.9 | |
Table 10: Comparison between time history results and pushover results
| Time history | Pushover(a) | Pushover(b) |
| R | R | R |
| 3.90 | 3.47 | 3.17 |
(a): R calculated based on time period as suggested by Newmark and Hall (1973, 1982) [11] in equation (2), from RC elevated metro station with steel cladding.
(b): R calculated based on time period as suggested by Newmark and Hall (1973, 1982) [11] in equations (2), from RC elevated metro station without steel cladding.
10. Conclusions
This paper is performed to investigate the variation of seismic response of RC structures of different configurations of special RC structures, such as elevated metro stations. Consequently, the response reduction factor can be evaluated. Then the calculated response reduction/modification factors (R) for reinforced concrete (RC) structures will be compared to those specified in ECP [12] and the ASCE code [13].
Some interesting conclusions could be extracted from the parametric study regarding the building behavior, considering that the (R) factor values calculated in this research are related to the studied special structure only, as follows:
- The response reduction/modification factor(R) value is almost the same as the mentioned value in UBC and ASCE codes. The structural system of the studied RC elevated metro station was considered to be ordinary moment frames according to ACI 318 [23], section 21.2, as columns having a height less than five times the length of the rectangular columns in the moment direction.
- The (R) value doesn’t match those values mentioned in ECP code due to lack of parameters affecting the R value, because the recommended values for (R) factor in the ECP code aren’t affected by height of RC structures, which affect ductility factor.
- The response reduction/modification factor (R) value is sensitive to both RC statically system and RC geometry.
- The(R) value calculated for elevated metro station with steel cladding is higher than that for elevated metro station without steel cladding, due to increasing of ductility factor.
- The (R) value decreases with decreasing of RC structure height due to decreasing in ductility factor.
- The R-value isn’t highly affected by addition of mechanical floor because the RC elevated metro station main system is the single RC column (2000×3000) mm, the beam girder (2000×3750) mm and the box girder. And the RC structure stiffness is mainly affected by those elements.
- The time period calculated based on the structural analysis is less than the calculated time period based on ECP code (equation 5), because ECP code considers the RC structures height only as an affecting parameter on time period. Lesser time period leads to decreasing in (R) factor.
- The R–values (based on Newmark and Hall assumptions) from pushover analysis are close to those calculated based on time history analysis.
Conflict of Interest
The authors declare no conflict of interest.
Notations
- CDP: Concrete Damaged Plasticity
- EQ : Earthquake
- Es: Steel young’s modulus
- Fcu: Concrete Compressive Strength
- Fy: Yield stress
- PGA: Peak Ground Acceleration
- PGV:Peak Ground Velocity
- Rμ: Ductility Factor
- Rs: Over-Strength Factor
- RC: Reinforced Concrete
- Rft: Reinforcement
- Ve: Max elastic Base Shear
- Vd: Design Base Shear
- Vu: Maximum Base Shear
- μ : Ductility Capacity
- S.N, Ambekar. R.V, “An Investigation of Seismic Response Reduction Factor for Earthquake Resistance Design”, International Journal of Latest Trends in Engineering and Technology (IJLTET) DOI: 10.21172 ISSN: 2278-621X Vol.2, Issue 4 July 2013.
- Gaurav Rastogi, Khalid Moin and S.M. Abbas, “Non-linear response of a 1:4 scale model of 3-story reinforced concrete frame with partially masonry infill walls”, (IJLTET) DOI: 10.21172 ISSN: 2319-8753, Vol.3, Issue 7 July 2014.
- Bholebhavi, Inamdar, “AN Evaluation of Response Reduction Factors for irregular structures Using Linear Static Analysis”, Issue 5 May 2016. DOI:10.15680/IJIRSET.2016.0505136
- Tia Toby, Ajesh K. Kottuppillil,” Evaluation of Response Reduction Factor using Nonlinear Analysis”, IJIRST: International Journal for Innovative Research in Science & Technology. ISSN (online): 2349-6010, DOI:10.15680, Issue 06 | November 2015.
- Minnu M. M, “Evaluation of Response Reduction Factors for Moment Resisting RC Frames”, 2014.
- Adeel Zafar, “Response Modification Factor of Reinforced Concrete Moment Resisting Frames in Developing Countries”, Submitted in partial fulfilment of the requirements for the degree of Master of Science in Civil Engineering in the Graduate College of the University of Illinois at Urbana-Champaign, 2009.
- Boumrkik and Kadid, “Pushover Analysis of Reinforced Concrete Frame Structures”, Issue 2008.
- Applied Technology Council (ATC), Structural response modification factors. Report ATC-19. Redwood City, CA (1995).
- Applied Technology Council (ATC). Guidelines for seismic performance Assessment of Buildings (75% Draft): Volume1-Methodology, ATC58-1, Redwood City, CA, 2011.
- Uang, C., “Establishing R (or Rw) and Cd factors for building seismic provisions”, J. Struct. Eng., 117(1). 19-28(1991). DOI: 10.1061/(ASCE)0733-9445(1991)117:1(19)
- Newmark, N. M., and Hall, W. J., “Earthquake spectra and design”, EERI Monograph Series, Earthquake Engineering Research Institute, Oakland, Calif, 1982. DOI: 10.1007/s11803-016-0341-1
- ECP (Egyptian Code of Practice for Loading),2012.
- ASCE 7 (Minimum Design Loads for Buildings and Other Structures. American Society of Civil Engineers. USA), 2005. https://doi.org/10.1061/(ASCE)0733-9445(2005)131:3(507)
- UBC (Universal Building Code) 1997. DOI https://doi.org/10.1007/978-1-4615-0481-8_23
- ABAQUS software V6.14.
- ABAQUS/Standard Analysis User;s Manual, Version 6.14.
- Lila M.Abdel-Hafez, “Behavior of masonry strengthened infilled reinforced concrete frames under in-plane load, Issue 21 June 2014. http://dx.doi.org/10.1016/j.hbrcj.2014.06.005
- Mansouri, A.,” Experimental evaluation of seismic performance of low-shear strength masonry in fills with openings in reinforced concrete frames with deficient seismic details”, Issue 11 September 2013. DOI: 10.1002/tal.1115
- Aslan Sadeghi Hokmabadi, “Effect of Dynamic soil-pile-structure interaction on seismic response of mid-rise moment resisting framrs”,Issue June 2014.
- ECP (Egyptian Code of Practice for design), 2017.
- Park, R., and Paulay, T ”Reinforced Concrete Structures”,Wiley,New York, 1988. DOI: 1002/9780470172834.ch5
- PEER database (PEER 2006).
- ACI318m (2014).