
Optimization of the Feeding Point Location of Rectangular Microstrip Patch Antenna
Volume 5, Issue 1, Page No 382-386, 2020
Author’s Name: Md. Biplob Hossain1, Md. Selim Hossain2, Md. Mahabub Hossain3,a), Md. Dulal Haque3
View Affiliations
1Department of Electrical and Electronic Engineering, Khwaja Yunus Ali University, Sirajganj, 6751, Bangladesh.
2Department of Computer Science and Engineering, Khwaja Yunus Ali University, Sirajganj, 6751, Bangladesh.
3Department of Electronics and Communication Engineering, Hajee Mohammad Danesh Science and Technology University (HSTU), Dinajpur, 5200, Bangladesh.
a)Author to whom correspondence should be addressed. E-mail: im.mahabub@gmail.com
Adv. Sci. Technol. Eng. Syst. J. 5(1), 382-386 (2020); ![]() DOI: 10.25046/aj050149
DOI: 10.25046/aj050149
Keywords: Microstrip Patch Antenna, Substrate Material, Feed Point, Pattern of Radiation, Directivity

Export Citations
Microstrip patch antennas (MPAs) are comfortable and have better anticipation compared to traditional antennas. Not only the weight of this type of antennas is lighter but also, they have little capacity, minimum price, reduced in measurement as well as affluence of fiction then observance. Recently, it has been many times reevaluated for the improvement of Rectangular Microstrip Patch Antenna (RMPA). The performance of an antenna relies on dimensions of antenna, operating frequency, substrate material and height of substrate, the thickness of patch as well as different feeding techniques of the antenna. The main concept that highlights this work is to determine the finest location of the feed point that plays a vital role in the performance measurement of the designed antenna and investigate the performance by studying distinct feed point location. Here we used Rogers R03006 (lossy) as substrate material whose dielectric constant is 6.15 and the operating frequency of our designed RMPA is 1.22 GHz. The RMPA is analyzed based on the different constraints factors of antenna like loss of return, voltage standing wave ratio (VSWR), and the improvement factors that mean the directivity, gain, overall efficiency, the pattern of radiation, etc. It is revealed that the best feeding point (9.07, 15.75) of our designed RMPA is unique concerning the substrate materials and antenna height, as well as width, at a specific operating frequency.
Received: 23 October 2019, Accepted: 23 January 2020, Published Online: 20 February 2020
1. Introduction
Definitely, it’s a progressive field in the direction of plan an MPA and numerous designs have been anticipated in current years [1]. It is notified, wavelength plays a vital role to determine the size of an antenna and its size is equivalent to the wavelength as well as inversely proportional to the operating frequency. MPA comprises of a patch, substrate, ground plane, etc. The microstrip antenna may have square [2], rectangular [3], circular [4] and elliptical [5] shapes, but any continuous shape is possible. The constant of dielectric (εr) value of the substrate should be kept within the values of 2.2 to 12 and for the other materials, it should be as low as possible while designing a microstrip patch antenna [6,7]. Loss tangent reduces efficiency and affects antenna performance. From top to bottom gain, directivity, and competent efficiency of radiation are obtained when the low loss tangent materials are used.
Diverse simulation-based software has become favored recently for designing a patch antenna [8]. We have used CST (CST STUDIO SUITE 2017) simulation software for designing the MPA which is commercially recognized as a simulation-based software to design microstrip patch antenna. To determine the perfect feed point location for reducing the significant return loss is the main motive of our research work. Rogers R03006 (lossy) with dielectric constant Ԑr of 6.15 as substrate material of our designed RMPA has been investigated at the operating frequency of 1.22 GHz. The loss of power input and reflected power is called the return loss which can be calculated in dB from the variance of the feeding and reflected power [9]. The applications of this antenna would be in global positioning system (GPS), wireless local area networks (WLANs), synthetic aperture radar (SAR), medical diagnostic operation in two or more discrete bands and dual-band antenna designs.
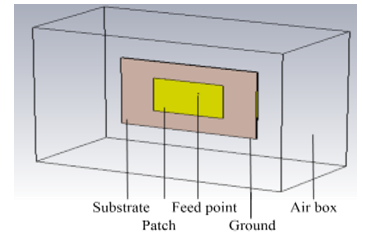 Figure 1: Perspective View of Rectangular Microstrip Patch Antenna in CST simulation platform.
2. Design Procedure of Rectangular Microstrip Patch Antenna
A RMPA with a simple form of design, as shown in Figure 1, comprises of radiating patch (RP) forming one side with a dielectric substrate (DS) and the opposite side with a ground plane (GP). On the dielectric substrate material, the radiating patch include with the feeder line is liked as photographs compose. The fringing field in the boundary of patch and ground plane of the microstrip antenna can emit radiation. The coaxial probe feeding method involves a central conductor that connects directly to the patch for providing radiating power [10].
It was used as a substrate material called Rogers R03006 (lossy) whose dielectric constants Ԑr=6.15, permittivity (µ) =1 F/m, thermal conductivity=0.61 to design the proposed antenna. Here different operating frequency was taken between 1 to 2 GHz for analysis [9, 11].
where Xf = input position as feed point along X axis and Yf = input location as feed point along Y axis.
 The parameters values have been given below Table 1, which have been calculated from the above equations.
Table 1: Parameters and Values of Designed RMPA.
| Parameters | Values (mm) |
| Patch width (W) | 49.40 |
| Patch length (L) | 36.10 |
| Ground plane width (Wg) | 61.40 |
| Ground plane length (Lg) | 48.10 |
| The patch thickness (t) | 0.05 |
| Substrate height (h) | 2 |
| Pin inner radius (ri) | 0.5 |
| Pin outer radius (ro) | 2.5 |
3. Identifying the Feed Point Location
The performance of RMPA greatly depends on the location of feed point, which can be positioned at the point of (Xf, Yf) where Xf and Yf are the input feed point position along the x-axis and y-axis respectively. To locate the perfect feed point that relates to the better performance of RMPA, we have simulated in CST by taking values along x-axis 0, 5, 9.07,15,20 and y-axis 0, 5, 10, 15.75, 20. The theory-based feeding point location is calculated using the values of the parameters which are mentioned in Table 1 and we find the theory-based values along with (x, y) axis (9.07, 15.75) by applying the above equation that has been described previously. We have studied by taking some location-points above and below of (9.07, 15.75). Comparing the obtained values of loss of return, VSWR, directivity, gain, overall efficiency, pattern of radiation, etc. from the CST simulated software, we got the best result in (9.07, 15.75) axis.
4. Results and Discussion
The theory-based feeding point location is calculated using the values of the parameters which are mentioned in Table1.
Table 2 indicates return loss of diverse feeding point location along with the x and y coordinates. From this table, it is found the minimum return loss which is -33.831 dB for the axis (9.07, 15.75). The best feed point location has been indicated with yellow color. We have exercised some values above and below of (9.07, 15.75) which show less performance compared with the best feeding point location. In [12], the authors showed minimum return loss of -42.18 dB for the axis point of (-3, -3), when they used LaAlO3 material a dielectric constant of 23.5, and a height of 1.5 mm as a substrate for the operating frequency of 2.4 GHz. In such a way, it can be shown that the best feed point location of an antenna depends on substrate material along with its heights as well as the operating frequency.
Table 2: Return Loss (dB) of 25 feeding point location in the designed RMPA.
| Y- axis | X- axis | |||||
| 0 | 5 | 9.07 | 15 | 20 | ||
| 0 | -4.13 | -4.13 | -23.03 | -4.54 | -7.65 | |
| 5 | -4.73 | -4.76 | -15.17 | -5.09 | -8.80 | |
| 10 | -7.63 | -7.57 | -22.74 | -7.47 | -8.92 | |
| 15.75 | -29.04 | -30.71 | -33.83 | -32.83 | -32.1 | |
| 20 | -4.17 | -4.27 | -12.39 | -5.11 | -8.17 | |
The CST simulated figure according to Table 2: is shown below with its necessary parameters and values.
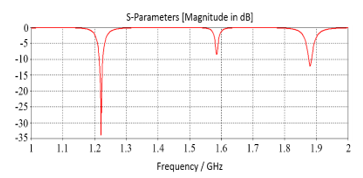 Figure 2: Return Loss vs. Frequency at feed point (9.07, 15.75).
Figure 2 shows the S-Parameters value with respect to the frequency where feed point (9.07, 15.75). Here high return loss is -33.831 dB at frequency 1.22 GHz. A simulated result for different feeding point positions has been shown in Figure 3.
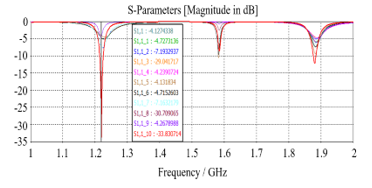 Figure 3: Simulated result for different feeding point locations.
We have examined 25 feeding point locations. In this graph, it has been compared to 11 results among the 25 feeding point locations. In our research work, we have found minimum return loss (-33.83 dB) as our desired feed point compares to the other feed point locations.
Table 3: Voltage Standing Wave Ratio (VSWR) of 25 feeding point location.
| Y- axis | X-axis | |||||
| 0 | 5 | 9.07 | 15 | 20 | ||
| 0 | 5.670 | 1.180 | 1.152 | 3.906 | 2.410 | |
| 5 | 4.930 | 1.996 | 1.423 | 3.510 | 2.139 | |
| 10 | 2.421 | 2.438 | 1.157 | 2.466 | 2.115 | |
| 15.75 | 1.049 | 1.060 | 1.042 | 1.046 | 1.051 | |
| 20 | 4.117 | 3.008 | 1.632 | 3.494 | 2.070 | |
Table 3 indicates voltage standing wave ratio (VSWR) of diverse feeding point locations along with the x and y coordinates. From this table, it is observed the low VSWR which is 1.042 for the axis (9.07, 15.75). Here, the lowest VSWR value has been indicated by yellow color.
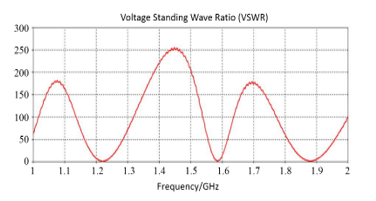 Figure 4: VSWR vs. Frequency at feed point (9.07, 15.75).
The CST simulated figure according to values of Table 3 is shown in Figure 4, which illustrates the VSWR with respect to different frequencies. It is observed the low VSWR which is 1.042 at frequency 1.22 GHz.
Table 4 demonstrates the directivity (dBi) of various feeding point locations along with the x and y coordinates. The directivity (dBi) for the axis (9.07, 15.75) is 6.44 dBi, which is very close to the maximum value of 6.48 dBi for the feed point of (20, 5), as shown in yellow color.
Table 4: Directivity (dBi) of 25 feeding point location in the designed RMPA.
| Y- axis | X-axis | |||||
| 0 | 5 | 9.07 | 15 | 20 | ||
| 0 | 6.44 | 5.17 | 6.41 | 6.43 | 6.47 | |
| 5 | 6.42 | 6.40 | 6.39 | 6.41 | 6.48 | |
| 10 | 6.42 | 6.42 | 4.56 | 6.41 | 6.44 | |
| 15.75 | 6.41 | 6.41 | 6.44 | 6.40 | 6.40 | |
| 20 | 6.40 | 6.41 | 6.41 | 4.55 | 4.45 | |
Figure 5 expresses the directivity (dBi) at feed point (9.0, 15.75). It shows that the directivity is 6.44 dBi, which is very near to the maximum value of 6.48 dBi.
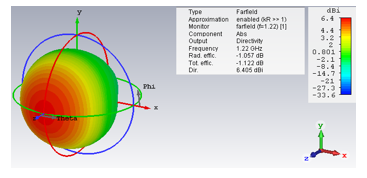 Figure 5: Directivity (dBi) at feed point (9.07, 15.75).
Table 5: Gain (dB) of 25 feeding point location in the designed RMPA.
| Y-axis | X-axis | |||||
| 0 | 5 | 9.07 | 15 | 20 | ||
| 0 | 5.37 | 3.23 | 4.74 | 5.37 | 4.81 | |
| 5 | 5.35 | 5.31 | 4.71 | 5.35 | 4.84 | |
| 10 | 5.35 | 5.37 | 2.65 | 5.35 | 4.72 | |
| 15.75 | 5.34 | 5.35 | 5.35 | 5.35 | 5.34 | |
| 20 | 5.32 | 4.75 | 4.73 | 3.11 | 2.07 | |
Table 5 expresses the gain (dB) of various feeding point locations along with the x and y coordinates. From this table, we find the gain (dB) which is 5.35 dB for the axis (9.07, 15.75) which is very close to the maximum value of 5.37 dB. This feed point location has been indicated with a yellow color.
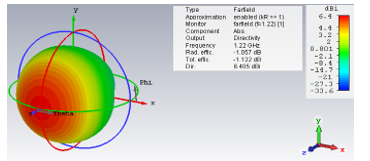 Figure 6: Gain (dB) at feed point (9.07, 15.75).
Figure 6 specifies the gain (dB) where the feed point is (9.07, 15.75). The gain is found 5.35 dB, which is near close to the maximum value of 5.37 dB. The energy radiation by an antenna can be shown by radiation pattern. A diagrammatical illustration of the radiation pattern for the indication of circulation of radiated energy into space is a function of direction. A 2D radiation pattern has been given in Figure 7 with its necessary values.
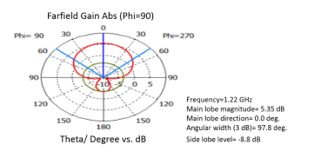 Figure 7: 2D radiation pattern of farfield gain at feed point (9.07, 15.75).
Figure 7 displays the radiation pattern at frequency 1.22 GHz where the feed point is (9.07, 15.75). From the pattern, it is found that the magnitude of the main lobe is 5.35 dB, whereas the side lobe magnitude is -8.8 dB. In addition to the 3D representation, we have added the polar diagrams in the three interesting planes which are farfield H-field, farfield E-field and farfield E-pattern.
 Figure 8: Farfield H-Field at feed point (9.07, 15.75).
Figure 8 indicates the farfield H-field at frequency 1.228 GHz where the magnitude of the sidelobe level is -8.8 dB. The same result for the side lobe has been observed for the farfield E-field and farfield E-pattern as shown in the Figure 9 and Figure 10 respectively.
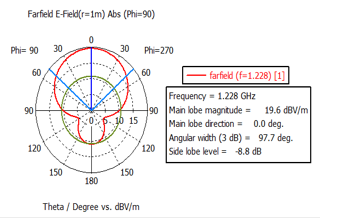 Figure 9: Farfield E-field at feed point (9.07, 15.75).
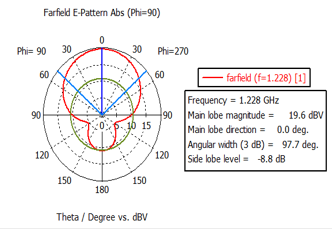 Figure 10: Farfield E-pattern at feed point (9.07, 15.75).
The ratio of the entire power released by an antenna to the net power enter to the antenna from the associated transmitter source is called radiation efficiency. In addition, total radiation efficiency includes the power lost due to poor VSWR or mismatch loss. From the Figure 11, it has been found that the radiation efficiency is -1.0565 dB, whereas -1.222 dB is the total efficiency.
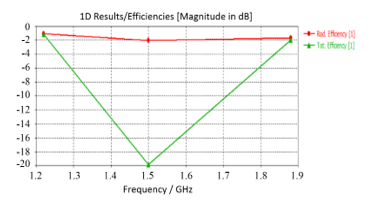 Figure 11. Radiation and total efficiency at feed point (9.07, 15.75).
Figure 11 exhibits radiation and total efficiency at different frequencies. It is found that the radiation and total efficiencies of the prospective antenna are -1.0565 dB and -1.222 dB respectively.
5. Conclusion
The performance of a RMPA is controlled through changing the feed point settings. The optimal outcome of 25 nourishing points of the designed RMPA on Rogers R030006 (lossy) substrate has been investigated. All the feeding point locations result for return loss, VSWR, gain, and directivity have been compared. It is shown that the perfect selection of the feed point location can significantly improve the gain, directivity and efficiency performance of a microstrip patch antenna by optimum reduction of the return loss and other constraints factors.
- Y. Ahmed, Y. Hao and C. Parini, “A 31.5 GHz Patch Antenna Design for Medical Implants”, International Journal of Antennas and Propagation, Volume 2008, Article ID 167980, 6 pages, doi:10.1155/2008/167980.
- N. Porchelvi, “A Design of Square Fractal Antenna with Microstrip Feed For Ultra Wideband Applications”, International Conference on Electrical, Information and Communication Technologies (ICEICT ), 2017.
- M. M. Olaimat, “Comparison between Rectangular and Circular Patch Antennas Array”, International Journal of Computational Engineering Research (IJCER), ISSN (e): 2250 – 3005, Volume-06. Issue-09, 2016.
- S. Jain, R. Nema, “Review Paper for Circular Microstrip Patch Antenna”, International Journal of Computer Technology and Electronics Engineering (IJCTEE), Volume 1, Issue 3, ISSN 2249-6343, 2009.
- V. Priyashman, M. F. Jamlos, H. Lago1, M. Jusoh, Z. A. Ahmad, M. A. Romli, M. N. Salimi, “Elliptical Shape Microstrip Patch Antenna without Dots” IEEE Symposium on Wireless Technology and Applications (ISWTA), September 23-26, 2012, Bandung, Indonesia, 2012.
- D. Rano and S. D. Gupta, “Design and Analysis of Microstrip Antenna Array in E & H plane for High Gain Applications”, 2015 International Conference on Signal Processing and Communication (ICSC), Noida, India, 16-18, 2015.
- M. S. Nishamol, “Design and Development of Reconfigurable Compact Cross Patch Antenna for Switchable Polarization”, Department of Electronics, CUSAT, India, 2012.
- S. E. Jasim, M. A. Jusoh, M. H. Mazwir and S. N. S. Mahmud, “Finding The Best Feeding Point Location Of Patch Antenna Using HFSS”, ARPN Journal of Engineering and Applied Sciences, ISSN 1819-6608, Vol. 10, No. 23, 2015.
- T.S. Bird, “Definition and misuse of return loss”, [report of the transactions editor-in chief Antennas and Propagation Magazine. IEEE. Vol. 51, No. 2, pp. 166-167, 2009
- A. Mehta, “Microstrip Antenna”, International Journal of Scientific & Technology Research. Vol. 4, No. 3, pp. 54-57, 2015.
- R. Garg, P. Bhartia, I. Bahl and Ittipiboon, “A Microstrip Antenna Design Handbook”, Artech House. Boston-London. pp. 1-17, 2001.
- S. E. Jasim, M. A. Jusoh, M. H. Mazwir and S. N. S. Mahmud,” Finding the Best Feeding Point Location of Patch Antenna Using HFSS”, ARPN Journal of Engineering and Applied Sciences, VOL. 10, NO. 23, 2015.