
Analysis of Reducing Defect Waste in Rubber Product for Magnetic Disk Drive Industry
Volume 5, Issue 1, Page No 355-360, 2020
Author’s Name: Hernadewita1, Evan Haviana1,a), Mohd Nizam Ab Rahman2, Hendra3
View Affiliations
1Master of Industrial Engineering, Postgraduate Program, University of Mercubuana, 11650, Indonesia
2Department of Mechanical and Materials Engineering, Faculty of Engineering & Built Environment, Universiti Kebangsaan Malaysia, Malaysia
3Department of Mechanical Engineering, Faculty of Engineering, University of Tirtayasa, Banten, 42191, Indonesia
a)Author to whom correspondence should be addressed. E-mail: evanhaviana@gmail.com
Adv. Sci. Technol. Eng. Syst. J. 5(1), 355-360 (2020); ![]() DOI: 10.25046/aj050145
DOI: 10.25046/aj050145
Keywords: Root cause analysis, FMEA, Productivity

Export Citations
Productivity is increasing when less input was used in getting the same outcomes. Thus, the effectiveness of productive effort, especially in industry, as measured in terms of the rate of output per unit of input. As in derivative rubber industry which is producing the seal product for final assembly of Disc Drive. The function of seal is to protect the instrumentality within magnetic disc. Throughout production runs, there were number of issues occurred inflicting a poor quality or high defect rate, such as the embrace machines that perpetually breakdown or stop and creating a less productivity within the production. The data used for this analysis are the Rubber production for seal product on year 2017 till 2018. One of the seven QC tools, Ishikawa diagram, and along with Failure Modes and result Analysis (FMEA) were applied. The results of the analysis are the improvement program among the production space of Rubber product and extend the standard by the foremost highest defect waste at rubber production processes. There were tends to decide it into auto-deflashing. The improvement result showed that the product defects were seen to be reduced by 35% (from 11.7% into 7. 6% ) for auto-deflashing issues.
Received: 25 October 2019, Accepted: 01 December 2019, Published Online: 07 February 2020
1. Preliminary
The current progressively competitive in global economy, the viability of Associate in maintaining business might be affected to each product and services industries. They should be concerned in meeting customers’ needs as quickly as possible and turn out quality product and services at reasonable costs. Any business is challenged to boost its performance to reply quickly and accurately to changes that occur within the market. Meanwhile, some typically products are unable to compete with their competitors, due to the highest cost on production as the affected of ineffective and economical production processes.
As in the productions of disc drive business, competition within the technology of constructing exhausting drives is obtaining robust, Western Digital (WD) joined of the Disc Drive (HDD) producers was reported to closed one of their factories in Petaling Jaya, Selangor, Malaysia. At the end of 2019, the works begin to establish Solid Storage Disk (SSD) company within the Penang area, Malaysia and prepared to start producing in the next few months [1].
In addition to the WD hardware company, called disk drive products, Seagate also says it will cut 6,500 workers globally. This is similar to 14% of the entire workers at this point. The announcement was quoted by Kompas Techno from The Wall Street Journal, [2] created by Seagate for a while when the Cupertino, California-based company said it would cut 1,600 positions in the company. Seagate had about 45,000 full-time employees before the job reduction program was announced. HDD makers, along with their suppliers, must use all of your capabilities again to develop and formulate appropriate production methods and systems that are tailored to their business aspirations so that they can win products that are effective, economical, and quality so that they can survive in HDD, business division. To respond to the challenges of increasingly competitive business, generating business must develop and formulate existing production methods and systems that will be tailored to the business desire to win productive and economic productivity. Problems in the production floor of the “Gasket Connector” product continue to be high product deficiencies as there is no optimal method or machine that makes the product inferior to the customer’s specifications of the product and quality refers to handling the seal itself
2. Literature
Theoretically, Yamit’s book reveals that the actual method of assembly is the process of modifying (transforming) a material or element (entry) into another product which includes a higher price or in the process of adding a price [3]. As illustrated by the Figure 1 below regarding the installation process;
 Figure 1: Production Process
Production planning and management involves planning activities with production activities so that planned activities are carried out well, starting with the important activities of raw materials, the amount needed after the product is finished and some resources required [4]. The most objective production planning is:
1) Maximizing service for purchasers,
2) Minimize investment in inventory,
3) Planning with production capability,
4) Production management,
5) Inventory,
6) Storage capability and
7) Instrumentality material movements, and
8) Routing and planning with processes.
1.1. Lean Manufacturing
Lean Production is a philosophical and practical way to eliminate all waste in the production process. Using lean concepts has practically improved the production process in a sustainable manner [5-6]. Lean Manufacturing is a good system used by most industries to identify and reduce waste through continuous improvement, it is done by streamlining products to attract customers to the highest possible [7-8].
1.2. Fishbone Diagram
There are many improvement strategies developed by many researchers along with the use of seven QC tools and FMEA [9]. One of them is a fishbone diagram, commonly known as the Diagram of the cause and the effect or the Ishikawa Diagram, introduced by Dr. Kaoru Ishikawa, a high quality professional management from Japan, collectively consists of seven basic quality tools (7 basic tools). Dr. Kaoru Ishikawa is Japanese, perhaps the World Health Organization’s leading figures have introduced bone and fiber results to the world. The bone diagram (Figure 1) of Ishikawa has become a very widely used tool worldwide for causing issues. The rationale is simple, the bone diagrams make sense, and guide every team to consider finding the most appropriate explanation for drag. Bone analysis starts with the issues and the bones provide a template to separate and evaluate the reasons. There are usually six classes, but the quantity will vary depending on the matter. This technique allows for issues to be analyzed and when used with colleagues, it offers everyone an idea of the matter so that the solution can be developed together). Organizations where staff are inspired to evaluate practices, risks, and errors after they occur tend to have a culture in which root or bone analysis is used. It helps to understand the cause and to explain it[10].
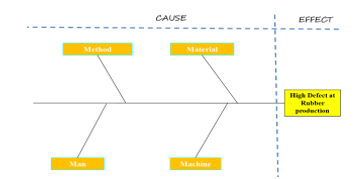 Figure 2: Typical Fishbone Analysis Diagram
1.3. Root cause analysis
Root cause analysis is increasingly being used in health and social services to improve safety and quality as well as minimize side effects as it provides a retrospective review of incidents or events [11]. Ishikawa teaches us to look inside by asking why? Just ask why we can find the real cause of the problem several times. The real reason is not to show. Using this Ishikawa diagram, it is easier for us to find the root cause of the problem, the manufacturing industry in which the process is identified with a variety of variables that can cause problems. If problems and causes are known as expected, corrective actions and steps are easier. With this diagram, everything becomes clearer and allows us to see all the possible causes and find out the real cause.
In performing Ishikawa Analysis, there are many steps to take, namely:
- Prepare an Ishikawa analysis session.
- Distinctive consequences or issues.
- Establish numerous classes of main causes.
- Finding potential causes by group action.
- Review every class of main causes
- Succeed agreement on the foremost possible causes
The strength of the Ishikawa diagrams / bone diagram is set up to illustrate any weaknesses and all involved will contribute to the suggestions that may be behind the problem. Disadvantages of the Ishikawa Diagram is an opinion-supported tool and designed to limit team / user flexibility in visualizing problems that soften to their liking. Further, because ballot paper is usually used to determine the main reasons listed in the diagram.
Ishikawa’s diagram has been expanded into a cause and effect diagram. The development of the Ishikawa Diagram was performed using the “Why” technique up to 5 times (five reasons) with known reasons behind the effects, it is hoped that the results of the assembly method are dynamically enhanced with the factors controlled by one method [12]. This figure is also useful in distinguishing potential causes of tangle. The subjective diagrams focus on the problem of accentuation or symptoms that are the main cause behind this problem. The causative diagram at the same time shows the cause of the problem by linking the causes together.
The advantage of Ishikawa diagram is that it will describe each downside that happens and everybody concerned in it will contribute recommendation which may be the reason behind the matter. Moderate weaknesses Ishikawa diagrams area unit opinion supported tools and are designed to limit the flexibility of the team/user visually in describing the matter victimization the deep “level why” technique unless the paper used is admittedly giant to suit those wants. Furthermore as typically ballot is employed to settle on the foremost possible cause listed on the diagram.
Root cause analysis and corrective action method are fully essential for the advance of the standard management system and increasing the standard of the ultimate product or service [13]. This text has intention to shortly highlight the foremost steps that ought to be taken within the right sequence so as to with success and for good resolve any downside from problematic method. Its 2 major areas as that are reciprocally reticulate and can’t perform while not one another root cause analysis and corrective action method. The primary one serves the purpose to sight the proper root reason behind the matter that is that the supply of the problems and also the different one may be a set of actions to for good eliminate the root cause with the projected solutions that directly attack it so as to fully take away it from the method.
1.4. Failure Mode and Effect Analysis (FMEA)
FMEA is one in every of the tools of Six alphabetic character to spot the sources or causes of a high quality downside [14], in step with FMEA is done by:
- Identify and value the potential failure of a product and its effects.
- Identify actions which will eliminate or scale back the possibility of a possible failure to occur.
- Record method (documented the process).
1.5. Determination of FMEA Variable Value
The following are variables from FMEA, namely:
- Severity is graded in step with the seriousness of the potential impact of failure.
- The incidence is Associate in nursing acceptable rating to assess wherever the primary level causes and failure modes created by the corporate can occur.
- Detection (Detection) is graded in step with the likelihood that this sighting or management technique can detect a possible failure mode.
1.6. Risk Priority Number (RPN)
The Priority variety downside is articulated via RPN:
- RPN = Severity rating x incidence rating x Detection rating.
- Corrective action should be taken if the RPN is high.
- There is not any absolute rule for what’s a high RPN variety. Conversely, FMEA is commonly seen as relative (the highest RPN is addressed first).
Which can be seen mathematically within the equation below.
RPN = Severity × Occurrence × Detection (1)
1.7. The following are the Failure Mode and Effect Analysis Procedures
- Create a table describing the values specified. For the Frequency of Occurrence, Degree of Severity, and Chance of Detection columns make a consensus table of relative values to assume occurrence, severity (how much effect the failure has on the effect), and the possibility that the problem is detected and resolved now this (detection). Fill in the appropriate value for the columns above based on the table made.
- Calculate the risk factor for each cause of failure. For each cause of failure, the risk factor is the product of the numbers in the column in the Occurrence, Degree of Severity, and Chance of Detection columns.
- Identify critical failure modes (has a large risk factor value).
- Create columns in a spreadsheet. Give the names of each column as follows: Modes of Failure, Cause of Failure, Effect of Failure, Frequency of Occurrence, Degree of Severity, Chance of Detection, Risk Priority Number (RPN), and Rank.
- Identify all possible modes of failure, can be done by brainstorming.
- Identify all possible causes of failure for each mode of failure above.
- Determine the effect of each failure. Identification of potential consequences of failure to customers, products, and processes.
3. Methodology
An analysis methodology can be a method or procedure that contains steps that are clearly and consistently set in the analysis method. Each and every level that determines the successive stages must be meticulously approved. In this study, the company that manufactures rubber for magnetic disc components at the Batam city area, the subject of the discuss in this paper is the rubber material for the seal products of the Rubber Department. As the Rubber Department is unable to meet the KPI (Key Performance Indicator) and this can be directly attributed to the waste/defect (PPM) contained in the Rubber Production Department. There are several stages of analysis to be carried out in this analysis. Among them, there were the theories learned and related to the theme of the research provided. These theories can then be compared to the knowledge gained from field studies or interviews with workers. Field studies was carried out in the form of studies conducted through direct observation in the production room, to obtain information related to installation methods.
4. Result and Discussion
The company is one in every of the businesses that support magnetic disk drive parts within the world, settled in state. The main business is producing a part for magnetic disk Drive. The corporate was founded in 1993. Works professionally with ISO 9001, ISO 14001 and OHSAS 18001 standards. The company try to maintain of reasonable performance within the areas of Quality, environment, Safety, and Health. Currently, the companies for which this analysis is conducted are supported by more than 900 employees and mostly experts in the assembly room.
The selection of products that will be inspected as long as the company is based on a single family product, some of these products are considered one family if they are through regular means and use of public facilities. Within the product group, there are many products and therefore product choices are mapped based on many issues such as number of daily outputs, demand and frequency in the given volume. One of the methodologies used is the matrix integration of the method of assembly. The matrix of this production method can be a matrix containing all types of products. See the Table 1 below:
Table 1: Rubber Product Matrix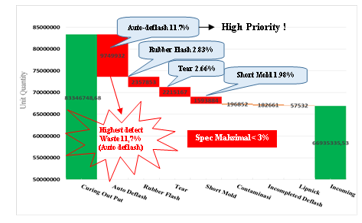
Table 2: Pareto data analysis for defect Product.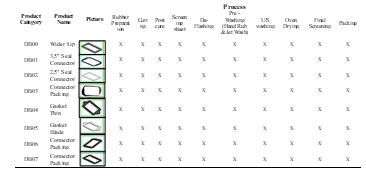
Based on higher tables than Auto-deflash or self-deflash (11.7%), Flash Rubber (2.83%), Tear (2.66%) and Short Print (1.98%). then we can conclude that the symptoms of Auto Deflash Rubber are the highest defect and can be a top priority for us to conduct analysis and corrective action, which is also the main source of supply from the highest NG level (DPPM). ) weaknesses in rubber products are eight families higher than and also the source of waste distribution due to product standards that do not meet specifications. In addition, this phenomenon is what specializes in project follow-up on the installation floor
4.1. Waste / Defective name recognition
Auto deflash on gasket products can be a product that cannot persist with the molding (Self-release from rubber sheet) once the molding method is complete and therefore the auto deflash product can cause breakage on parts/products, as shown in Figure 3 below:
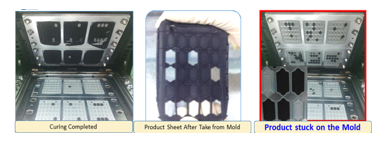 Figure 3: Defect auto Deflash
Auto deflash leaves a tear problem on the product.
4.2. General Production Process Flow
General descriptions of the rubber method include rubber, curing, deflashing, and several other inspection and cleaning methods to support the method until it is an ambient process, as well as the seal and preparation before being sent to the client..
4.3. Analysis of Fishbone Diagrams
The fishbone diagram or cause and effect diagrams was applied in additional to analyze by input factors, by using 4M analysis (Man, Method, Materials and Machine), as shown on Figure 4 below:
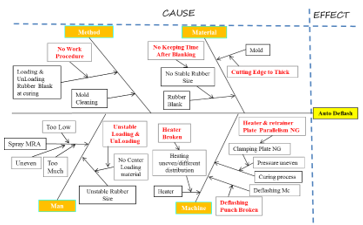 Figure 4: Fishbone diagram
As a result, from our investigation, authors were able to reduce the main potential causes, we tend to explain in detail the analysis and realization of the problems using the 5W + 1H methodology, which can be seen in the Table. 3.
From the analysis of the causes of problems in Table 3, furthermore we tend to divide into four (4) classes, then classify the problems and analyze the causes and analyze the possible implications that may occur. After finding the root cause of this problem, the next step is to set a priority scale / RPN (Risk Priority Number) to improve the implementation of Failure Mode and Effect Analysis (FMEA), supported by many parameters, such as: Severity (S), occurrence (O) and Detection (D), the result are shown as below Table 4.
Table 3: Root cause Analysis
Table 4: Risk Priority Number (from FMEA)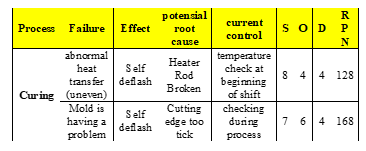
From Table 4, we are able to see the failure mode that causes defective/wastefulness and therefore the calculation of the RPN delineate below:
- Uneven heating within the curing process which ends in auto Deflash / Self deflash
- Severity 8: High severity, because of the top can feel unhealthy consequences that may not be accepted outside the tolerance limit
- Occurence 4: Failure is very possible to occur
- Detection 4: potential causes area moderate unit. The detection methodology is still allow, and so commontly reason for it happens
Based on points a, b, and c: Severity 8, incidence 4 and Detection 4, so the calculation of RPN is a hundred and twenty eight. Because of the multiplication of S, O, and D, as a calculation:
RPN = S x O x D = 8 x 4 x 4 = 128
- molding issues with the curing process end in AutoDeflash / Self deflash.
- Severity 7: High severity, because of the top can feel unhealthy consequences that can’t be accepted on the far side tolerance
- occurence 6: The incidence of damage/failure is possible to occur around 0.5%
- Detection 6: potential causes are moderate, detection strategies still have a potential cause
Based on points a, b, and c: Severity 7, incidence 6 and Detection 4, so the RPN was obtained 168. As it is often from the multiplication of S, O, and D. that is developed as follows:
RPN = S x O x D = 7 x 6 x 4 = 168
Furthermore, as the proposed, it is need to set the priority of the most causes and it was able to put the priority scale of repairing, which has to be done, as follows:
- Repairing the rubber hardening machine, the Heater Rod.
- Fixing the Parallelism Plate.
- Repairs the mold by modifying it, so that the items aren’t too thick.
Those 3, higher than the enhancements delineate as shown in Figure 5, 6 , 7 and also table 5 below,
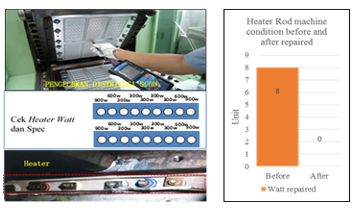 Figure 5: Repairing All Rod Heater Machines
In the heater rod engine repairs are is provided to standardize the wattage heater. That’s to induce a normal temperature. A kind of standardization of the Watt Heater. As we can see in the Table 4, above there is a difference in decreasing 8 watts before repairs were made.
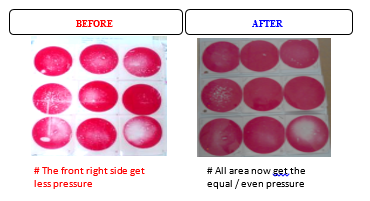 Figure 6: Fixing the Parallelism Plate.
Retrainer Plate Parallelism comparession before and after improvement
Table 5: Heater and retrainer plate condition before & after improvement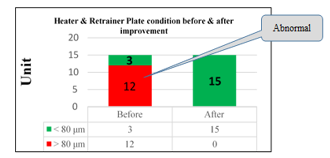
Grinding process is carried out on the heater and retrained plate machine to get parallelism, according to the standard (Kumamoto standard parallelism must be <80 um), as shown in Figure 6 and table 5
 Figure 7: Fix Mold at Outer Groove area
As shown in figure 7. Repaired by enlarging the scale of the outer groove from R1.50 to R4 to manage additional Rubber doesn’t fill the outer space of the groove.
Once the improvement on production method was made, research worker conjointly reviews the effectiveness of enhancements from the defective aspect for additional details as we can see on Tables 6;
Table 6: Reducing Trend of defective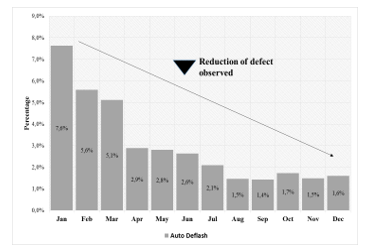
Based on Table 6, we are able to see a decreasing in Defective Auto-deflash, up to 80.5% from 11,7% to 1,7% at the end of the year, once repairs were made to the affected processes.
5. Summary and Conclusion
- The application of FMEA, it will makes the analysis phase more focused, namely by analyzing potential failures, failure effects, frequency of failures and the tools was used to detect failures and the RPN value as priority for improvement as measured by severity, occurrence, and detection so that the priority value obtained is more realistic.
- From improvements such as defective residual trends and or customer complaints, it shows that improvements made to high quality products have reduced deficiencies. Ishikawa diagrams and FMEA tools are very helpful as a tool for analyzing and characterizing problems and supporting improvements in methods and production.
- Some technical improvements in certain processes have reduced the level of defects, so these improvements are very effective and useful for increasing company productivity.
Conflict of Interest
I declare that this paper is not having any conflict of interest.
Acknowledgment
Mercubuana University, Indonesia
- The Register UK daily report. July 2018. ‘Western Digital Will Close Factory HDDs in Late Malaysia in 2019.
- com, Kompas Tekno dari The Wall Street Journal, (2016).
- Yamit, Z., Production & Operations Management (First Edition). Yogyakarta: Ekonisia (2011).
- Biegel, J. E Pengendalian Produksi-Suatu Pendekatan Kuantitatif, hal 19-63, hal 190-211, Penerbit Akademika Pressindo, Jakarta . (1992).
- Purba, H.H., Aristiara, , and Muda, I., Implementation of Business Process Improvement to Reduce Wastes: A Case Study in Grand Piano Assembly Process. (JSERBR) 2018, 5(5):511-527 (2018).
- Ikatrinasari, Z.F, Sawarni Hasibuan, S.,and Kosasih, The Implementation Lean and Green Manufacturing through Sustainable Value Stream Mapping. IOP Conference Series Materials Science and Engineering 453(1):012004 (2018).
- Hernadewita, Saputra, Y., Yatma, W.A., Prastyo, Y., Irawan, A., Lean Manufacturing Approach for Productivity Improvement using SMED (Single Minute Exchange of Dies), IJRESM Vol 2, Issue 5 May 2019.
- Hernadewita and Rohimah, A., Lean Manufacturing Implementation Using VSM to eliminate 7 waste in Painting Process, IJMPRD Vol 9, Issue 2. Apr 2019.
- NHSIII, Improvement Leaders Guide. Coventry: NHSIII (2008).
- Esmail, A. Patient safety in your practice. Pulse; 71: 3, 22-23 (2011).
- Pearson A Minimizing errors in health care: Focusing on the ‘root cause’ rather than on the individual. International Journal of Nursing Practice;11: 141, (2005).
- Scarvada, A.J. A Review of the Causal Mapping Practices and Research Literature. Second World Conference on POM and 15 th Annual POM Conference, Cancun, Mexico (2004).
- Tomic, B., and Brkic, V. S. Effective Root cause analysis and corrective action Process, Journal of Engineering Management and Competitiveness (JEMC) vol. 1, No. 1/2, 2011, 16-20, (2011).
- Chrysler, C. “Potential Failure Mode and Effect Analysis (FMEA) Reference Manual”. Ford Motor Company and General Motors Corporation (1995).