Skin Tissue Oxygen Saturation Prediction: A Comparison Study of Artificial Intelligence Techniques
Skin Tissue Oxygen Saturation Prediction: A Comparison Study of Artificial Intelligence Techniques
Volume 5, Issue 1, Page No 334-339, 2020
Author’s Name: Audrey Huong1,a), Xavier Ngu2
View Affiliations
1Faculty of Electrical and Electronic Engineering, Universiti Tun Hussein Onn Malaysia, 86400 Parit Raja, Johor, Malaysia
2Centre for Applied Electromagnetics, Universiti Tun Hussein Onn Malaysia, 86400 Parit Raja, Johor, Malaysia
a)Author to whom correspondence should be addressed. E-mail: audrey@uthm.edu.my
Adv. Sci. Technol. Eng. Syst. J. 5(1), 334-339 (2020); ![]() DOI: 10.25046/aj050142
DOI: 10.25046/aj050142
Keywords: Skin tissue oxygen, Partial Least Square, K-Nearest Neighbor, Neural Network

Export Citations
Noninvasive measurement of skin tissue oxygen saturation, StO2, is of interest especially in the studies of wound healing and detection of vascular diseases. This work aims to compare Partial Least Square (PLS) regression, K-Nearest Neighbor (KNN) and Artificial Neural Network (ANN) technique in the prediction of StO2 using spectral data obtained from Monte Carlo simulations. We found a good performance of PLS technique with mean and standard deviation (SD) of the absolute prediction errors given by 2(1.37) % for noisy data with signal-to-noise ratio (SNR) of 30 dB. The errors increased to 4.67(3.87) % under SNR of 20 dB. This is followed by KNN technique, which calculated errors varied from 4.28(3.58) % to 7.61(6.08) % with a decrease in SNR. Meanwhile ANN produced large errors in its prediction ranging from 4 to 9 % for the considered SNR values. This work concluded PLS is suitable for use in selecting significant spectral information for the development of prediction models using artificial intelligent (AI) system or a hybrid combination of AIs to achieve a higher accuracy.
Received: 11 November 2019, Accepted: 27 December 2019, Published Online: 07 February 2020
1. Introduction
Tissue oxygen saturation is a clinical indicator for assessment and diagnosis of many illnesses such as peripheral vascular diseases [1], organ viability [2], hypoxic-ischemia conditions [3], hemorrhagic shock [4], in studies related to cancers [5] and muscle oxidative metabolism [6], and for management of wounds (burns) and ulcers [5, 7]. In this context, sufficient tissue oxygen pressure combined with adequate supply of oxygen and nutrients through functioning microcirculatory system are more likely to guarantee cell survival.
The current state of the arts of skin tissue oxygen consumption measurement includes transcutaneous oxygen tension (TcPO2). Despite its noninvasive and high accuracy attributes, this equipment required mild heating at the local site in its operation to promote blood perfusion prior to the measurement. Some of the other drawbacks include long measurement time, and sensitivity of its performance to factors such as the person’s stress level, body temperature, medication and local inflammation [8]. Systems that take advantage of physical and optical properties of blood for noninvasive and noncontact measurement of blood oxygen saturation are of increasing demand; the said systems included spectroscopy techniques (optical, time and frequency domains) and clinical imaging methods such as Magnetic Resonance Imaging [9,10], and Photoacoustic techniques [11]. Among the spectroscopy approaches, hyperspectral imaging technique has emerged as a popular choice owing to its inherent ability to produce high resolution data in both spectral and spatial dimensions. Even though this system collects images at a shallow depth of field, it involves less complex technologies. With regard to its application in tissue oxygen measurement using light of visible range, it is able to spectrally resolve information carrying light backscattered from cutaneous tissue. The latter can be used in prediction of haemoglobin concentration and tissue oxygen saturation using either an inverse model, or computer aided, or computational intelligence system [12, 13]. Since the system interrogates blood in dermal capillaries, arterioles and venules [14], the predicted value is often taken as the average of oxygen saturation within the cutaneous microenvironment, StO2. Previous works [15, 16] from this laboratory found that the range of predictions is dependent on the system configuration and architecture, and the wavelengths used. Meanwhile the use of Artificial Intelligence (AI) techniques has received a great deal of attention in this arena of study over the past years due to its ability to learn by itself through a large set of data, events and statistics before making decision. This capacity makes it a highly sought-after means for classification, prediction and forecasting tasks in many fields (for a review, see [17, 18]). In addition, much less efforts and time is needed to spend on improving the formulations of inverse models and look-up table.
The use of AI in medicine is well recognized to provide better quality medical health care services by reinforcing diagnosis with prediction and identifying definitive intervention, thus reducing morbidity and mortality case, and healthcare cost. Among the applications of AI include diagnosis and prognosis of cancers, illness and disease, to aid in decision makings and for physiotherapy practice [19, 20]. The examples of AI used for clinical screening and imaging tasks are such as optimization algorithms (see ref. [21] for a comprehensive review), neural network [22], and computer aided diagnosis [23].
To the best of the authors’ knowledge the use of AI, and the study of the performance of different AI techniques, in the predictions of StO2 using an optical system is few and far between. The further advancement in the integration of these technologies is impeded by insufficiency of data available for the training of the AI system, prompting the work by [24] that used Monte Carlo (MC) platform for training of artificial neural networks for future optical diagnostics and sensing. This work is following in the footsteps of [24], and our aim is to compare the performance of different AI techniques for the prediction of StO2 using MC simulation data.
2. Material and Methods
2.1. Monte Carlo (MC) simulations of light propagation
The two layered human skin model, the illumination and detection systems used for simulations of light propagated in skin shown in Figure 1 were previously presented in [22]. These simulation data are used here again owing to the known medium StO2 for evaluations of performance of prediction techniques described in the following. The simulation data for medium percent StO2 ranging from 0 % to 100 % at a step resolution of 5 % were added with Gaussian White Noise (AWGN function in MATLAB 2018a) to produce signals with signal-to-noise ratio (SNR) of 20 and 30 dB. For each SNR and StO2 level, 10 sets of random noise were incorporated into the simulations to give a total of 210 data for each SNR level, among which 70 % (n = 147) were randomly chosen for the training of the model, while the remaining (n = 63) were used as the testing data.
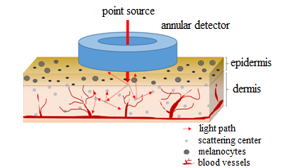 Figure 1: MC simulations of light propagation in a two-layered skin medium
2.2. Features selection
Since light absorption in skin varied with oxygen binding status of hemoglobins (i.e. oxyhemoglobin and deoxyhemoglobin concentration), by examining the absorption differences in the spectra of these hemoglobin components one can deduce the required StO2 parameter. The simulated spectral data in section 2.1 were used as the input data to the artificial intelligence techniques. This work considered signals across the wavelengths ranged from 520 nm to 650 nm where changes in hemoglobin absorptivity signatures with StO2 are significant (image can be found in [25]).
2.3. Tissue oxygen saturation prediction tools
In the present study, we investigated three different machine learning techniques: artificial neural network (ANN), partial least square (PLS) and K-nearest neighbor (KNN) in the estimation of the required percent StO2 value. The error, ε, (in unit of %) in the predicted value, StO2(p), is defined as:
![]() where StO2‘ is the ground truth value. The prediction tools presented in the following used MATLAB (version 2018b) software in their implementation due to its comprehensive multivariate analysis toolboxes.
where StO2‘ is the ground truth value. The prediction tools presented in the following used MATLAB (version 2018b) software in their implementation due to its comprehensive multivariate analysis toolboxes.
- Artificial Neural Network (ANN)
This work used nnstart toolbox to generate an ANN feedforward model from the simulation data. We have chosen 10 hidden neuron layers, and the fitting of the input-output relationship was by using Levenberg-Marquardt (LM) backpropagation model to update weights in minimizing sum of square error functions. This ANN model was modified from the prior work in [22], wherein ‘while’ loop structure was adopted in obtaining a neural network with acceptable performance during its training. This is with the implementation of arbitrarily chosen MSE threshold value of 24 and 15, respectively, for dataset of SNR = 20 and 30 dB.
- Partial Least Square Regression (PLS)
PLS regression analysis was used here to develop a prediction model. This technique predicts the response, Y, for a set of data by extracting latent variables from sampled observed variables, X, as followed:
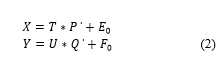 where T and U are latent variables, P’ and Q’ are loading matrices and E0 and F0 are residuals. The latent variables are related via inner relation coefficient, B, and residual, F1, as followed:
![]() This study used plsregress function to project high dimensionalities feature vectors (X and Y) onto a subspace to give an overall partial regression model given by:
This study used plsregress function to project high dimensionalities feature vectors (X and Y) onto a subspace to give an overall partial regression model given by:
![]() The vector in (4) that simplified the regression problem was used to predict the most probable percent StO2 value. We have chosen latent factor of 3 for demonstration purpose. It must also be mentioned that the present work found no improvement in the prediction accuracy using other factor number.
The vector in (4) that simplified the regression problem was used to predict the most probable percent StO2 value. We have chosen latent factor of 3 for demonstration purpose. It must also be mentioned that the present work found no improvement in the prediction accuracy using other factor number.
- K-Nearest Neighbor (KNN)
The KNN classification model for predictors, X, and response, Y, was generated using fitcknn. This study considered exhaustive search algorithm to find the nearest neighbors by calculating the distances from all points in X to each point in Y. The distance metric that was considered in the present study is Minkowski distance. The K value was chosen as 11 based on the size of the datasets following the discussion in [26]. The trained classifier in (5) was then used to predict the class of the testing data.
 3. Results and analysis
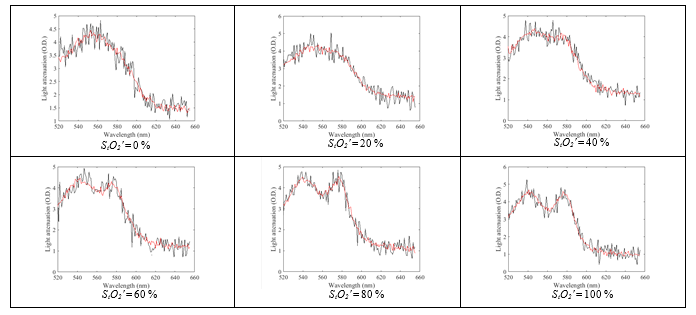 Figure 2: Noise corrupted wavelength dependent light attenuation with Signal to Noise (SNR) of 20 dB (dark lines) and 30 dB (red lines) under different StO2 condition.
The changes in light attenuation spectrum following variations in the reference StO2 (i.e. ground truth values used in the simulations) are shown in Figure 2. The plots showed example changes in the noise corrupted signals of the considered SNR. These spectral data across wavelength range of 520 – 650 nm and a resolution of 1 nm were used for both training and evaluation of the considered models using a constant random seed for comparable results. The data were separated into training and testing sets with a percentage of 70:30. Figure 3 showed the three-dimensional plots of attenuations from training set for the reference of our readers. These plots also revealed changes in the value range and distribution with noise level. The mean (SD) of the absolute ε calculated from (1) for percent value predicted by ANN, PLS and KNN technique for spectrum of different reference StO2 shown in Table 1 is calculated as 8.76 (6.82) %, 4.67 (3.88) % and 7.62 (6.08) %, and 4.77 (3.96) %, 2 (1.37) % and 4.28(3.57) % for dataset of SNR of 20 dB and 30 dB, respectively. The computation time (averaged from three consecutive runs) spent in the training of the machine learning techniques described in section 2.3.1-2.3.3 performed on an ASUS laptop with 64-bit window 7, Intel® Core™ Duo T6500 CPU @2.10 GHz are given by 1.38 and 1.8 seconds for PLS and KNN, respectively. A longer average time was needed for ANN with the time taken recorded as 81.5 and 39.1 seconds in the training of data of SNR = 20 and 30 dB, respectively.
4. Discussion
Figure 2 showed substantial decrease in the noise level on the spectra for signals of SNR 30 dB as compared to that of 20 dB. This decrease in noise level yields an overall improvement in the prediction accuracy in Table 1 with an average decrease in ε value calculated as 3.33(0.66) %. The lowest mean prediction error was observed for values given by PLS technique; this is followed by KNN and ANN. While both ANN and PLS produced regressed value in their predictions, categorical values according to the range of target values used during the training process were produced by the KNN. The main reason PLS technique outperformed its counterparts in the validation phase is likely due to the accentuation of the variations in the absorptivity through the projection of data to a lower dimensional space. An investigation into the correlation coefficients obtained from the regression of centre variables X and Y in (2) using three latent factors revealed a strong positive correlation at wavelength 580 nm, followed by that of 538 nm under SNR = 30 dB. These peaks increasingly diminished under SNR 20 dB.
Since similar distribution of attenuation values with changes in StO2 was observed in Figure 2, and the features used in the training of the considered AI models discussed in section 2.2 are of full spectral information (attenuations across wavelength range 520 –
Table 1: Error, ε, in the value predicted for testing dataset of SNR 20 dB (Left) and 30 dB (Right) sing (from top to bottom) Artificial neural network (ANN), Partial Least Square (PLS) and K-Nearest Neighbor (KNN).u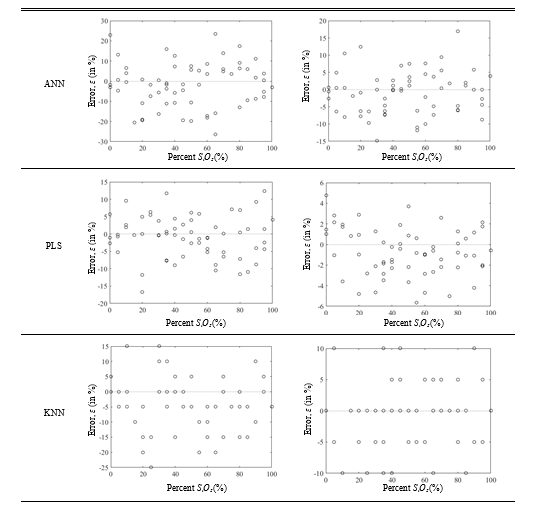
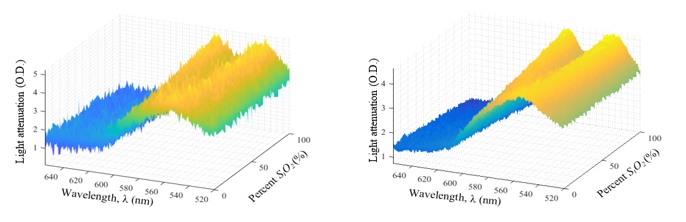 Figure 3. Three-dimensional surface plots of light attenuation values for SNR of (left) 20 and (right) 30 dB.
650 nm at a step resolution of 1 nm), this produces a poor network and association on the relationship between input and target values. The prediction errors can be minimized by considering features that are of utmost significance, such as those within the presence of troughs and crest across wavelengths 540 to 570 nm. An example of previous works from this laboratory in [22] extracted and considered the important features (i.e. magnitude and wavelength of the hemoglobin peaks) in the prediction work, hence minimizing errors from overfitting.
Meanwhile the KNN technique is primarily based on the location (i.e. magnitude) of these attenuation values, large difference in the values with changes in StO2 would be desirable to yield better accuracy result. For this reason, relatively consistent errors were observed in Table 1. We hypothesized that this technique could be successfully applied to the classification of skin pigmentations.
It must be mentioned that the use of two-layered homogeneous medium is insufficient to represent human skin tissues since there are differences in optical properties of heterogeneous sub-layers in skin as widely reported in earlier works [27, 28]. Nonetheless the findings from this study would be useful when measurement data are readily available.
5. Conclusion
This work investigated the performance of different AI techniques in the prediction of medium StO2 using MC technique. The significant findings of this study include the validation of the importance of hemoglobin signatures in the prediction of the required StO2 value. The notably better accuracy in the values predicted using PLS regression technique is owing to its ability to distinguish the hemoglobin peaks using latent factor of 3. Meanwhile the shortcoming of KNN technique in the prediction work is largely contributed by the high similarity in the range and distribution of light attenuation values making the classification process complex and difficult. In addition, the large spectral information used in ANN technique resulted in over-fitting problem and produced comparatively larger errors. This work concluded that PLS regression performed well in the prediction of StO2, and this technique may also be suitably used to select the distinctive signatures of spectral prior to the development of a prediction model using other AI technique.
Conflict of Interest
The authors declare no conflict of interest.
Acknowledgment
The authors would like to acknowledge Research Management Center (RMC) Universiti Tun Hussein Onn Malaysia for funding this study under research fund Vot E15501.
- R. M. Siao, M. J. So, M. H. Gomez, “Pulse oximetry as a screening test for hemodynamically significant lower extremity pheripheral artery disease in adults with type 2 diabetes mellitus” Journal of the ASEAN Federation of Endocrine Societies, 33(2), 1-20, 2018.
https://doi.org/10.15605/jafes.033.02.04 - N. T. Clancy, S. Saso, D. Stoyanov, V. Sauvage, D. J. Corless, M. Boyd, D. E. Noakes, M. Y. Thum, S. G. Maghami, J. R. Smith, D. S. Elson, “Multispectral imaging of organ viability during uterine transplantation surgery in rabbits and sheep” Journal of Biomedical Optics, 21(10), 1060061-7, 2016. https://doi.org/10.1117/1.JBO.21.10.106006
- S. Akter, S. Kawauchi, S. Sato, S. Aosasa, J. Yamamoto, I. Nishidate, “In vivo imaging of hepatic hemodynamics and light scattering property during ischemia-reperfusion in rats based on spectrocolorimetry” Biomedical Optics Express, 8(2), 972-992, 2017. https://doi.org/10.1364/BOE.8.000974
- C. Carlile, C. E. Wade, M. S. Baraniuk, J. B. Holcomb, L. J. Moore, “Evaluation of StO2 tissue perfusion monitoring as a tool to predict the need for lifesaving interventions in trauma patients” The American Journal of Surgery, 210(6), 1070-5, 2015. https://10.1016/j.amjsurg.2015.08.006
- R. Rutkowski, M. Schuster, J. Unger, C. Seebauer, H. R. Metelmann, Th.v. Woedtke, K. D. Weltmann, G. Daeschlein, “Hyperspectral imaging for in vivo monitoring of cold atmospheric plasma effects on microcirculation in treatment of head and neck cancer and wound healing” Clinical Plasma Medicine, 7(8) 52-57, 2017. https://doi.org/10.1016/j.cpme.2017.09.002
- R. Re, I. Pirovano, D. Contini, L. Spinelli, A. Torricelli, “Time domain near infrared spectroscopy device for monitoring muscle oxidative metabolism: Custom probe and in vivo applications” Sensors, 18(1), 264, 2018. https://doi.org/10.3390/s18010264
- S. Zhang, S. Gnyawali, J. Huang, W. Ren, G. Gordillo, C. K. Sen, R. Xu, “Multimodal imaging of cutaneous wound tissue” Journal of Biomedical Optics, 20(1), 016016, 2015. https://doi.org/10.1117/1.JBO.20.1.016016
- A. Y. Mousa, J. L. Ballard, Transcutaneous Oxygen Tension: Principles and Applications, Springer Link, 2017
- M. B. Vestergaard, U. Lindberg, N. J. Aachmann-Andersen, K. Lisbjerg, S. J. Christensen, I. Law, P. Rasmussen, N. V. Olsen, H. B. W. Larsson, “Acute hypoxia increases the cerebral metabolic rate- a magnetic resonance imaging study” Journal of Cerebral Blood Flow & Metabolism, 36(6), 1046-1058, 2016. https:// 10.1177/0271678X15606460
- Z. Deng, C. Li, “Noninvasively measuring oxygen saturation of human fnger-joint vessels by multi-transducer functional photoacoustic tomography” Journal of Biomedical Optics, 21(6), 0610091-5, 2016. doi: 10.1117/1.JBO.21.6.061009
- M. Barberio, F. Longo, C. Fiorillo, B. Seeliger, P. Mascagni, V. Agnus, V. Lindner, B. Geny, A.L. Charles, I. Gockel, M. Worreth, A. Saadi, J. Marescaux, M. Diana, “Hyperspectral enhanced reality a physiology-based surgical guidance tool” Surgical Endoscopy, 1-9, 2019. https://doi.org/10.1007/s00464-019-06959-9
- Q. Wang, Q. Li, M. Zhou, Z. Sun, H. Liu, Y. Wang, “A hyperspectral vessel image registration method for blood oxygenation mapping” PLOS ONE, 2017. https://doi.org/10.1371/journal.pone.0178499
- W. Feng, R. Shi, C. Zhang, T. Yu, D. Zhu, “Lookup table based inverse model for mapping oxygen concentration of cutaneous microvessels using hyperspectral imaging” Optics Express, 25(4), 3481-3495, 2017. doi:10.1364/oe.25.003481
- A. Vogel, V. V. Chernomordik, J. D. Riley, M. Hassan, F. Amyot, B. Dasgeb, S. G. Demos, R. Pursley, R. Little, R. Yarchoan, Y. Tao, A. H. Gandjbakhche, “Using noninvasive multispectral imaging to quantitatively assess tissue vasculature” Journal of Biomedical Optics, 12(5), 051604 -,2007. https://doi.org/10.1117/1.2801718
- S. P. Philimon, A. K. C. Huong, X. T. I. Ngu, “Investigation of spatial resolution dependent variability in transcutaneous oxygen saturation using point spectroscopy system” in 2017 IOP Conf. Ser.: Mater. Sci. Eng. 226, 012122, 2017.
- S. P. Philimon, A. K. C. Huong, X. T. I. Ngu, “An alternative wavelength range for noninvasive assessment of wound tissue oxygenation status” International Journal of Engineering and Technology, 7 (4.26), 73-33, 2018. DOI: 10.14419/ijet.v7i4.26.22141.
- R. Liu, B. Yang, E. Zio, X. Chen, “Artificial intelligence for fault diagnosis of rotating machinery: A review” Mechanical Systems and Signal Processing, 108, 33- 47, 2018. https://doi.org/10.1016/j.ymssp.2018.02.016
- M. I. Jordan, T. M. Mitchell, “Machine leaning: Trends, perpecrtives, and prospects” Science, 349 (6245), 255 – 260, 2015. DOI: 10.1126/science.aaa8415
- H. Akbari, L. V. Halig, H. Zhang, D. Wang, Z. G. Chen, B. Fei, “Detection of cancer metastasis using a novel macroscopic hyperspectral method” in Proceedings of SPIE–the International Society for Optical Engineering, 8317, 831711. doi:10.1117/12.912026
- V. A. Convertino, S. L. Moulton, G. Z. Grudic, C. A. Rickards, C. Hinojosa-Laborde, R. T. Gerhardt, L. H. Blackbourne, K. L. Ryan, “Use of advanced machine learning techniques for noninvasive monitoring of hemorrhage” Journal of Trauma, 71(1), 25-32, 2011. doi: 10.1097/TA.0b013e3182211601
- R. Fusco, M. Sansone, S. Filice, G. Carone, D. M. Amato, C. Sansone, A. Petrillo, “Pattern recognition approaches for breast cancer DCE-MRI classification: A systemic review”, Journal of Medical and Biological Engineering, 36(4), 449-459, 2016. DOI: 10.1007/s40846-016-0163-7
- A. Huong, X. Ngu, “Neural network approach for rapid prediction of transcutaneous oxygen saturation”, in 2019 IEEE 9th Symposium on Computer Applications & Industrial Electronics (ISCAIE), Malaysia, 2019. DOI: 10.1109/ISCAIE.2019.8743751
- H. Y. Ma, Z. Zhou, S. Wu, Y. L. Wan, P. H. Tsui, “A computer aided diagnosis scheme for detection of fatty liver in vivo based on ultrasound kurtosis imaging” Journal of Medical Systems, 40(33), 1-9, 2016. DOI: 10.1007/s10916-015-0395-z
- A. Doronin, I. Meglinski, “The application of a unified Monte Carlo model in the training of artificial neural networks for the purpose of real-time in-vivo sensing of tissue optical properties” in 2019 SPIE Defense and Commercial Sensing, Baltimore, Maryland, United States, 2019. https://doi.org/10.1117/12.2518566
- A. Roggan, M. Friebel, K. Dorschel, A. Hahn, G. Muller, “Optical properties of circulating human blood in the wavelength range 400 – 2500 nm”, Journal of Biomedical Optics, 4(1), 36-46, 1999. https://doi.org/10.1117/1.429919
- P. Mitra, C. A. Murthy, S. K. Pal, “Density-based multiscale data condensation” IEEE Transactions on Pattern Analysis and Machine Intelligence, 24(6), 734-747, 2002.
- Y. Masuda, Y. Ogura, Y. Inagaki, T. Yasui, Y. Aizu, “Analysis of the influence of collagen fibres in the dermis on skin optical reflectance by Monte Carlo simulation in a nine-layered skin model”, Skin Res Technol. 24(2), 1-8. 2017. https://doi.org/10.1111/srt.12421
- M. N. S. Yusiff, M. S. Jaafar, “Effect of multidesign skin model and characteristic on Monte Carlo simulation of light skin diffuse reflectance spectra”, Jurnal Teknologi, 78(9), 135-142, 2016. DOI: 10.11113/jt.v78.7605