Stress Response Index for Traumatic Childhood Experience Based on the Fusion of Hypothalamus Pituitary Adrenocorticol and Autonomic Nervous System Biomarkers

Adv. Sci. Technol. Eng. Syst. J. 5(1), 317–324 (2020);
 DOI: 10.25046/aj050140
Stress occurring in the early days of an individual was often assumed to cause several health consequences. A number of reports indicated that having to deal with unfavourable events or distress situation at a young age could tweak stress responses leading to a broad spectrum of poor mental and physical health condition. Therefore, changes identified within stress response were recommended to be taken as a measure in regulating and managing such health situation. This study combines the biomarker that represents both autonomic nervous system (ANS) and hypothalamic-pituitary-adrenocorticol (HPA) as a single measure to classify the stress response based on traumatic childhood experience and propose a stress response index as a future health indicator. Electrocardiograph (ECG), blood pressure, pulse rate and salivary cortisol (SCort) were collected from 12 participants who had traumatic childhood experience while the remaining 11 acted as the control group. The recording session was done during a Paced Auditory Serial Addition Test (PASAT). HRV was then computed from the ECG and the HRV features were extracted. Next, the best HRV features were selected using Genetic Algorithm (GA). Biomarkers such as BP, PR and SCort were then integrated with 12 HRV features picked from GA. The integrations were conducted using two fusion methods which are Euclidean distance and serial fusion. The differences in reaction of the fused features were then identified. Based on the result, the Euclidean distance (ed) which is the fused feature by the parallel fusion, displayed the most efficient reaction with accuracy, sensitivity, and specificity at 80.0%, 83.3% and 78.3%, respectively. Support Vector Machine (SVM) was utilized to attain such result. The fused feature performance was then fed into SVM which produced indexes on stress responses. The result retrieved from these indexes acts as a measure in handling future health deliverability and perhaps could eventually enhance the health care platform for midlife individuals.
1. Introduction
This paper is an extension of the work [1] originally presented in the IEEE-EMBS Conference on Biomedical Engineering and Sciences (IECBES), 2018. Stress is identified as a biological and mental reaction to any threat or external pressure. During normal conditions, stress encourages a person to concentrate, stay active and attentive. Nevertheless, in critical events, stress assists in powering up an individual and this may lead to the ability in saving someone’s life. However, stress becomes damaging to the physical and psychological health of an individual when the body fails to cope and solve problems [2]. Stress can initially be a positive contributing factor in an individual’s life but due to immoderate demands that complies with the advanced and modern world eventually becomes a major threat. Many acute diseases have been listed as the effect of stress. This includes cardiovascular diseases, diabetes, asthma, anxiety disorders and depression [3].
Stress is classified into three types which are known as acute, episodic and chronic [3,4,5]. Acute stress is known as stress occurring at a short period of time. Factors contributing to this kind of stress are usually work-related, athletic performances and examination. Episodic stress occurs due to repetitive acute stress, like that of a daily work stress. Chronic stress is related to a high intensity stress factors that develops over a long period of time. This can be damaging to the physical and psychological well-being of an individual [6]. Factors that can lead to development of chronic stress are marital affairs, work stress, financial condition [7], and traumatic life experiences [8, 9] such as an unpleasant childhood incident.
Several researchers have been caught up studying stress factor developed from traumatic childhood experiences. Recent studies in illness management and prevention indicates that being stressed at an early age may lead to a series of health issues [10, 11, 12, 13], and alterations in physiological behaviour [14, 15, 16, 17]. This fact is significant in developing methods that could improve healthcare management for individuals approaching adulthood, since there is an indicator of the current health status of the particular child. Therefore, this study focuses on traumatic childhood experience which is classified as chronic stress. In sequence to investigate the stress response of individual with traumatic childhood experience, mental stress test which is an acute stress is used.
Early life stress has shown a number of health outcomes to be predictive [18, 11]. Studies conducted a few years ago showed that individuals with unfavourable and stressful situation tend to fall in a broad spectrum of mental and physical health problems which eventually lead to alcohol abuse, obesity, depression, smoking, substance abuse, intrusive sexual acts [19], as well as acute illnesses like cardiovascular disease [20, 21]. The output of these studies has brought latest discovery that indicate children who are vulnerable to potentially traumatic events may experience cardiovascular stress reactivity due to acute physiological processes. There are a number of cases that displayed changes in cortisol as well as severe mental stress that increases heart rate within individuals who had at least one or more traumatic incident [14, 15]. Nevertheless, studies also showed changes in cardiovascular reactivity to stress task amongst children who were exposed to aggressive adolescent behaviours [17]. These evidences indicate that stress reactivity is detected via incidents taking place at an individual’s tender age, and that the immensity of stress reactivity is in relation to stress exposure and may influence health of an individual in years to come [22, 23]. Since there are compelling evidences on this matter, detecting changes in stress response due to traumatic events of a child is significant to be utilized as an indicator for better healthcare.
It is important to pick the most suitable biomarker to identify and determine changes taking place in stress response. Heart rate variability (HRV) is one of the biomarkers proven to be the most powerful and depicts autonomic nervous system [24-27]. However, there is not much research on the application of HRV in measuring stress responses among children with traumatic incidents. In fact, only conventional frequency domain method was applied [28, 29]. Hence, both conventional and improved approaches extracted from HRV analysis should be applied in measuring stress responses of a child who had been through traumatic incidents.
Integrating two of the major body systems known as autonomic nervous system (ANS) and hypothalamic-pituitary-adrenocorticol (HPA) is strongly recommended as it plays an important role in regulating stress response [30,31]. Although numerous studies indicate that in measuring stress responses, multiple biomarkers were used. In conjunction to that, the results for each biomarker were analysed singly [32, 33].
Therefore, this study proposes a latest fusion method for stress response classification on traumatic childhood occurrence. Since children’s traumatic incident causes inconsistency in stress response, the health status during adulthood can be determined via a proposed stress response index which could indicate the future health condition and lead to preventative measurements as well as further diagnosis that may refine the healthcare management. The objective of this study is to integrate both HPA and ANS so as to classify stress responses among children who faced traumatic experiences along with a stress response index that would be able to indicate health statuses in the later years of these individuals.
2. Method
2.1. Participants
609 students were screened with lifetime adversity inventory based on C-DIS-IV items and Childhood Traumatic Questionnaire (CTQ) [34]. This group of participants is made up of 511 females and 98 males (age, M = 19.2, SD = 2.99 years). Participants who scored within 2 to 5 and 2 or higher on the lifetime adversity measure and CTQ, respectively, were identified as individuals with traumatic childhood incidents whereas those who scored 0 on the lifetime adversity measure and CTQ were made the control group [14, 34]. A total of 23 participants, 12 participants who had traumatic childhood experience and 11 participants who were from the healthy control group. These participants have no history of cardiovascular illnesses, incurable diseases or other acute infection, and a current endocrine or immune disorder. Participants’ consent was obtained and the study was approved by the University of Birmingham Ethnics Committee.
2.2. Mental Stress Test
The psychological stress test in this research was conducted with the Paced Auditory Serial Addition Test (PASAT) and it usually takes about 10 minutes to complete. Participants were given a series of single-digit numbers and were requested to add the digit to the numbers they previously heard. They were to say their answers out loud.
2.3. Procedure
A standard three-lead ECG placement and blood pressure (BP) cuff, were attached to the participants in sitting position. The test began with a 10 minutes adaptation period followed by another 10 minutes of resting baseline phase. Three saliva samples were collected from every subject with the first sample obtained at the last minute of the baseline phase. 10-minute PASAT was then completed and saliva sample was obtained once again. The recovery phase took place for the next ten minutes followed by last saliva sample collection. Participants’ BP and heart rate (HR) were recorded every two minutes, four times for each phase, whereas ECG readings were recorded throughout the test.
2.4. Saliva Sampling and Cortisol Assays
In order to obtain samples of saliva, participants had salivette dental swab positioned in their mouth which was gently chewed for one minute and placed in the salivette tube. Three stimulated saliva samples were obtained in this study whereby first sample via a 10-minute baseline phase. As for the second and third sample, it was obtained right after stress test and initially 10 minutes to task, respectively. The salivettes were then centrifuged for five minutes at room temperature and 3500 rpm before being aliquoted. It was then made to freeze at -20 degrees until the time to be assayed. The assayed cortisol was then duplicated by an enzyme-linked immunosorbent assay (ELISA) via a commercial kit (DRG Diagnostics).
2.5. Pre-Processing: From ECG to HRV
HRV were being quantified via MATLAB software based on obtained and pre-processed ECG signals. A notch filter was used in eliminating the 50 Hz power line interference. Pan and Tompkin’s algorithm were applied to identify the QRS waves database [35].
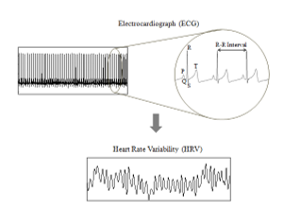 Figure 1: Derivation of Heart Rate variability for Electrocradiograph
2.6. Feature Extraction
In this research, HRV feature extraction is carried out through time, frequency, non-linear time-frequency and Wavelet analysis.
2.6.1. Time-Domain Analysis
The time-domain analysis was measured with Standard Deviation of the Normal-to-Normal intervals (SDNN), Standard Deviation of the Average of Normal-to-Normal intervals (SDANN), Root Mean Square Successive Difference (RMSSD) and HRV triangular index (HTI) [26] and computed via recommendation by Task Force (1996).
2.6.2. Frequency Domain Analysis
For the frequency domain analysis Autoregressive (AR) spectral analysis was applied [36,37]. AR model is interpreted as follow:
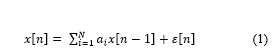 where, x[n] is the current value of the HRV time series, a1, . . . , aN are the predictor coefficients, N is the model order. With this method, the power spectral density (PSD) can be presented at a precise estimation. This would allow the feature extraction process to be carried out at ease as shown in Figure 2 [38].
Next, nine features were obtained via PSD extraction. These nine features are VLF (0.003-0.04 Hz), LF (0.040-0.15 Hz), HF ( 0.15-0.4 Hz), the standard unit (n.u.) of LF and HF (LFnu and HFnu), LF/HF ratio, Total Power (TP) [26, 38,39], log LF (lnLF) and log HF (lnHF)[40].
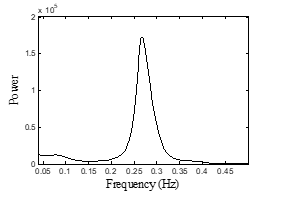 Figure 2: Power Spectral Density (PSD) using AR
2.6.3. Time-Frequency Domain Analysis
Since HRV contains slow varying signal, Modified B-Distribution (MBD) tend to be one of the most efficient Time Frequency Domains (TFDs) in exhibiting a high time-frequency resolution [41]. MBD’s fundamental is [41]:
![]() where, gamma function is identified as Γand β is a positive real number between 0 and 1 that monitors the commutation between components’ resolution and cross-term suppression [41].
where, gamma function is identified as Γand β is a positive real number between 0 and 1 that monitors the commutation between components’ resolution and cross-term suppression [41].
Figure 3 shows an example of TF plotted via application of MBD to obtain HRV signals that were recorded during resting baseline. TFD measured via TFD-based Shannon and Renyi entropy led to an overall computation of TFD and as well as entropy within LF and HF domain [42,43].
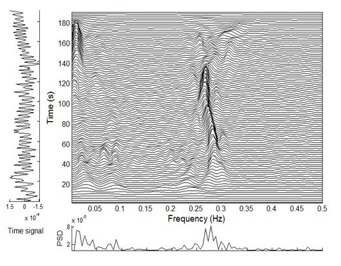 Figure 3: Time and frequency details via HRV’s time-frequency distribution
2.6.4. Wavelet Transform Analysis
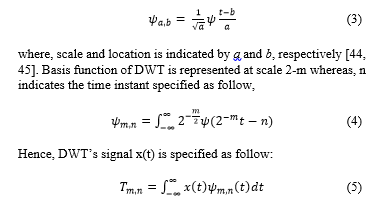
Wavelet analysis bring forth the localizations of time and frequency resulting in wavelet coefficients which can be utilized as features in classifiers [44,45]. HRV signal can be disintegrated using wavelet family ψa,b, a basis function that involves dilatation and translations of a distinctive and valid mother wavelet ψ(t). This process is defined as,
 A discrete wavelet was transformed from eight-order Daubechies mother wavelet (db8) to five levels before being implemented to HRV. This transformation causes signal disintegration of five-level wavelet. Following this, using the suggested HRV frequency bands, Detail (D) and Approximate (A) coefficients were reassembled [26]. The A5 coefficient allowed rebuild of VLF range at < 0·04 Hz; D5 and D4 coefficients for LF range at 0·04–0·15 Hz; D23, D2, and D1 coefficients for HF range [46]. Hence, a total of 83 features were obtained from the HRV signal.
2.7. Feature Selection
The feature selection process is carried out via Genetic Algorithm (GA) MATLAB Toolbox. Iteration process occurred whereby chromosome is being engineered for production of new population via application of genetic functions like crossovers and mutations. Theoretically, healthy species will make through the evolution process whereas the weak ones disintegrate.
An initial population of chromosomes was randomly selected in order for GA’s process to begin. Encoded bit strings usually depicts chromosome that is made up of sequence of features. These features each is classified as genes. In each chromosome, based on positional index, a gene value of ‘1’ determines that the feature selected is positioned at ‘1’ but the feature is not picked if the gene value is found to be at ‘0’. When iteration process takes place, combinatorial set of genes or features in the current population, identified as individual was observed via fitness function.
For the current work, the fitness function (FitFunc) was computed using kNN-based classification error with k = 3 [47,48,49] which is defined as:
![]() where, kNN-based classification error is indicated by α and Nf is the number of elements in selected features. In record, one study proposed the application of SVM classification error in extracting fitness function [50]. Unfortunately, despite being a substantial machine learning tool, SVM needs a durable computational load. Hence, in this research, this method was not applicable due to the constraint and fact that GA consumes computational space.
where, kNN-based classification error is indicated by α and Nf is the number of elements in selected features. In record, one study proposed the application of SVM classification error in extracting fitness function [50]. Unfortunately, despite being a substantial machine learning tool, SVM needs a durable computational load. Hence, in this research, this method was not applicable due to the constraint and fact that GA consumes computational space.
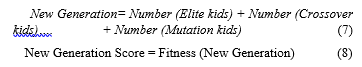
The initial populations of chromosomes were then ranked upon creation. The fittest individuals known as elitism solutions were selected from these ranks for survival in the next generation. Individuals that were not selected formed crossover and mutation solutions by genetically going through functional crossover and mutation. New generations were then formed by individuals selected through the elite, crossover and mutations.
GA operator’s optimization was carried out to detect the prime value of initial population, crossover and mutation. Table 1 indicates the tested values extracted via references from studies carried out previously [47, 49, 51]. The outcomes of chosen features integrating with tested parameters were recorded and chromosomes with the optimum outcome were utilized in the next stage.
Table 1: Tested parameter figure utilized selection of HRV feature in GA.
| Parameter | Tested Value |
| Initial Population | 20
30 40 50 60 |
| Crossover | 0.1
0.01 0.001 |
| Mutation | 0.8
0.9 |
Selection tool was required in choosing the best individual. Hence, in this research, two individuals or chromosomes were picked as defeater of the tournament by applying tournament selection of size 2. This selection was applied because of its clarity, rapidity and competency [47, 48]. The process is carried out in repetition until formation of new population is achieved.
Individuals like elite, crossover, and mutation kids were added to create the new population.
 This process continued until GA achieved the condition that puts it to stop. The stopping conditions utilized are Maximum Number of Generations (MaxNG) and Stall Generation Limit (SGLim). Both were set at 100 and 10, respectively [49]. If the mean alteration in the fitness gain between the chromosomes over SGLim generations was below than or equivalent to 0.000001 which is the value of Tolerances Function (TolFun), then the GA will be dismissed. The process ends if TolFun also known at termination tolerance, has a function gain whereby if |f(xi) – f(xi+1)| < TolFun. Since GA observes the variance in values of fitness within all generations. The mean of these variances for 10 generations were recorded. If the recorded values were less than or equal to 0.000001, GA will be dismissed. This indicates that resemblance in fitness value also known as genetic homogeneity among chromosomes of the generation have the most excellent chromosome and therefore coincides with GA.
2.8. Feature Fusion
In obtaining reactivity demarcation, the features were measure based on normalization equation as follow [52, 53]:
![]() where, sample feature vector throughout stress texting is Y, the average of sample feature during resting baseline is indicated as Ŷ, and standard deviation of feature vector throughout resting baseline is indicated as ŝ.
where, sample feature vector throughout stress texting is Y, the average of sample feature during resting baseline is indicated as Ŷ, and standard deviation of feature vector throughout resting baseline is indicated as ŝ.
Linking feature vectors of the biomarkers obtained from HRV feature extraction (h), and BP, PR and SCort (b, p and c, respectively) led to construction of serial fusion, whereas parallel fusion was designed by integrating feature vectors and complex vector. To introduce combined features with complex vector, the following equation, c = a + ib, where a and b are two varied feature vectors of the same sample S and i is an imaginary unit, was applied.
The purpose of fusion was to integrate the essentials within ANS and HPA leading to a finer presentation of the elements. Hence, the differences are obtained via fusion of biomarkers. ANS biomarkers are HRV, BP and PR, whereas HPA biomarker is cortisol.
2.9. Classification
In order to speculate an input’s output group with existing data, a classifier is required. In this research, SVM classifier was used to classify stress response between two types of group which are of individuals with traumatic childhood incidents and a control group. Other classifiers like Naive Bayes [54, 55] and k-Nearest Neighbour (kNN) [56, 57] were used in this study to distinguish and prove that SVM is the most effective classifier. The evaluations of classifier were carried out by applying 10-fold cross validation [46].
2.10. Stress Response Index
The stress response index is depicted via classifiers that indicate greater deliverability. The future health is then predicted via irregularity patterns in stress response that were detected within the index.
3. Result and Discussion
3.1. HRV Feature Extraction
From the HRV feature extraction, a total of 83 features that has been extracted. Previous researches indicated that most features selected in obtaining HRV classifications were of conventional methods which are based on time and frequency analysis [58-60]. Nevertheless, there were studies that indicate the application of feature analysis that are more advanced such as that of wavelet, time frequency, and non-linear [46, 61, 62]. However, in this study, obtaining HRV features were carried out with the fusion of both conventional and newest advance analysis.
3.2. HRV Feature Selection
From genetic algorithm, 12 features were selected which are RMSSD from time domain analysis, Normalized unit of high frequency (Hfnu) from AR PSD, Mean LF, SDNN D1, SDNN D4, Apen (Approximate entropy) D4, SampEn (sample entropy) D3, Kurtosis D4, SkewD5, from wavelet and ShanEn LF, ShanEn (Shannon entropy) HF, ShanEn LFHFr from TFD.
3.3. Feature Fusion
The extracted HRV features via GA feature selection were then made to integrate with biomarker obtained in this study to produce stress response index. The initial biomarker fusion was carried out with the application of Euclidean distance (ed) classified as parallel fusion followed by serial fusion, a regular and simple fusion method, carried out for resemblance identification. Theoretically, the fusion of biomarkers that depicts ANS and HPA was applied in this research. This is because both ANS and HPA are biological systems with their own pathological characteristics and are strongly connected. Hence, a booming stress response index was likely to be extracted from the fusion of these systems [30, 31, 63]. Biomarkers depicting ANS were made to integrate with biomarker that depicts HPA, known as, Scort. With this fusion, HRV-Scort, BP-Scort and PR-Scort, were produced.
Table 2 shows the result of integrated biomarkers via the application of SVM in the context of accuracy, sensitivity and specificity. Outstanding performance can be seen with application of Euclidean distance by HRV-Cort as accuracy, sensitivity and specificity scored 80.0%, 83/3%, and 78.3%, respectively. The table also indicated that, biomarkers like PR, BP and HRV representing ANS with Scort had poor performance. From this result, it can be seen that HRV is a strong biomarker and can be utilized for ANS.
Following this, a single biomarker was used to measure the differences between outcomes of new fused feature and stress response classifications. Results indicated that the latter had better performance than single biomarker. However, since SVM model indicated excellent outcomes in categorizing fused biomarker (HRV-SCort), it was then utilized in exhibiting stress response index.
Table 2: Outcomes of SVM classifiers applied in fused biomarker
| Fusion Method | Acc % | Sen% | Spe% | |
| Serial | HRV-Cort | 63.3 | 51.7 | 75.0 |
| BP-Cort | 67.2 | 68.3 | 66.7 | |
| PR-Cort | 58.3 | 66.7 | 48.3 | |
| HRV-BP-PR-Cort | 65.0 | 58.3 | 71.7 | |
| Euclidean distance | HRV-Cort | 80.0 | 83.3 | 78.3 |
| BP-Cort | 21.7 | 13.3 | 28.3 | |
| PR-Cort | 59.4 | 91.7 | 26.7 | |
| HRV-BP-PR-Cort | 68.9 | 81.7 | 60.0 | |
*Notes: Acc: accuracy, Sen: sensitivity, Spe: Specificity
3.4. Support Vector Machine Model Fusion
The fused feature vector was then utilized as model with SVM MATLAB toolbox application. The input was placed in SVM model. Values of alpha (α), support vector, scale factor, shift and bias were obtained. The stress response index was recorded with SVM classification (Csv) algorithm as reference. The algorithm is interpreted as follow:
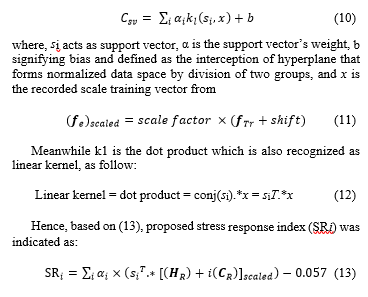 where HRV reactivity occurred via HR and SCort reactivity is via CR.
Figure 4 shows the suggested Stress Response Index (SRi) of HRV and salivary cortisol (HRV-SCort) with ed-SVM of children’s traumatic incidents. The figure indicated that two groups of stress response were divided by index boundary at a value of ‘0’. Normal stress response was identified with index sample ≥ 0, while other samples exceeding normal stress response were categorized as irregular stress response. Irregular stress response is often made up of participants who had no traumatic experiences during their early years.
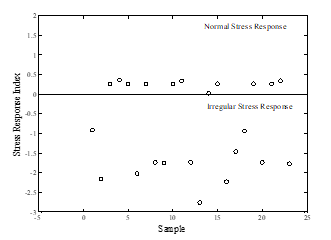 Figure 4: SRi of HRV and HRV-SCort with ed-SVM of traumatic childhood experience
A recent stress response index in reference to traumatic childhood incidence was proposed with the obtained comprehensive feature extraction. This extraction is made up of robust HRV feature with the application of GA and integration of ed and SVM. Linear regression was referred in designing the stress response index. Hence, the scalar value is inconsistent and changes based on sample’s size. Assumption made is that the greater number of sample leads to stress response index being more accurate.
Nevertheless, alcohol intake, smoking, diet, present stress and psychosocial situation may influence the precision of stress response index [64]. This is a take on for researchers to further study on the factors influencing stress response as well as conducting the study with a bigger sample size to create a more complete index that acts as the fundamentals of stress response index. Furthermore, the reaction of traumatic childhood incidents within an individual against the stimulated stress requires further comprehensive research. Chances are that these individuals could be more at risk physically and mentally or they are able to manage themselves being in such situation. Findings from this research can be utilized to upgrade the approach within adult’s healthcare [65].
4. Conclusion
This research proposed stress response index based on the combination of biomarker representing both autonomic nervous system and hypothalamus pituitary adrenocortical to classify stress response for traumatic childhood experience. 12 HRV features, form time, frequency, Time, frequency, TF and wavelet were extracted then combined with other biomarkers, blood pressure, pulse rate, and salivary cortisol. The biomarker combination represents two main body systems which are autonomic nervous system and hypothalamus pituitary adrenocortical axis. The classification was performed using support vector machine and the result proved that the combination between HRV and Salivary Cortisol demonstrated the highest performance with 80.0% accuracy, 83.3% sensitivity and 78.3% specificity. Finally, The fused vector was fed into the SVM model to develop the stress response index. This index could be used to predict the future health and therefore allow the individual to take more cautious about his/her health.
Conflict of Interest
The authors declare no conflict of interest.
Acknowledgment
This research was funded by the Ministry of Higher Education, Malaysian Government (FRGS: R.J130000.7745.4F943) and funding for research from School of Sport, Exercise & Rehabilitation Sciences, University of Birmingham, UK.
- Aimie-Salleh, Noor & Balakrishnan, Malarvili & Whitttaker, Anna, “Stress response index for adverse childhood experience based on fusion of biomarkers”. IEEE-EMBS Conference on Biomedical Engineering and Sciences (IECBES), 140-145, 2018. DOI: 10.1109/IECBES.2018.8626657.
- T. D. Washington, Psychological Stress and Anxiety in Middle to Late Childhood and Early Adolescence: Manifestations and Management. Journal of Pediatric Nursing, 24(4), 302-313, 2009.
- N. Schneiderman, G. Ironson, and S. D. Siegel, Stress and Health: Psychological, Behavioral, and Biological Determinant. Annual Review of Clinical Psychology, 1, 607–628, 2005.
- A. Fernandes, R. Helawar, R. Lokesh, T. Tari, and A. V. Shahapurkar, A Survey on Analysis of Stress. International Journal of Latest Trends in Engineering and Technology, Special Issue, 31-35, 2013.
- V. H. Rice, Theories of Stress and Its Relationship to Health. In Rice, V. H. (Ed.) Handbook of Stress, Coping, and Health: Implications for Nursing Research, Theory, and Practice, Detroit: SAGE Publications, Inc, 23-42, 2012.
- A. Baum, M. K. O’Keeffe, and L. M. Davidson, Acute Stressors and Chronic Response: The Case of Traumatic Stress. Journal of Applied Social Psychology, 20(20), 1623-1724, 1990.
- M. R. Salleh, Life Event, Stress and Illness. The Malaysian Journal of Medical Science: MJMS, Pmc, 15(4), 9-18, 2008.
- R. Finlay-Jones, and G. W. Brown, Types of Stressful Life Event and the Onset of Anxiety and Depressive Disorders. Psychol Med, 11(4), 803-15, 1981.
- G. Andrews, C. Tennant, D. M. Hewson, and G. E. Vaillant, Life Event Stress, Social Support, Coping Style, and Risk of Psychological Impairment. The Journal of Nervous and Mental Disease, 166(5), 307-16, 1978.
- R. F. Anda, D. W. Brown, S. R. Dube, J. D. Bremner, V. J. Felitti, and W. H. Giles, Adverse Childhood Experiences and Chronic Obstructive Pulmonary Disease in Adults. American Journal of Preventive Medicine, 34(5), 396-403, 2008.
- F. V. J. Felitti, et al., “Relationship of Childhood Abuse and Household Dysfunction to Many of the Leading Causes of Death in Adults: The Adverse Childhood Experiences (ACE) Study,” American Journal of Preventive Medicine, 14, 245-258, 1998.
- V. J. Felitti, Long-Term Medical Consequences of Incest, Rape, and Molestation. Southern MedicalJjournal, PubMed 84(3), 328-331, 1991.
- V. J. Felitti, Childhood Sexual Abuse, Depression, and Family Dysfunction in Adult Obese Patients: A Case Control Study. Southern Medical Journal, PubMed, 86(7), 732-736, 1993.
- W. R. Lovallo, N. H. Farag, K. H. Sorocco, A. J. Cohoon, and A. S. Vincent, “Lifetime adversity leads to blunted stress axis reactivity: studies from the Oklahoma Family Health Patterns Project,” Biological Psychiatry, 71, 344-349, 2012.
- W. R. Lovallo, “Early life adversity reduces stress reactivity and enhances impulsive behavior: Implications for health behaviors,” International Journal of Psychophysiology, 90, 8-16, 2013.
- L. J. Luecken, Childhood Attachment and Loss Experiences Affect Adult Cardiovascular and Cortisol Function. Psychosomatic Medicine, 60(6), 765-72. 1998.
- L. J. Luecken and D. S. Roubinov, “Hostile behavior links negative childhood family relationships to heart rate reactivity and recovery in young adulthood,” International Journal of Psychophysiology, 84, 172-179, 02/11 2012.
- R. Anda, D. Williamson, D. Jones, C. Macera, E. Eaker, A.Glassman, and J.Marks, “Depressed Affect, Hopelessness, and the Risk of Ischemic Heart Disease in a Cohort of U.S. Adults,” Epidemiology, 4, 285-294, 1993.
- R. F. Anda, et al., “The enduring effects of abuse and related adverse experiences in childhood,” European Archives of Psychiatry and Clinical Neuroscience, 256, 174-186, 2006
- S. V. Batten, D. W. Brown, S. R. Dube, J. D. Bremner, V. J. Felitti, and W. H. Giles, “Childhood Maltreatment as a Risk Factor for Adult Cardiovascular Disease and Depression,” Journal of Clinical Psychiatry, 65, 249-54, Feb 2004.
- M. Dong, et al., “Insights into causal pathways for ischemic heart disease: adverse childhood experiences study,” Circulation, 110, 1761-6, Sep 28 2004.
- W. T. Boyce and B. J. Ellis, “Biological sensitivity to context: I. An evolutionary-developmental theory of the origins and functions of stress reactivity,” Development and Psychopathology, 17, 271-301, Spring 2005.
- J. Ellis, et al., “Biological sensitivity to context: II. Empirical explorations of an evolutionary-developmental theory,” Development and Psychopathology, 17, 303-28, Spring 2005.
- U. R. Acharya, et al., “Heart Rate Variability: A Review,” Medical and Biological Engineering and Computing, 44, 1031-1051, 2006.
- A. P. Allen, et al., “Biological and Psychological Markers of Stress in Humans: Focus on the Trier Social Stress Test,” Neuroscience and Biobehavioral Reviews 38, 94–124, 2014.
- Task Force, “Heart rate variability: Standards of measurement, physiological interpretation, and clinical use. Task Force of the European Society of Cardiology and the North American Society of Pacing and Electrophysiology,” Circulation, 93, 1043-1065, 1996.
- J. F. Thayer, et al., “A meta-analysis of heart rate variability and neuroimaging studies: Implications for heart rate variability as a marker of stress and health,” Neuroscience & Biobehavioral Reviews, 36, 747-756, 2012.
- J. E. Carroll, et al., “Childhood abuse, parental warmth, and adult multisystem biological risk in the Coronary Artery Risk Development in Young Adults study,” Proceedings of the National Academy of Sciences, 110, 17149-17153, 2013.
- K. Winzeler, et al., “Adverse childhood experiences and autonomic regulation in response to acute stress: the role of the sympathetic and parasympathetic nervous systems,” Anxiety, Stress, & Coping, 30, 145-154, 2017/03/04 2017.
- N. Michels, et al., “Relation between salivary cortisol as stress biomarker and dietary pattern in children,” Psychoneuroendocrinology, 38, 1512-1520, 2013.
- N. Michels, et al., “Children’s heart rate variability as stress indicator: Association with reported stress and cortisol,” Biological Psychology, 94, 433-440, 2013.
- A. T. Ginty, et al., “Disordered eating behaviour is associated with blunted cortisol and cardiovascular reactions to acute psychological stress,” Psychoneuroendocrinology, 37,715-724, 5// 2012.
- A. C. Phillips, et al., “Cardiovascular and cortisol reactions to acute psychological stress and adiposity: cross-sectional and prospective associations in the Dutch Famine Birth Cohort Study,” Psychosomatic Medicine, 74, 699-710, Sep 2012.
- D. P. Bernstein, et al., “Development and validation of a brief screening version of the Childhood Trauma Questionnaire,” Child Abuse & Neglect, 27, 169-90, Feb 2003.
- J. Pan and J. W. Tompkins, “A Real-Time QRS Detection Algorithm,” IEEE Transactions on Biomedical Engineering, 32, 230-236, 1985.
- U. R. Acharya, et al., “Automatic Identification of Cardiac Health Using Modeling Techniques: A Comparative Study,” Information Sciences, 178, 4571-4582, 2008.
- R. H. Takalo and H. H. Ihalainen, ” Tutorial on Univariate Autoregressive Spectral Analysis Export,” The Journal of Clinical Monitoring and Computing, 20, 379-379, 2006.
- M. N. Castro, et al., “Heart rate variability response to mental arithmetic stress in patients with schizophrenia: Autonomic response to stress in schizophrenia,” Schizophrenia Research, 99, 294-303, 2008.
- P. Karthikeyan, et al., “Analysis of Stroop Color Word Test-Based Human Stress Detection using Electrocardiography and Heart Rate Variability Signals,” Arabian Journal for Science and Engineering, 39, 1835-1847, 2014.
- J. A. J. Heathers, “Smartphone-enabled pulse rate variability: An alternative methodology for the collection of heart rate variability in psychophysiological research,” International Journal of Psychophysiology, 89, 297-304, 2013.
- B. Barkat and B. Boashash, “A High-Resolution Quadratic Time-Frequency Distribution for Multicomponent Signals Analysis,” IEEE Transactions on Signal Processing, 49, 2232-2239, 2001.
- N. Aimie-Salleh, “Autonomic Function Assessment Tool Using Time-Frequency Analysis of Heart Rate Variability,” Master Thesis, Universiti Teknologi Malaysia, Johor Bahru, 2013.
- M. B. Malarvili and M. Mesbah, “Newborn Seizure Detection Based on Heart Rate Variability,” IEEE Transactions Biomedical Engineering, 56, 2594-2603, 2009.
- D. Giri, et al., “Automated diagnosis of Coronary Artery Disease affected patients using LDA, PCA, ICA and Discrete Wavelet Transform ” Knowledge-Based Systems, 37, 274-282, 2013.
- G. Kheder, et al., “Heart Rate Variability Analysis Using Threshold of Wavelet Package Coefficients ” International Journal on Computer Science and Engineering, 1, 131-136, 2009.
- R. Acharya, U., et al., “Computer-aided Diagnosis of Diabetic Subjects by Heart Rate Variability Signals Using Discrete Wavelet Transform Method,” Knowledge-Based Systems, 81, 56-64, 2015.
- B. Oluleye, A. Leisa, J. Leng, and D. Dean, A Genetic Algorithm-Based Feature Selection. International Journal of Electronics Communication and Computer Engineering, 5(4), 899-905, 2014a.
- B. Oluleye, A. Leisa, J. Leng, and D. Dean, Zernike Moments and Genetic Algorithm : Tutorial and Application. British Journal of Mathematics & Computer Science 4(15), 2217-2236, 2014b.
- N. Akhter, S. Dabhade, N. Bansod, and K. Kale, Feature Selection for Heart Rate Variability Based Biometric Recognition using Genetic Algorithm. In Berretti, S., Thampi, S. M. & Srivastava, P. R. (Ed.) Intelligent Systems Technologies and Applications, Maharashtra, India: Springer International Publishing, 91-101, 2016.
- M. S. Mohamad, S. Deris, S. M. Yatim, and M. R. Othman, Feature Selection Method using Genetic Algorithm for the Classification of Small and High Dimension Data. First International Symposium on Information and Communications Technologies. 7-8 October. Putrajaya, Malaysia, 1-4, 2004.
- H. Shahamat, and A. A. Pouyan, Feature Selection using Genetic Algorithm for Classification of Schizophrenia using FMRI Data. Journal of AI and Data Mining, 3(1), 30-37, 2015.
- S. Ollander, “Wearable Sensor Data Fusion for Human Stress Estimation,” Master Master Thesis, Department of Electrical Engineering, Linköping University, Linköping, 2015.
- J. Yang, et al., “Feature fusion: parallel strategy vs serial strategy,” 36, 1369-1381, 2003.
- N. Sharma and T. Gedeon, “Objective measures, sensors and computational techniques for stress recognition and classification: A survey,” Computer Methods and Programs in Biomedicine, 108, 1287-1302, 2012.
- J. Zhai and A. Barreto, “Stress Detection in Computer Users Based on Digital Signal Processing of Noninvasive Physiological Variables,” in Annual International Conference of the IEEE Engineering in Medicine and Biology Society, New York, 2006, 1355-1358.
- Z. B. Siao, et al., “Human emotional stress analysis through time domain electromyogram features,” in 2013 IEEE Symposium on Industrial Electronics & Applications, 2013, 172-177.
- J.-S. Wang, et al., “A k-nearest-neighbor classifier with heart rate variability feature-based transformation algorithm for driving stress recognition,” Neurocomputing, 116, 136-143, 2013.
- A. Birkhofer, et al., “The deceleration capacity – a new measure of heart rate variability evaluated in patients with schizophrenia and antipsychotic treatment,” European Psychiatry, 28,81-86, 2013.
- A. Deepak, et al., “Time Domain Measures of Heart Rate Variability during Acute Mental Stress in Type 2 Diabetics: A Case Control Study,” National Journal of Physiology, Pharmacy & Pharmacology, 4, 34 – 38, 2014.
- A. Muaremi, et al., “Towards Measuring Stress with Smartphones and Wearable Devices During Workday and Sleep,” BioNanoScience, 3, 172-183, 2013.
- R. Bailon, et al., “Time-Frequency Analysis of Heart Rate Variability During Stress Testing Using “A Priori” Information of Respiratory Frequency,” in Computers in Cardiology, Valencia, Spain, 169-172, 2006.
- H. M. Seong, et al., “The Analysis of Mental Stress using Time-Frequency Distribution of Heart Rate Variability Signal,” in Proceedings of the 26th Annual International Conference of the IEEE Engineering in Medicine and Biology Society, San Francisco, California, 2004, 283-295.
- W. S. Liew, et al., “Classifying Stress From Heart Rate Variability Using Salivary Biomarkers as Reference,” IEEE Transactions on Neural Networks and Learning Systems, 27, 2035-2046, 2016.
- K. A. Kendall-Tackett, “The health effects of childhood abuse: four pathways by which abuse can influence health,” Child Abuse & Neglect 26, 715-29, Jun 2002.
- J. P. Shonkoff, et al., “Neuroscience, molecular biology, and the childhood roots of health disparities: Building a new framework for health promotion and disease prevention,” JAMA, 301, 2252-2259, 2009.