The Impact of Manufactured Sand (M-Sand) as Partially and Fully Replacement of Fine Aggregate in Concrete
Volume 5, Issue 1, Page No 302-306, 2020
Author’s Name: Altamashuddinkhan Nadimalla1,a), Siti Aliyyah Masjuki1, Siti Asmahani Saad1, Ean Lee Woen2, Siti Maisarah Ali1, Naseer Ulla3
View Affiliations
1Civil Engineering Department, International Islamic University Malaysia, 53100, Malaysia
2Institute of Sustainable Energy, Universiti Tenaga Nasional, 43000, Malaysia
3Civil Engineering Department, Bearys Institute of Technology, 574153, India
a)Author to whom correspondence should be addressed. E-mail: altamashk1987@gmail.com
Adv. Sci. Technol. Eng. Syst. J. 5(1), 302-306 (2020); ![]() DOI: 10.25046/aj050138
DOI: 10.25046/aj050138
Keywords: Flexural test, Impact test, compression test
Export Citations
In fast charging station for Battery Electric Vehicles (BEVs) the three-phase PWM (Pulse Width Modulation) inverters generate parasitic Differential-Mode Voltages (DMV) and Common-Mode Voltages (CMV). Parasitic voltages are a side effect of using the width modulation to shape the phase-to-phase inverter’s voltage. In this article the authors present a mathematical description of the differential-mode (DM) and common-mode (CM) voltages and carry out their spectral analysis. Based on the spectral harmonics analysis, the authors present a method for filtration of harmonics of DM and CM voltages aimed at limiting the capacitance parasitic currents: due to DM voltage – phase-to-phase parasitic current and CM voltage – ground parasitic currents. A resonant filter was used to eliminate harmonics of the input rectifier of the DC/DC converter supplied from a voltage inverter. As a result of tests, the T HD harmonic content factor was significantly reduced and ground leakage ted from the PE electric shock protection system.
Received: 14 October 2019, Accepted: 23 January 2020, Published Online: 10 February 2020
1. Introduction
This paper is an extension of work originally presented in conference IEEE 5th International Conference on Engineering Technologies & Applied Sciences, 22- 23 Nov 2018, Bangkok Thailand [1]. In the world, fine aggregate, probably natural sand, composes up to 30% of the volume of concrete, it is around 4 billion tons sand is required to meet annual necessity of concrete production [2]. Increasing in excavation of river sand from riverbeds leads to serious threat to environment [3]. Due to the limiting resources of river sand, alternatively M sand can be used. [1]–[10]. The Manufactured sand is produced by crushing the rocks [5] [10].
The impact of M-Sand on the concrete properties:
Higher split tensile strength, higher compressive strength, & higher flexural strength can be attained by the 50% substitution of of fine aggregate by M Sand [5], [6],[10]. It is due to the angular in shape of M sand gives good bonding between cement and aggregate. Gradual increase in strength can be obtained by 50% replacing river sand by M sand. [4]. Gained higher strength at 60% by substituting the river sand by M sand at various proportions such as 0%, 20%, 40%, 60% and 80% [14]. The concrete flexural strength increased up to 2% and 4.3% by 25% and 100% incorporation of river sand by M sand[15]. Compared to the air curing and standard moist curing, the membrane curing will give the good strength in both river sand and M sand. Addition of Super Absorbent Polymer leads to a significant increase of mechanical properties of the concrete [16].
The M sand properties are very much similar to river sand so nowadays, instead of river sand, M sand can be used in place of river sand[11] , by utilizing M sand in alternative of river sand the workability of concrete will decreases[12], the workability can be gained by adding water reducing admixtures [16].
It was observed that if river sand is completely replaced by M sand, M sand has greater resistance to loss in strength as compared to river sand, if specimen is immersed in chemicals. The Combined replacement of M sand and Marble powder upto 25% by river sand increased the concrete strength [17].
Compressive strength increased by approximately 10% for 28 days of curing, when river sand fully substituted by M sand [2]. It has been recorded that the compressive Strength enhance up to 50% incorporation of river sand by M-sand sand and introduction of 2% to 6% waste plastics [18].
The 100% incorporation of natural sand by M sand, it helps in increase in paste volume as compare to river sand, which is useful to produce self-compacting concrete. Increase in paste volume is due presence of high fines in M sand, which increases the water demand also [19].
Manufactured sand is suitable as alternative for river sand at affordable cost. It will act as cohesive cement mortar. It helps environment to maintaining the economical balance [3] [19].
2. Objective
- To inspect the properties of M-sand
- To examine the impact of M-sand on fresh and hard properties of concrete.
- To investigate the comparison of the, flexural Strength, compressive strength and Impact sstrength achieved by the cubes and beams in river sand and M-sand.
3. Materials and Its Properties
3.1. Cement
In this research Ordinary Portland Cement (53 grade) was used. As per IS: 8112-1989 Cement Properties are determined as tabulated in Table 1.
Table 1: Cement Properties
| Properties | Result | IS code Requirement | |
| Specific gravity | 3.05 | ||
| Standard consistency | 31% | ||
| Setting time | Initial(Minutes) | 33 min | 30 minimum |
| Final(Minutes) | 380 min | 600 maximum | |
| Compressive strength (MPa) | 7 days | 32 | 33 |
| 28 days | 46 | 43 | |
3.2. Fine Aggregates
The river sand was collected from the Mangalore local area which is excavated from riverbeds. The sieve analysis of river sand is tabulated in Table 2 and shown in Figure 3.
Table 2: Sieve analysis of river sand
| SL No | Sieve Designation | Percentage Passing | Grading Limits for Zone II Sand (IS383) |
| 1 | 4.75 mm | 99 | 90-100 |
| 2 | 2.36 mm | 87.8 | 75-100 |
| 3 | 1.18 mm | 54.6 | 55-90 |
| 4 | 600 micron | 37.6 | 35.59 |
| 5 | 3000 micron | 12.6 | 8-30 |
| 6 | 150 micron | 6.4 | 0-10 |
| 7 | 75 micron | 2 | 0-10 |
From the sieve analysis test the river sand and M-sand fineness value are 3 and 3.45 respectively, both falls under zone-2, it shows the M-sand properties is similar to river sand, M-sand is slightly coarser as compared to river sand. The sieve analysis of M sand is shown in Table 3 and Figure 4
Table 3: Sieve analysis of M- Sand
| SL No | Sieve Designation | Percentage Passing | Grading Limits for Zone II Sand (IS383) |
| 1 | 4.75 mm | 100 | 90-100 |
| 2 | 2.36 mm | 91 | 75-100 |
| 3 | 1.18 mm | 61.2 | 55-90 |
| 4 | 600 micron | 48.3 | 35.59 |
| 5 | 300 micron | 27.4 | 8-30 |
| 6 | 150 micron | 13.8 | 0-10 |
| 7 | 75 micron | 3.8 | 0-10 |
3.3. Coarse Aggregate
The 20mm down size crushed stone is used in this research. Table 4 and Figure 5 shows the Coarse aggregate sieve analysis.
Table 4: Sieve analysis of Coarse Aggregate
| SL No | Sieve Designation | Percentage Passing | Gradation requirement as per IS 383-1970 for grade II | Remark |
| 1 | 40 | 100 | 100 | As per IS 383 the sample confirms the graded aggregate |
| 2 | 20 | 98 | 95-100 | |
| 3 | 10 | 46 | 25-50 | |
| 4 | 4.75 | 0.8 | 1-10 |
3.4. Mix Design
In this research work a mix design 1:2.32:2.82 ( M20) is considered.
Table 5: Mix Design
| Mix Design | Cement (kg/m3) | Aggregate (kg/m3) | w/c Ratio | Water (l) | |
| Fine | Coarse | ||||
| 1:2.32:2.82 | 358 | 829.67 | 1009.96 | 0.55 | 197 |
4. Fresh Properties of Concrete
4.1. Slump test
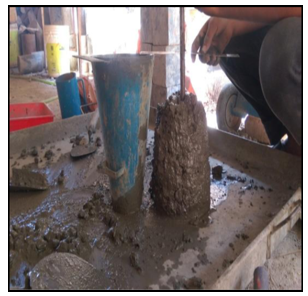
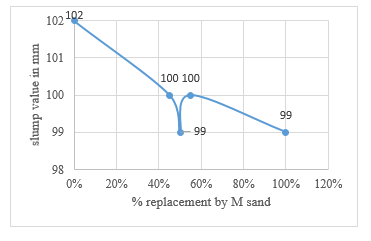
The workability of concrete was estimated by using slump test. Figure 6 and Table 6 shows that slightly decrease in the slump value as M sand increases.
Table 6: Slump test
| Percentage of M Sand | Slump Value (mm) |
| 0% | 102 |
| 45% | 100 |
| 50% | 99 |
| 55% | 100 |
| 100% | 99 |
5. Hard properties of Concrete
5.1. Compressive Strength test
The tests were carried out on 150mm* 150mm*150mm size of cubes. The outcomes is displayed in Figure 8.
Figure 8 shows the compressive strength for results for 7days, 28 days and 90 days curing, it is detected that the compressive strength increased for 100% and 55% of replacement of M Sand by river sand, 100% and 55% incoporation of M sand can be advised to use as fine aggregate.
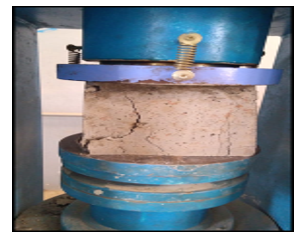 Figure 2: Compressive strength test
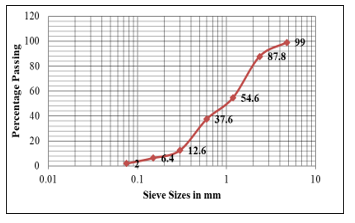 Figure 3: Sieve analysis of River Sand
5.2. Flexural strength test
The tests were carried out on beams of width 150 mm length 150 mm and 70 mm thickness. Figure 9 shows the flexural strength for results 7days, 28 days and 90 days curing, it is observed that the flexural strength increased for 100% and 55% of incorporation of M Sand by river sand, 100% and 55% incorporation of M sand can be advised to use as fine aggregate.
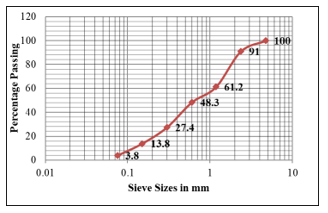 Figure 4: Sieve analysis of M Sand
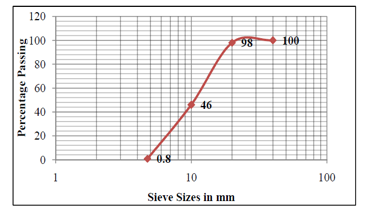 Figure 5: Grain size distribution of Coarse Aggregate
5.3. Impact Test Results
Figure 10 shows the variation in impact test results of the concrete specimen prepared by replacing natural sand by M-sand at the percentages of 0%, 45%, 50%, 55% and 100%. Results shows that energy consumption in 55% and 100% replacement shows increase in energy consumption that is about 47.99% and 40% for initial crack, 48.38% and 38.7% for ultimate failure when compare to 0% replacement. It can be concluded that 100% and 55% substitution of river sand by M sand has a threshold values for an optimal performance in energy adsorption and crack resistance.
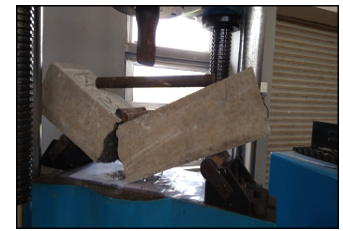 Figure 6: Flexural strength test
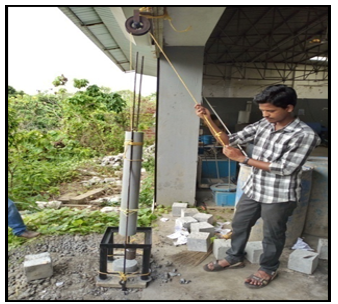 Figure 7: Impact test on concrete
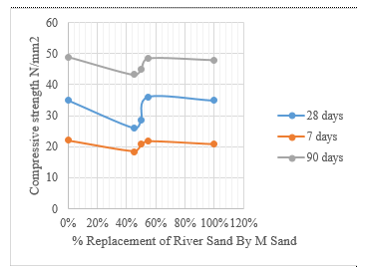 Figure 8: Compressive strength test graph
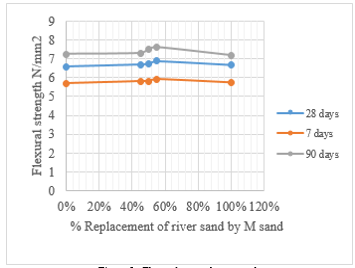 Figure 9: Flexural strength test graph
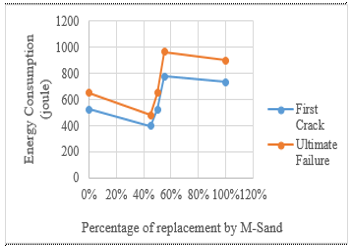 Figure 10: Variation in Energy Consumption for M20 grade Concrete Specimen
Conclusion
M-sand and River sand fineness value are 3 and 3.45 respectively, both falls under zone-2, it shows the M-sand properties is similar to river sand, M-sand is slightly coarser as compared to river sand.
By 100% and 55% incorporation of M sand by river sand concrete can achieve higher flexural strength and compressive strength of concrete at 7 days, 28 days and 90 days.
Concrete can achieve optimal performance in energy adsorption and crack resistance by 100% and 55% substitution river sand by M-sand.
An incorporation of 100% and 55% of M sand can be advised to use as fine aggregate to enhance the strength of Concrete.
Acknowledgement
The authors would like to acknowledge financial support from iRMC Bold2025, Universiti Tenaga Nasional, Malaysia.Grant Code: RJO 1043 6494.
- Hansen S., Asiminoaei L., Blaabjerg F., Simple and Advanced Methods for Calculating Six-Pulse Diode Rectifier Line-Side Harmonics, 38th IAS Annual Meeting. Conference Record of the Industry Applications, vol. 3, 2003, pp. 2056 – 2062, DOI:10.1109/IAS.2003.1257849.
- Szymanski J., Common and differential mode voltage in frequency conventer drive systems. ElektroInfo, vol. 11, 2013. (article in Polish with an abstract in English).
- Li X., Xing X., Zhang Ch., Chen A., Qin Ch., Zhang G., Simultaneous Common-Mode Resonance Circulating Current and Leakage Current Sup- pression for Transformerless Three-Level T-Type PV Inverter System, IEEE Transactions on Industrial Electronics, Volume: 66 , Issue: 6 , June 2019, DOI: 10.1109/TIE.2018.2860555.
- Trivedi N., Gujar N., Sarkar S., Pundir S.P.S., Different fast charging methods and topologies for EV charging, 2018 IEEMA Engineer Infinite Conference,
DOI: 10.1109/ETECHNXT.2018.8385313 - Szymanski J., Zurek-Mortka M., Harmonic Resonant Filters of Quick Battery Charging Station of Motor Vehicles, 23rd International Conference Electronics,
IEEE, 2019, DOI: 10.1109/ELECTRONICS.2019.8765691 - Zurek-Mortka M., Szymanski J.: Reactive power compensation in a harmonic environment. elektro.info, vol. 10, 2018. (article in Polish with an abstract in English).
- Pedzisz K. Capacitor banks measuring analysis and operating condition assess- ment in industrial environment, Journal Electrical engineering and electronics, vol. 27, p.2, 2008.
- Kempski A., Smolen´ski R., Decomposition of EMI Noise Into Common and Directional Modes in PWM Inverter Drive System. Electrical Power Quality and Utilization, 12 (no. 1), 2006.
- Pairodamonchai P., Sangwongwanich S., Exact Common-Mode And Directional-Mode Equivalent Circuits of In-verters in Motor Drive Systems Taking Into Account Input Rectifiers. IEEE PEDS’11, Singapore, 5-8 Decem- ber, 2011.
- Ambrozic, V., Zajec P., Elektricni Servo Pogoni, Slovensko zdruz-enje elek- troenergetikov CIGRE-CIRED, Ljubljana 2016.
- Szymanski J., The Voltage of Common-Mode Disturbances in Frequency Con- verters in Railway Systems. Monography, UTH Radom, 2015.
- Tallam R. M., Skibinski G. L., Shudarek T. A., Lukaszewski R. A. Common- mode voltage reduction PWM algorithm for AC Drives, IEEE Transac- tions on Industry Applications, vol. 46, no. 5, pp. 1959–1969, 2010. DOI: 10.1109/TIA.2010.2057396.
- Takahashi S., Ogasawara S., Takemoto M., Orikawa K., Tamate M., Common- Mode Voltage Attenuation of an Active Common-Mode Filter in a Motor Drive System Fed by a PWM Inverter, IEEE Transactions on Industry Applications, pp.1-1, 2019. DOI: 10.1109/ICEMS.2017.8056376.
- Danfoss, Output filters design guide – MG90N402, 2010.
- Czapp S. Operation of residual current devices at an increased frequency of differential current. ElektroInfo, vol.10, 2008. (article in Polish with an abstract in English).
- Charoy A., Dunand Ph., Bearing currents induced by a power drive. Automotive Power Electronics, 26 – 27 Sept., Paris, pp.1-7, 2007.
- Park J.K., Kim Y.H., Jung Y.Ch., Won Ch.Y., A novel control strategy of an active clamped flyback inverter with synchronous rectifier for a photovoltaic AC module system, 8th International Conference on Power Electronics – ECCE Asia, 2011. DOI: 10.1109/ICPE.2011.5944557.
- Genikomaskis K.N., Gutierrez I.A., Thomas D., Ioakimidis C.S., Simulation and design of fast-charging infrastructure for a university-based e-Carshring System, IEEE Transactions of Intelligent Transportation Systems, vol.19, no.9, 2018. pp. 2923–2932. DOI: 10.1109/TITS.2017.2767779
Citations by Dimensions
Citations by PlumX
Google Scholar
Scopus
Crossref Citations
- Yash Rathore, Juned Raheem, "The Evolution, Characteristics, and Potential of Manufactured Sand in Concrete: A Short Review." National Academy Science Letters, vol. , no. , pp. , 2025.
- Muhammad Fadhlullah Abu Bakar, Norlela Ismail, Shuhairy Norhisham, Nor Aishah Ahad, Friday Zinzendoff Okwonu, Wan Ahmad Faiz Wan Mohd Fauzi, Nor Najwa Irina Mohd Azlan, Nurul Hani Mardi, Hayana Dullah, "Assessing the Impact of Quality of Service (QOS) Toward Urban Bus Performance in Perlis." In Advances in Civil Engineering Materials, Publisher, Location, 2023.
- Muhammad Fadhlullah Abu Bakar, Norlela Ismail, Shuhairy Norhisham, Nor Aishah Ahad, Friday Zinzendoff Okwonu, Shahril Ezwan Mohamad Nor, Nor Najwa Irina Mohd Azlan, Nur’Atiah Zaini, Hayana Dullah, "Assessing the Passenger Load of Urban Bus Performance in Eastern Region Malaysia Peninsular." In Advances in Civil Engineering Materials, Publisher, Location, 2023.
No. of Downloads Per Month
No. of Downloads Per Country

