
Design and Optimization of ZnO Nanostructured SAW-Based Ethylene Gas Sensor with Modified Electrode Orientation
Volume 5, Issue 1, Page No 263-266, 2020
Author’s Name: Argha Sarkar1,a), Padarthi Venkataramana1, Nimmala Harathi2, Thummuru Jyothsna1, Neeruganti Vikram Teja1
View Affiliations
1Nanoelectronics Lab, Department of ECE, Sree Vidyanikethan Engineering College, 517102, India
2Nanoelectronics Lab, Sree Vidyanikethan Engineering College, 517102, India
a)Author to whom correspondence should be addressed. E-mail: argha15@gmail.com
Adv. Sci. Technol. Eng. Syst. J. 5(1), 263-266 (2020); ![]() DOI: 10.25046/aj050133
DOI: 10.25046/aj050133
Keywords: Surface Acoustic Wave, Hexagonal ZnO Nanorod, Interdigitated Transducer, Sensitivity

Export Citations
Here the work approaches the detection of fruit maturity level. In addition, a gas sensor is proposed to obtain better sensitivity to know the level of ethylene gas released from matured fruit. Better sensitivity can be achieved by obtaining an enhanced active area, changing the intermediate layer thickness and the pitch value of the electrode. Hexagonal nanostructured zinc oxide is used as a sensing layer. Finally, frequency shift and a total displacement of the device are increased. The hexagonal structured ZnO nanorod-based surface acoustic wave gas sensor may be used to detect ethylene gas in fruit ripening sensor with enhanced sensitivity. This paper reports a simulation of Surface Acoustic Wave (SAW) wave propagation with respect to interdigitated transducer (IDT), piezoelectric material and sensing layers.
Received: 01 November 2019, Accepted: 19 January 2020, Published Online: 27 January 2020
1. Introduction
It is becoming very important to design a highly sensitive fruit monitoring system to determine the storage life of fruit and quality. Based on the maturity level of fruit the decision may be taken regarding transportation, consumption, etc. The ripe fruits are very tough to handle as they become soft and squashy with an insipid smell and they cannot withstand transportation from one place to another. Hence it is important to monitor the state when they are mature. Skin color, hardness, size, and smell are the common parameters to get an idea about the fruit ripening. But these are basically assumption-based assessment, so it is havening an issue of reliability [1].
Ethylene (C2H4) is one of the organic gases which is formed in the ripening process of climacteric fruits. These fruits (eg. Mango, guava, banana, apricot, kiwi, palm, etc.) liberate C2H4 during ripening process [2-4]. Climacteric fruits pass through climacteric state after harvesting. A small dose of C2H4 in a controlled environment can simulate the ripening process of those climacteric fruits. So, if the maturity levels of these fruits are detected efficiently then they can be easily stored or transported after harvesting. On the other hand, non-climacteric fruits [5] emits a little amount of C2H4 and they are in a position to harvest only when completely ripened.
Herein, the work focuses on the development of surface acoustic wave-based ethylene gas sensor for detection of fruit ripening at different maturity stages. Detecting the C2H4 gas concentrations that has been liberated by fruits, may evaluate the maturity stage and the shelf span can be estimated [6]. In this study, a SAW-based sensor is designed and sensitivity is analyzed. Interigitated transducer (IDT), piezoelectric material and sensing layers are a major consideration while designing a SAW sensor. Pitch is one of the important parameters to determine the synchronous frequency. On the surface of the piezoelectric material, aluminum IDT generates acoustic wave from electrical signal by producing a mechanical force [7-8]. Adsorption of target gas molecules take place on the sensing material, which happens between the two IDTs. ZnO nanorod based SAW sensor is designed and wave properties are studied. Parameters like device length, height, intermediate layer thickness, and IDT thickness are optimized through simulation study to obtain enhanced sensitivity.
2. Sensor’s Working Principle
The template SAW gas sensors are dominant from other sensors because of detection of physical, biological, and chemical quantities. It is only due to minimized insertion loss, increased sensitivity, and gas detection capability. Their fundamental operation is based on the changes in a propagating acoustic wave due to the target gas interaction, which depends on the the propagation medium, mass density, electric–dielectric behavior and the elastic stiffness of the piezoelectric materials. Due to the piezoelectric effect, electrical signal is generated when the acoustic wave travels from the surface of the device substrate to an IDT. In SAW based gas sensor, a piezoelectric material plays a major role as a transducer. It transforms a signal from electrical to mechanical wave by utilizing the piezoelectric effect. Piezoelectric effect relates structural mechanics with the electrostatic field. The electric charge is created when a sinusoidal signal is applied to a piezoelectric material. The properties of a piezoelectric material rely on some important parameter like electric flux ( ), resonating frequency ( ), and stress ( ). The functionalities of the SAW device are highly dependable on those parameters. To obtain the electrostatic fields ( ) [9] from the equation 1, it is important to know about the parameters like stress vector ( ), strain vector ( ), electric field ( ), dielectric matrix (e), piezoelectric matrix ( ) and elasticity matrix ( ).
![]() From equation 1 it is cleared that it is required to know the structural mechanics of piezoelectric material [7,10]. Equation 2 is to find out the value of T.
From equation 1 it is cleared that it is required to know the structural mechanics of piezoelectric material [7,10]. Equation 2 is to find out the value of T.
![]() Device efficiency is high when input signal frequency matches with resonating frequency. The resonating frequency of a SAW device is associated with propagation velocity ( ) of the acoustic wave and the pitch value ( ) (shown in equation 3 [11-12]).
Device efficiency is high when input signal frequency matches with resonating frequency. The resonating frequency of a SAW device is associated with propagation velocity ( ) of the acoustic wave and the pitch value ( ) (shown in equation 3 [11-12]).
![]() As per the equation 4, the central wavelength SAW sensor can easily be found from the electrode pitch ( ) and finger width ( ).
As per the equation 4, the central wavelength SAW sensor can easily be found from the electrode pitch ( ) and finger width ( ).
![]() IDT plays a vital role to obtain enhanced SAW sensor response. The lengths of the IDT, finger width, pitch are the important considerations. Bandwidth ( ), acoustic wave frequencies are decided based on input IDT. For a specific operating frequency, the range of acoustic wave frequencies, can be enhanced by optimizing the number of pair of fingers ( ) in IDT. Mathematically the bandwidth can be defined as [7,11],
IDT plays a vital role to obtain enhanced SAW sensor response. The lengths of the IDT, finger width, pitch are the important considerations. Bandwidth ( ), acoustic wave frequencies are decided based on input IDT. For a specific operating frequency, the range of acoustic wave frequencies, can be enhanced by optimizing the number of pair of fingers ( ) in IDT. Mathematically the bandwidth can be defined as [7,11],
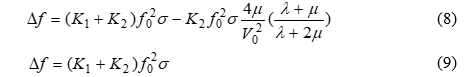
 A sharp signal may be obtained by minimizing the bandwidth [11]. From equation 7 it can be said that bandwidth is inversely related to the length of the IDT. The sensing mechanism is mainly based on the adsorption phenomenon. When the sensor is placed in the target gas environment, target gas molecules are adsorbed on the surface of the sensing layer. It results in a change in the wave velocity. Because of the mass loading effect [13-14] there must be a frequency shift (given in equation 8) by which the detection can be performed.
 (By neglecting the right part of equation 8)
Where is the areal density of the layer after gas adsorption and are signify Lame constant and shear modulus of the film respectively. If the value of is low, there will be no significant change in frequency. It is not desired for a highly sensitive sensor. is required to be significantly higher value. From equation 8 it can be said that gives the maximum frequency deviation. For a piezoelectric material LiNbO3 and sensing layer ZnO, the value of shear modulus related expression becomes so small that can be ignored [14]. The reduced expression is shown in equation 9.
current designations.
3. Sensor Design and Simulations
Comsol Multiphysics 5.5 ® is considered to design and simulate the SAW-based gas sensor. Herein, initially simple ZnO based SAW gas sensor is considered and then it is embedded with ZnO nanorods of the surface of the ZnO sensing layer. Optimization of the delay-line two port configuration and applied frequency results in device performance. The important parameter of piezoelectric material lithium niobate is having a higher value of coupling coefficient and surface acoustic wave velocity. Lithium niobate is considered as a substrate material to optimize the device. The mass loading effect results after embedding MEMS module on the piezoelectric device. The frequency potential and displacement of the surface can be determined by using COMSOL Multiphysics. Sensing layer plays a vital part to get higher sensitivity. ZnO [15] is found to be an appropriate material towards gas sensing and it is also available in the list of built-in material in this simulation environment.
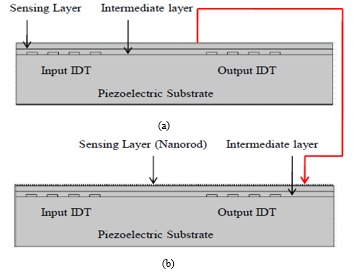 Figure. 1 Side view of the layout of (a) layered (b) Hexagonal nanostructured SAW gas sensor
The dimensions of the IDTs can be calculated by using equation 4 of 100 MHz signal frequency. Figure 1 a. shows the layout of the layered SAW gas sensor. Hexagonal nanorods are added on the nanolayered structure to obtain enhanced sensitivity. The sensitivity study is done based on the effect of hexagonal nanorods. In both cases, the simulation study is done with different values of device length, height, intermediate layer thickness, and IDT thickness. Here Figure. 1 (a) and (b) are the optimized design layouts.
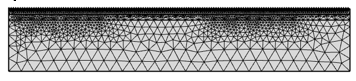 Figure. 2 2D meshing analysis of a SAW Sensor as the sensing material with nanorods
Where device length is 30 µm and its height is 4 µm. The thickness of the intermediate layer is 0.2 µm and ZnO layer is of 0.5 µm. The aluminum is taken as IDT material. The width of the IDTs is 1µm and height 0.1µm. To avoid the second order effect, electrodes are considered as a massless electrode. Figure. 2 represents the two dimensional cross sectional layout after doing the meshing. The node size is taken in such a way so that it becomes less than the wavelength and compensates the appropriate harmonics. Figure. 2 also ensures that the maximum number of nodes present is below the IDT location.
Where device length is 30 µm and its height is 4 µm. The thickness of the intermediate layer is 0.2 µm and ZnO layer is of 0.5 µm. The aluminum is taken as IDT material. The width of the IDTs is 1µm and height 0.1µm. To avoid the second order effect, electrodes are considered as a massless electrode. Figure. 2 represents the two dimensional cross sectional layout after doing the meshing. The node size is taken in such a way so that it becomes less than the wavelength and compensates the appropriate harmonics. Figure. 2 also ensures that the maximum number of nodes present is below the IDT location.
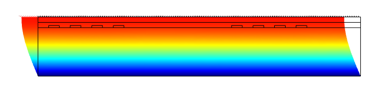 Figure. 3 Simulation of SAW Sensor as the Sensing Material with nanorods
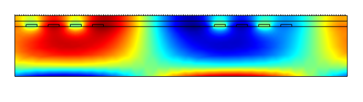 Figure. 4 Simulation of SAW Sensor as the Sensing Material with nanorods after exposing to gas
During the operation of the SAW device, a 150 Hz sinusoidal signal is given to the input IDT. It results in an electric field between the two opposite polarity IDT fingers. As the substrate is the piezoelectric material, due to the piezoelectric effect tensile and comprehensive strain will be created. Thus mechanical wave will appear. The wave will propagate through the surface of the material. Reflector and absorber are used to minimize the effect of insertion loss. When the analytes (ethylene) comes in contact with the sensing platform, sensing layer adsorbs the gas and results in increment in resonant frequency. Here, the sensing layer acts a vital role. By achieving higher surface to volume ratio of the nanostructured sensing material it can be expected that the adsorption of the target gas may be increased which in turn results in enhanced sensitivity. In this simulation study, the presence of ethylene gas is detected through the displacement in resonant frequency. Once the ethylene is detected with higher sensitivity, it will become easy to ensure the ripening state of the fruit.
4. Result and Analysis
After meshing and simulation (shown in Figure. 2 to Figure. 4) different colors have appeared. It is due to the applied voltage. More energy is confined above at the surface of the piezoelectric material [16]. Surface acoustic wave can be seen at the surface of the substrate yielding a noticeably change in propagation properties. The thickness of the sensing layer may effect on the sensitivity. A complete analogy of total displacement with respect to the device is shown in Figure. 5 and Figure. 6 upon exposure to ethylene gas.
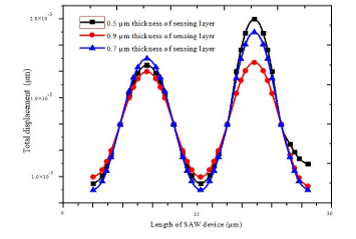 Figure. 5 Total displacements versus device length by varying the thickness of sensing layer
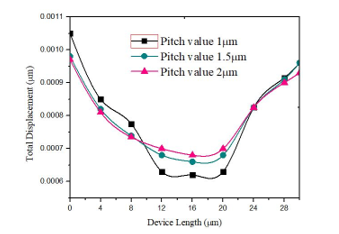 Figure. 6 Total displacements versus device length by varying the pitch value of IDT
Figure. 5 confirms that 0.5 µm thickness of the sensing layer provides increased displacement thus sensitivity. The dependency of sensitivity on pitch value is studied in Figure. 6. Aluminum is chosen as an IDT material because of its low sensitivity and low cost. Different pitch value of 1 µm, 1.5 µm and 2 µm are considered and it is found that 2 µm provides higher displacement of SAW at both input and output and output for a device length ranging from 8 to 20 microns. It results in enhanced sensitivity [17].
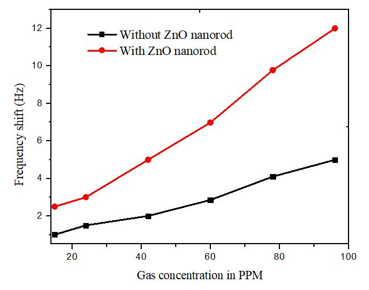 Figure. 7 Frequency shift due to gas exposure in presence and absence of ZnO nanorod
The frequency shift of the sensor is observed because of the different concentration of the target gas. The shift of frequency is present due to C2H4 gas release from fruit. The effects of ZnO nanorods on sensitivity are studied in Figure. 7. The presence of ZnO nanorod over the ZnO sensing layer exhibits better frequency shift compared to bared ZnO layered SAW sensor. Simulation results assure that ZnO nanorod based SAW sensor provides higher sensitivity. It is due to increased surface to volume ratio. Hexagonal nanorod provides increased surface to volume ratio i.e. more active region on the sensing layer which results more reaction with target analyte and increased displacement.
5. Conclusion
All An ethylene gas sensor to measure the fruit maturity is designed and simulated in COMSOL Multiphysics to study the results in resonant frequency by using ZnO sensing layer with proper electrode orientation. Furthermore, the ZnO nanorods are considered to obtain better sensitivity. A comparative study based ZnO layered and nanorod based sensors are performed in COMSOL Multiphysics. It reveals that nanorod based sensor provides enhanced frequency shift due to its higher surface to volume ratio in hexagonal structure. The displacement in resonant frequency is because of adsorption of the analyte by the sensing layer. Here future work includes the fabrication of ZnO nanorod and SAW sensor to verify the simulation results.
Conflict of Interest
The authors declare no conflict of interest.
Acknowledgment
The authors would like to acknowledge Sree Vidyanikethan Engineering College for infrastructural and laboratory support.
- T. Barboni, , M. Cannac, N. Chiaramonti, “Effect of cold storage and ozone treatment on physicochemical parameters, soluble sugars and organic acids in Actinidia deliciosa” Food chem., 121(4), 946-951, 2010. https://doi.org/10.1016/j.foodchem.2010.01.024
- S.P. Burg, E. A. Burg, “Relationship between ethylene production and ripening in bananas” Bot. Gaz., 126(3), 200-204, 1965. https://doi.org/10.1086/336320
- P. P. Iannetta, L. J. Laarhoven, Medina-Escobar, E. K. James, M.T. McManus, H.V. Davies, F.J. Harren, “Ethylene and carbon dioxide production by developing strawberries show a correlative pattern that is indicative of ripening climacteric fruit” Physiol. Plant., 127(2), 247-259, 2006. https://doi.org/10.1111/j.1399-3054.2006.00656.x
- C.S Barry, J. J. Giovannoni, “Ethylene and fruit ripening” J. Plant Growth Regul., 26(2), 143, 2007. https://doi.org/10.1007/s00344-007-9002-y
- S. O. Nelson, W. Guo, S. Trabelsi, Investigation of dielectric sensing for fruit quality determination. IEEE Sensors Applications Symposium, February, Atlanta, GA, USA. pp. 54-56, (2008). https://doi.org/10.1007/s00344-007-9002-y
- S. Janssen, K. Schmitt, , M. Blanke, M. L. Bauersfeld, J. Wöllenstein, W. Lang, “Ethylene detection in fruit supply chains” Phil. Trans. R. Soc. A: Mathematical, Physical and Engineering Sciences, 372(2017), 20130311, 2014. https://doi.org/10.1098/rsta.2013.0311
- J. Kirschner, “Surface Acoustic Wave Sensors (SAWS)” Micromechanical Syst., 1-11, 2010. https://doi.org/10.18689/mjnn-1000109
- M. Anand, ed., Study of tin oxide for hydrogen gas sensor applications. Thesis Scholar Commons University of South Florida, 2005.
- E. Comini, G. Faglia, G. Giorgio, Solid State Gas Sensing, Springer, 2009.
- Ballantine Jr, D.S., White, R.M., Martin, S.J., Ricco, A.J., Zellers, E.T., Frye, G.C. and Wohltjen, H., eds. Acoustic wave sensors: theory, design and physico-chemical applications. Elsevier, 1996.
- S. Capone, A. Forleo, L. Francioso, R. Rella, P. Siciliano, J. Spadavecchia, D. S. Presicce, A. M. Taurino, “Solid state gas sensors: state of the art and future activities” J Optoelectron Adv M, 5(5), 1335-1348, 2003. 10.1002/chin.200429283
- F. Nawaz, V. Jeoti, “SAW sensor read range limitations and perspectives” Wireless networks, 20(8), 2581-2587, 2014. https://doi.org/10.1007/s11276-014-0765-3
- M. N. Hasan, D. Acharjee , D. Kumar, S. Maity, “Simulation of low power heater for gas sensing application” Procedia Comput. Sci., 92 (2016), 213 – 221, 2016. 10.1016/j.procs.2016.07.348
- M. N. Hasan, S. Maity, A. Sarkar, C. T. Bhunia, D. Acharjee, A. M. Joseph, “Simulation and fabrication of SAW-based gas sensor with modified surface state of active layer and electrode orientation for enhanced H2 gas sensing” JEM, 46(2), 679-686, 2017. https://doi.org/10.1007/s11664-016-5128-7
- A. Sarkar, S. Maity, C.T. Bhunia, P.P. Sahu, “Responsivity optimization of methane gas sensor through the modification of hexagonal nanorod and reduction of defect states” Superlattices and Microstruct., 102, 459-469, 2017. https://doi.org/10.1016/j.spmi.2017.01.006
- G. Di Francia, B. V. Alfano, La Ferrara, “Conductometric gas nanosensors” J. Sens., 2009, pp 1-18, 2009. https://doi.org/10.1155/2009/659275
- G. Zhang, “Nanostructure-enhanced surface acoustic waves biosensor and its computational modeling” Journal of Sensors, 2009, 1-11, 2009. https://doi.org/10.1155/2009/215085