Alternative Financing Model for Smart Cities Initiatives in Indonesia

Adv. Sci. Technol. Eng. Syst. J. 5(1), 212–221 (2020);
 DOI: 10.25046/aj050127
Currently Indonesia is working actively in the implementation of the Smart Cities initiative program. However, to be able to apply the concept, there are three main elements that must be prepared as the basic foundation. These elements are structure, infrastructure, and superstructure. In this study we focused on the problem of the high cost of funding needed to finance these three elements. Therefore, we are of the opinion that the government must create new investment opportunities outside the stock exchange whose impacts can also be directly used for financing programs. In this study, we conducted an investigation of the interest of urban people to invest in online channels. The aim is to determine the decision-making behavior of the Indonesian people in non-consumptive capital expenditure activities when the government creates and publishes financing instruments on the market. The hope is to be able to create a national development financing strategy that is in accordance with the characteristics of the Indonesian people and right on target.
1. Introduction
During 2017 – until the present day, Indonesians’ through several collaborative ministries (central government), local governments, the private sector, and the community have a high enthusiasm to improve and build a better nation. Led by the Ministry of Communication and Information, Ministry of Home Affairs, Presidential Staff Office, Ministry of Public Works and Public Housing, along with several other vital agencies. Currently, the nation is focusing on realizing a national development program in various aspects concerning the Smart Cities concept. The Smart Cities understood as a concept in which a region can manage its resources and support the living needs of its ecosystem independently. According to [1], [2], The Smart Cities concept includes six main aspects, namely Smart Governance, Smart Branding, Smart Economy, Smart Living, Smart Society, and Smart Environment. However, before being able to realize the Smart Cities program, it turns out that there are basic needs that must be met before being able to apply the concept.
Based on information obtained from the testimony of one of the compilers of the Guidance Book of Indonesia Smart City Master plan 2017, Ms. Dwi Elfrida (Person in Charge Indonesia Smart City Initiatives from Ministry of Information and Telecommunications). The implementation of the Smart City concept is analogous to a family that must already have a place to live before they can have a car for personal use. In other words, there are three main elements which are the pillars for implementing the Smart Cities concept in Indonesia, namely structure, infrastructure, and superstructure [2]. The structural elements include the development of human capital which is the agent and beneficiary of the Smart Cities concept. Within the structural elements are also discussed about budget resources and local government resources. The second element is infrastructure; infrastructure development includes three components, namely physical, digital and social infrastructure for the advantage of the community. The last element is the superstructure, in this section component such as regional policies and regulations, institutions, and procedures for implementing the Smart Cities concept must be accommodated.
The construction of three main elements are constrained by funding issues
Without having three adequate main elements, it is challenging for a region or even a country to implement the Smart Cities concept [3]. To be able to succeed in applying the concept, at least the people of a region must have a level of compliance and discipline towards proper legal regulations. Then to support innovation and economic growth, the potential must be supported by robust infrastructure and facilities. Finally, to be able to create a stable civilization on society, legal planners and implementers with integrity and reliability are needed. Unfortunately, in Indonesia, we are still struggling to resolve these crucial issues. The geographical conditions in the form of archipelagic countries and various types of local wisdom, make the development process of Indonesia have many challenges. Also, we suspect, one of the biggest challenges in the process is about infrastructure problems.
Infrastructure development is one of the essential elements that must be carried out by the state to make the nations’ wheel of life continue to keep pace with the times. Without the availability of access to highways, railroads, seaports, airports, warehouses, optical fiber, radio towers, power plants, clean water treatment plants, and various other physical and digital infrastructures. So it is impossible for a country to continue to survive and develop in an era of increasingly intense global competition [4]. Unfortunately, infrastructure development is not as easy and cheap as imaginable. In Indonesia, to build the Trans Java toll road project along the 522 Kilometers, it is estimated that it requires an investment cost of IDR 17 Trillion (US$ 1.5 Billion), and even then only for the land acquisition budget [5]. Building nine dams in East Nusa Tenggara, West Nusa Tenggara, Banten, Central Java, Batam, and South Sulawesi, the government estimates that the project may require a national budget of IDR 3.85 Trillion (US$ 300 Million) [6]. Also, for the construction of the Trans Kalimantan railroad network infrastructure for 2400 Kilometers, it is estimated that the development requires an investment cost of IDR 22 Trillion (US$ 2 Billion) [7]. Regarding the example of the Trans Kalimantan infrastructure development project, it is regrettable that the project was one of fourteen lists of National Strategic Projects that had to be canceled by President Joko Widodo in 2018 [8].
Seek for alternative national development funding
The cancellation of the implementation of fourteen National Strategic Projects by President Joko Widodo made sense, considering the required investment costs were estimated to reach IDR 264 Trillion (US$ 20 Billion) [9]. Whereas at the same time, the nation still had to share its focus on the development of structural and superstructure elements. The Indonesian government’s efforts to continue development also do not just stop. Issuance of investment instruments such as Saving Bonds Retail series 004 has been issued by the Ministry of Finance in 2018 to obtain a national financing capacity of IDR 1 Trillion (± US $ 100 Million) with coupon rates of 8.05% per annum [10]. In 2019, through the Ministry of Finance, the Indonesian government again issued Saving Bonds Retail series 005 for a national financing capacity of IDR 5 Trillion (± US$ 500 Million) with coupon rates of 8.15% per annum [11]. Government initiatives in issuing Saving Bonds indicate that for continuing national development, there are still many alternative financing sources needed. The good news from the issuance of the Retail Saving Bonds is quite exciting regarding the interest of the Indonesian middle class to contribute their capital toward national development. We assume that the community intentions formed are supported by trust building mechanisms that have been successfully campaigned by the government. Furthermore, the availability of a variety of instruments and channels for investment access both online and offline also helped facilitate community action to invest. Therefore, we suspect that now is the right moment for the government to conduct national revenue re-engineering. Specially to experiment in creating innovative instruments and investment access channels. In this study, we attempt to investigate the interest of urban people to invest in online channels. The aim is to determine the decision-making behavior of Indonesian people in non-consumptive capital expenditure activities. The results obtained from this study are expected to create social development financing opportunities that are following the characteristics of the Indonesian people.
2. Literature Review
A lot of new types of business offering profit sharing and business capital cooperation by financially based technology startups became our source of inspiration in this study. In Indonesia, the Go-Jek transportation ride-sharing startup that has adapted the Uber concept has successfully transformed into one of the financial technology startups that are quite important for the empowerment of local communities. Tokopedia and Bukalapak have fostered an entrepreneurial spirit for workers and retirees to continue developing their businesses. The Bareksa Investment Marketplace allows people to develop their capital not in conventional bank deposits, but on mutual fund exchanges. Bank Negara Indonesia also creates online securities products (with a zaisan and e-smart platform) that enable students to learn stock investments on the market with only less than US$ 10 deposits. More interestingly, in America, there is a crowdfunding-based online funding platform known as the Kickstarter. Where based on the company’s claims, currently a total of successful projects funded have reached more than 250,000 projects — supported by around 15.5 million philanthropists, with funding turnover reaching US$ 4 billion.
2.1. Indonesian version of Kickstarter
Technological startups of crowdfunding-based business such as Kickstarter also exist in Indonesia. We know KitaBisa and Mekar as two examples of crowdfunding startups that collect enough philanthropists for business development, even for social financing. For KitaBisa, they claim that the donations have been collected reached IDR 512 Billion (US$ 45 Million). Indonesia also has iGrow, a crowd-investing based marketplace platform that brings farmers (or breeders), owners of agricultural land (or livestock), and investors synchronically. From the business model, iGrow claims to have empowered as many as 2200 farmers to manage more than 1,000 hectares of land, with yields of more than 500 tons only for peanut commodities (not including others) in Indonesia. Today’s online channel-based crowdfunding and crowd-investment trends inspire us to test the intentions of the interest of the Indonesian people in making decisions to fund investment and charitable/social activities. To support the investigation, we chose retail-based e-Commerce channels as a testable activity.
2.2. E-Commerce channel
The e-Commerce channel is a dynamic, complex, and mysterious business ecosystem. There are many factors could make a potential consumer just do online windows shopping or make a real decision when they visit online equity crowdfunding platform or an e-Marketplace. The factors can be influenced by technology or can be influenced by social factors. An excellent platform appearance, content information conformity, and ease of use are some fundamental aspects of technology that could attract customers to make purchases [12]–[14]. On the other hand, the ability of a retailer to provide protection for shopping and the quality of products offered is also an important aspect for motivating customer to purchase or to invest electronically [15]. Not only there, we assume there is also another factor that causes potential customers deciding to make a purchase, that factor is the quality of service [16], [17]. In our perspectives the world of retail e-Commerce, the good and poor quality of retailer services can be judged in two ways. The first aspect is the retailer’s experience in fulfilling customer orders. The success of the retailers in completing the transaction process and meeting the needs of customer orders in online business can affect the reputation of the business entities both in the realm of online and conventional sphere. Because in previous study by [18], mentioned that the success of a retailer in delivering a satisfying shopping experience will build a sustainable online trust and it will impact on the seller electronic image. In the other study by [19] also proves that a good electronic image (e-Image) even can trigger consumer interest to pay for a product at much higher price than the suggested retail price (MSRP). The second aspect, we speculate that a retailer’s ability to provide customer support/help is one of the keys to success that leads consumers to actualize their purchases. The previous research by [20], It is proof that the product recommendation provided by the retailer can make a potential consumer change product purchase decision. They could switch the purchase intentions of pre-planned products, into buying products recommended by the seller. Therefore, we believe that the presence of retailers in the online channel is also required. Through the electronic Word of Mouth [21], [22] and instant messaging technology for real-time online support assistance [23], [24]. Then, we think that Social Presence in the realm of online transactions is also important to be held.
2.3. Vendor reputation
Vavilis, Petković, & Zannone [25] defined reputation as a measure of online trust. The mechanism of reputation ranking of online business by consumers done in several approaches. As with the eBay auction site or Indonesian e-marketplaces like Tokopedia and Bukalapak, reputation ranking systems use star-scale systems (1 [bad] – 5 [good]) as a sign of the level of business reputation. In the Kaskus community forum, the user reputation rating system uses the colored beam scale (red: bad – Green: best) as the indicator. In a previous study by Gregg & Walczak [19], proving that high reputation ranking value and also a selection of the right business username can affect the level of customer trust. Where ultimately the level of trust formed correlates with the consumer’s purchase decision [26]. Chen & Chou [27] defined the vendor’s reputation as a reflection of the seller’s ability to deliver the best service in the eyes of consumers.
The definition of vendor reputation in this research defined as vendor capability that manifests in recognition and public awards for producing the consistenly good performance. In other words, the positive digital footprint that vendors have because of good business history. Later it will be used as a measurement tool for prospective investors to establish business cooperation with them in the future (see Fig. 1). The measurement indicators of the supplier’s reputation consist of:
(i) The vendor’s existence level. The existence of suppliers in digital and physical channels must be easily recognizable and known to the general public. (ii) The recognition/commendation level. The amount of acknowledgment or award earned by a vendor from a community or third party appraisal institution. (iii) Vendor ratings. The amount of customer testimonials about the vendor on every products/services sold in internet.
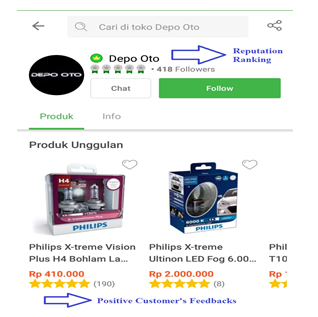 Figure 1. The example of vendor good reputation rating and positive customers’ feedback (Depo Oto in Tokopedia.com)
2.4. Social presence
Social presence is a vendor/retailer manifestation in a business transaction mechanism. Social presence is difficult to create in online channels, especially if only rely on graphics or images [28]. However, as time passes and dynamic technological updates trigger the emergence of virtual reality concepts making social presence possible in online channels. The website is one of the key aspects in e-Commerce transaction. According to [22] social representation of online business players, psychologically possible presence by consumers through a particular medium, where the website or mobile site is the intended intermediary. Furthermore, to strengthen that perspective, it is appropriate that every online business person has a website or mobile media that is independent and not bound by third party intervention. Because, through independent ownership, the business has an unlimited discretion in serving consumers and perform regulation.
Further, ownership is personal as well as creates consumer perceptions of credibility, empathy, integrity, and benevolence (good impression good behavior). Ogonowski et al. [29] defined social presence as a perception of the personality, hospitality, and elements of the human sensitivity created in a website. In this research the social presence is defined as a social approach given by the vendor to their consumer to reduce the service gap that occurs in the digital environment. In this case, the social presence measurement indicator divided into: (i) Attention level. Attention provided by the vendor in interacting and communicating with consumers online. (ii) The vendor’s ability level. The ability of seller in delivering an atmosphere of online shopping experience that resembles the state of shopping traditionally to consumers. (iii) Vendor politeness. The ability of seller to express manners and ethics to their customers (see Fig. 2).
 Figure. 2. The response from ZOTAC customer service agent that shows politeness and responsible business ethics for customer complaints in Newegg platform.
2.5. Online trust
Gefen [30] stated that consumer confidence in vendors is the basic necessity to obtain second, third, and onward purchase intentions. Alternatively, in other words, consumer loyalty is a manifesto of business success in building trustworthiness in the presence of consumers. Turilli et al. [18] also stated that trusts can not only occur in the real world (offline channels), but it can also form under online conditions. Therefore, the ability of vendors to build trust in the reality will reflect its integrity in digital channels and apply vice versa. Gefen [31] defined trusts in the context of e-Business and e-Commerce as the ability of consumers to take risks of uncertainty situations in transactions that can not be controlled by itself but still take action on certain expectations. According to [28], a definition of trust in the context of e-Business and e-Commerce is the ability of consumers to accept vulnerability owned by online vendors based on positive expectations and certain actions. Furthermore, Hwang & Lee [32] defined online trust as a consumer’s ability to ignore uncertainty avoidance by using a reference to cultural norms prevailing in certain society as a guide to reducing risk of worry. In this case, allegedly consumers have a certain belief that things that are harmful to others are not appropriate to be done by someone (the trustee) because if it happened then the parties will receive certain social sanctions.
The ability of vendors to provide transparent, detailed, and accurate information is a trigger for consumer confidence online. Because in remote condition, consumers can not test the product directly, so it has become a duty for a seller to provide the online shopping experience that is not too much different from the traditional shopping experience (Fig. 3). This study defined online trust as a risk-taking mechanism conducted by consumers to depends on the performance capabilities of a vendor in conducting business transactions based on digital channels. And we agreed to have online trust consist of four dimensions, such as integrity, benevolence, ability, and predictability. The dimension of integrity measurement in this study consist of:
(i) The level of confidence. Consumers believe their familiar vendor will always be honest and will not cheat them or other customers. (ii) Reliability level. Consumers understand their online subscribed vendor will always have a reliable performance and full sense of responsibility for all actions that will accomplish. (iii) The level of openness. Online vendors must have transparency or openness in communicating with their customers so that consumers do not have to worry about cheating. Benevolence dimension (good behavior) in this study defined as the ability of the vendor to be able to act well and considerately in every action to the consumer. The measurement indicators of benevolences consist of (iv) Confidence level. Consumers believe that online subscribers always prioritize the interests of consumers compared with personal interests. (v) Confidence level. Consumers believe that their online subscribers will always act with consideration before performing their actions.
The ability dimension in this study defined as the level of competence possessed by the vendor in providing the best service for its customers. The measurement indicators of the ability dimension consist of: (vi) The level of vendor competence. Vendors must be able to demonstrate the competencies expected in providing shopping assistance to their consumers. (vii) The rate of response speed. It means, as a time of service that vendors can provide when consumers need help in the shopping process. (viii) The vendor’s troubleshooting competence. A seller capability required in providing troubleshooting solutions in the event of a dispute with the consumer.
The dimension of predictability in this study defined as the ability of vendors to show performance patterns that can be predicted by consumers through a series of actions that follow the work procedures. The measurement of predictability indicators are as follows: (ix) The rate of response speed. The responsivity of vendors when answering questions and providing relevant advice needed by consumers. (x) Expected level. Consumers expect to always get an enjoyable online shopping experience from online vendors.
 Figure 3. Nasi Goreng “Mas Itok” food vendor that are most preferred by Go-Food (Go-Jek) customers
2.6. Customer investment (purchase) intention
In this study, customer investment (purchase) intention is defined as the motivation of consumers to make investment decision towards equity offered (like in startup business cooperation opportunities). In other words, customer investment (purchase) intention in this research meant as a behavioral-based intention owned by a consumer to visit and make the realization of online purchases (or investment) from the desired business vendor [33]. The intention and desire are the last stages of the various considerations that consumers have before making a final purchase decision. Referring to Hong & Cho [34] measurement indicators of customer investment intention consist of (i) customer will return to visit the online store/vendor. (ii) Customer will make a purchase/investment from the online store/vendor within a period of two months. (iii) While new products are released in the market, then customer will prioritize purchases/investing from certain online stores/vendors. And (iv) for further purchases (or investment), customer will continue to visit and make actual decision from certain online vendor/retailer store.
3. Method
To support the analytic process in this research. We used convenience sampling as a method of data collection. The non-probabilistic sampling approach in this research is used to overcome the problem of dynamic and infinitive samples. For information, the sample used focuses on potential consumers who had shopping experience at online retail stores incorporated into the Indonesian e-Commerce Association (IdEA). As for some examples of these vendors are: included in the category of e-Marketplace (Tokopedia, Lazada, Bukalapak, BliBli) or providing marketplace platform (Go-Jek, and Grab) and also listed in the category of online retail stores (Traveloka, JD.id, Bhinneka).
The design of this study began with a scenario that questioning respondents intention to invest in online startups initiated by their familiar vendors. When their well-known vendors like Depo Oto (Fig. 1), Zotac (Fig. 2), or Fried Rice “Mas Itok,” (Fig. 3) try to diversify their business in other fields. For example, Depo Oto, which is involved in the business of retailing automotive spare parts, will expand its business into agriculture development. Alternatively, Zotac, which is engaged in the Graphical Processing Unit, expands in the textile sector. And, if fried rice “Mas Itok” who started the business as a food seller innovating to build a semi-real estate property business. With consideration of all forms of administration and business legality guaranteed by Indonesian Government (like Otoritas Jasa Keuangan or The Ministry of Finance). Then we asked the respondents by several questions like:
“Are the respondents interested on investing their capital in these startup companies?” Considering they have had a business relationship (experienced) in the past. “Can social capital that has been formed by both parties be developed to continue business relations and kinship between the two?”.
Some of these questions will then converted and tested through the relationship of several latent variables on the structural model. For the data collection technique, we used one shot cross-sectional and close-ended questionnaire based on a Likert scale with a range of values 1-5 (low-high). For data transformation process from qualitative scale to the quantitative scale used Method of Successive Interval. The goal of scale transformation helps to get a more weighted, stable, and objective assessment results. After the data collection process finished, the next phase is the process of data cleansing. The data cleansing process focused on using Mahalanobis Distance method to control outliers. The process of outliers handling is used to avoid the results of research from the use of biased data. In the last stages of data analysis, we used the method of Structural Equation Modeling based on Partial Least Squares (SEM-PLS). The purpose of using SEM-PLS in this research is to adjust the exploratory nature of research, where it requires a high accuracy measurement result by utilizing the nature of multiple regression analysis.
Refer to Fig. 4, the proposed hypotheses in this study consist of:
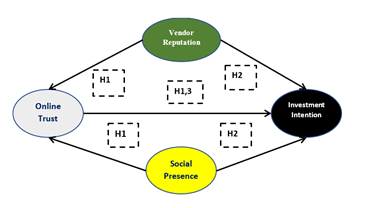 Figure 4. Relationship of structural model proposed in this research
H1: Vendor Reputation and Social Presence are positively correlated and have a significant direct effect on the establishment of Online Trust.
H2: Vendor Reputation and Social Presence are positively correlated and have a significant direct effect towards customer Investment Intention.
H3: Online Trust is positively correlated and has a significant direct effect towards customer Investment Intention.
4. Results and Suggestion
Out of the 350 distributed questionnaires results obtained as many as 323 respondents’ answers are valid. The sample respondents are undergraduate students from a university in Jakarta majoring in information systems program. The average age of respondents is in the range 17-28 years. A total of 173 respondents are female, and the rest are male respondents. Based on the sample used, it assumed that participants are potential customers who have experience in the use of computers and smartphones. Moreover, it assumed they have a good understanding of internet usage [35]. Average monthly online spending from respondents ranged from IDR 200,000 – IDR 4,000,000 (US$ 15 – US$ 350). As for the data obtained, the most popular goods purchased by respondents when shopping online is a product of fashion and electronics. Fig. 5 shows the results of the first stage inner model testing using Smart-PLS software version 3. The first step of structural model testing can be seen in Fig. 5.
According to [36], we can say that the Online Trust moderately explains the creation of 40.5% variance in customer Investment Intention. Where, Vendor Reputation and Social Presence also have moderate explanation in Online Trust with the value of 42%. According to the path coefficient value, Online Trust has the strongest correlation towards customer Investment Intention with .457 value. Followed by Vendor Reputation à Online Trust with .366 value. Then Vendor Reputation à customer Investment Intention with .353 and Social Presence à Online Trust with .326 value. The weakest correlation coefficient indicated by Social Presence towards customer Investment Intention with -0.132 value.
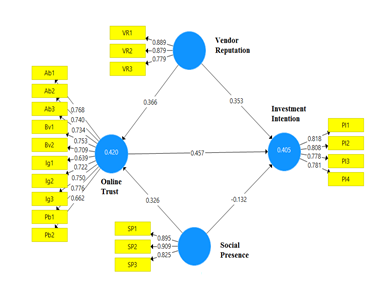 Figure 5. Inner model testing on structural model
In Table 1 it can be seen that all research variables have values of Cronbach α > 0.7 and rho_A > 0.4. In other words, we can say that all variables have met the required reliability standard in the measurement. In Table 1 it can also be seen that the value of Composite Reliability has exceeded 0.6 and the Average Variance Extracted has surpassed the value of 0.5. Thus, we consider all the measurement variables used to meet the criteria of structural reliability model.
| Table 1. The Measurement of Reflective Outer Model | ||||
| Latent Var. | Cronbach
α |
rho_A | Composite
Realibility |
Average Variance Extracted (AVE) |
| Online Trust | .90 | .902 | .918 | .528 |
| Investment Intention | .81 | .817 | .874 | .635 |
| Social Presence | .849 | .849 | .909 | .769 |
| Vendor Reputation | .807 | .818 | .887 | .723 |
In Table 2 it can be noted that based on the calculation of Fornell-Larcker Criterion method all variables have met the required validity conditions. It indicated by the value of the intended variable (marked with the * sign) has exceeded the correlation value of other variables that reside in each column. For example, in the first column, the Online Trust variable has a diagonal value of .726.
That value exceeds the value of the correlation of other variables: Investment Intention (.593), Social Presence (.603), and Vendor Reputation (.612). In the second column also shows that the Investment Intention diagonal value has (.797) exceeded the Social Presence variable value (.410) and Vendor Reputation (.533). Thus, it can be said that based on the measurement of discriminant validity, then all research variables used have met the requirements of structural validity.
| Table 2. Discriminant Validity Measurement | ||||
| Latent Var. | Online
Trust |
Investment
Intention |
Social
Presence |
Vendor
Reputation |
| Online Trust | .726* | – | – | – |
| Investment Intention | .593 | .797* | – | – |
| Social Presence | .603 | .410 | .877* | – |
| Vendor Reputation | .612 | .533 | .756 | .85* |
4.1. Analysis after bootstrapping procedure
To perform hypothesis testing in SEM-PLS required bootstrapping procedure. The goal is to get more accurate measurements by combining core samples with sub-samples data. In this measurement, we use 5000 data as a sub-sample with two-tailed test mode, no-sign changes, complete bootstrapping, 2GB of memory usage, and 323 data as core samples.
Fig. 6 shows the results of inner model testing after going through the bootstrapping process. Table 3 shows the structural inner model test results after going through the bootstrapping procedure.
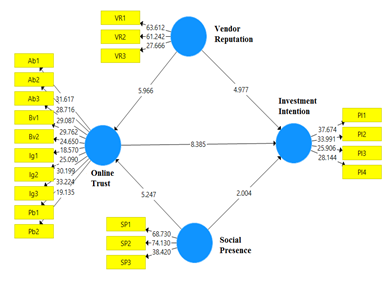 Figure 6. Inner model structure after bootstrapping
| Table 3. Path Coeff. Values After Bootstrapping | ||||||
| Latent Var. | Original Sample | Sample Mean | StD | T-Stat | p-Values | |
| Online Trust à Invest. Intention | .457 | .459 | .054 | 8.385 | .000 | |
| Social Presence à Online Trust | .326 | .327 | .062 | 5.247 | .000 | |
| Social Presence à Invest. Intention | -.132 | -.132 | .066 | 2.004 | .045 | |
| Vendor Reputation à Online Trust | .366 | .367 | .061 | 5.966 | .000 | |
| Vendor Reputation à Invest. Intention | .353 | .353 | .071 | 4.977 | .000 | |
The result of path coefficient measurement shown in Table 3 shows that in general, the correlation among the hypothesized variables has a good relationship. It is proofed by the correlation between Online Trust à Investment Intention through the value of T-Stat 8.385 > 1.96 (p-Val < .05). Furthermore, the value of Social Presence correlation à Online Trust has value T-Stat 5.247 > 1.96 (p-Val < .05). The correlation value of Social Presence à Investment Intention has T-Stat 2.004 > 1.96 (p-Val < .05). Correlation value of Vendor Reputation à Online Trust 5.966 > 1.96 (p-Val < .05). Moreover, the correlation between Vendor Reputation à Investment Intention has a T-Stat value of 4,997 > 1.96 (p-Val < .05). Where according to Wong [37] with a significance level of 5% then a good correlation should meet the requirements of T-Stat > 1.96 and p-Val < .05.
4.2. Hypotheses testing
In Table 4 we described the final result of structural model analysis. We use total effects as a measure of hypotheses testing.
Based on the result of total effects testing shown in Table 4. It can be concluded that:
H1: Vendor Reputation and Social Presence are positively correlated and have a significant direct effect on the establishment of Online Trust. (H1 accepted, p-Val < .05 & p-Val < .01).
| Table 4. The Total Effects | |||||
| Latent Var. | Original Sample | Sample Mean | StD | T-Stat | p-Values |
| Online Trust à Invest. Intention | .457 | .459 | .054 | 8.385 | .000** |
| Social Presence à Online Trust | .326 | .327 | .062 | 5.247 | .000** |
| Social Presence à Invest. Intention | .017 | .018 | .069 | .251 | .801 |
| Vendor Reputation à Online Trust | .366 | .367 | .061 | 5.966 | .000** |
| Vendor Reputation à Invest. Intention | .52 | .522 | .070 | 7.428 | .000** |
H2: Vendor Reputation and Social Presence are positively correlated and have a significant direct effect towards customer Investment Intention. (H2 rejected, Social Presence à Investment Intention has p-Val > .05).
H3: Online Trust is positively correlated and has a significant direct effect towards customer Investment Intention. (H3 accepted, p-Val < .05 & p-Val < .01).
From our measurement results, we found that Vendor Reputation and Social Presence variables have a strong correlation with the Online Trust it shown with the T-Stat > 1.96 and p-Values < .05 for both variables. Vendor Reputation and Social Presence together also have a significant influence on the establishment of Online Trust, it is shown with the value of p-Values < .05. Furthermore, the Online Trust Variables also have a strong correlation with customer Investment Intention variables; it has shown with the value of T-Stat > 1.96 and p-Values < .05. Similarly, the results of total effects measurement, Online Trust variable has a significant influence on the formation of customer Investment Intention with p-Values < .05.
What is interesting in this study is that we found the fact that although the Social Presence has a good correlation with customer Investment Intention (T-Stat [2,004] > 1.96 & p-Val [.045] < .05). However, the Social Presence variable does not have a significant effect on the formation of customer Investment Intention. It is shown with p-Val of total effects that exceed the 5% significance value (.801 > .05). We believe, the influence of Social Presence is not significant to the formation of customer Investment Intention caused by the sample respondents used is the people with a bachelor degree.
In other words, respondents with a decent level of education correlate with their level of understanding about the product and the use of a good e-Commerce retail platform as well. Therefore, allegedly that when they come to investing their capital towards products/services/equities online, respondents from academic societies prioritize vendor reputation compared to the sense of representation of the retailer. So we conclude that as long as the retailer can present a qualified product/service (worth to funded) and followed by a good reputation, then the consumer (especially from academic circles) will still make an investment, regardless of social presence of the retailer.
4.3. Opportunity for Indonesian government
The results of our investigation show that for university students, with a regular budget of IDR 200,000 – IDR 4,000,000 (US$ 15 – US $ 350) per month. The interest in funding vendors with excellent products and reputations has positive results. In other words, this is an opportunity for the government to take advantage of current possibilities regarding National Strategic Projects funding, especially infrastructure. We see opportunities for “government logos” as shown in Fig. 7 will be an added value for the government when conducting investment campaigns for alternative funding. According to [38] Logos known as trust marks can be useful as accelerators for the creation of trust building mechanism on digital channels. Because with the existence of trust marks, we can say that the product/service/equity issued in the market has passed specific complex procedures and can also be used as an illustration of the reputation vendor.
 Figure 7. Trust-Marks from the government
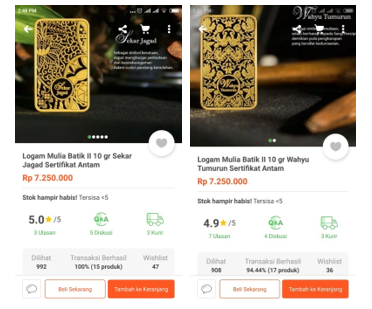 Fig. 8. Products from very good reputable vendor combined with arts are more expensive than regular products. Source: Toko Agung Cikini (Tokopedia’s gold/jewelry retailer)
Government campaigns regarding investment programs for the community can be put into various manifesto. A simple instance is the issuance of precious metal instruments and jewelry that have high intrinsic value. As an illustration, our observation of some precious metal retailers on the Tokopedia platform shows findings where gold bar products with the themes of “Sekar Jagad” and “Wahyu Tumurun” batik (Fig. 8) sold at a margin of 10% more than the market price of similar products, and there are still buyers. (see Table 5 for product price comparison). It can be imagined if the central and regional governments in Indonesia collaborate with Antam (or other credible companies) to issue limited edition precious metals for infrastructure funding purposes. Of course, from the retail sales margin, the government has the opportunity to fund several projects without disrupting regional/central spending.
| Table 5. Gold Bar prices in Indonesia market (price per 31st January 2019) | |||
| Certification Issuer | Denomination | Retail Price | Retailer |
| Antam (IDX ANTM) | 1 Gram | IDR 693,000 | PT. Pegadaian |
| Antam (IDX ANTM) | 2 Gram | IDR 1,353,000 | PT. Pegadaian |
| Antam (IDX ANTM) | 5 Gram | IDR 3,280,000 | PT. Pegadaian |
| Antam (IDX ANTM) | 10 Gram | IDR 6,478,000 | PT. Pegadaian |
| Antam (IDX ANTM) | 25 Gram | IDR 16,093,000 | PT. Pegadaian |
| Untung Bersama Sejahtera (UBS) | 0.5 Gram | IDR 366,000 | PT. Pegadaian |
| Untung Bersama Sejahtera (UBS) | 1 Gram | IDR 659,000 | PT. Pegadaian |
| Untung Bersama Sejahtera (UBS) | 2 Gram | IDR 1,302,000 | PT. Pegadaian |
| Untung Bersama Sejahtera (UBS) | 5 Gram | IDR 3,188,000 | PT. Pegadaian |
| Untung Bersama Sejahtera (UBS) | 10 Gram | IDR 6,345,000 | PT. Pegadaian |
| Untung Bersama Sejahtera (UBS) | 25 Gram | IDR 15,816,000 | PT. Pegadaian |
| Antam (IDX ANTM) | 1 Gram | IDR 699,000 | Indo Gold |
| Antam (IDX ANTM) | 25 Gram | IDR 16,039,000 | Indo Gold |
| Antam (IDX ANTM) | 50 Gram | IDR 32,200,851 | Indo Gold |
| Antam (IDX ANTM) | 100 Gram | IDR 64,323,100 | Indo Gold |
| Antam (IDX ANTM) (Sekar Jagad edition) | 10 Gram | IDR 7,250,000 | Toko Agung Cikini |
| Antam (IDX ANTM) (Wahyu Tumurun edition) | 10 Gram | IDR 7,250,000 | Toko Agung Cikini |
| Antam (IDX ANTM) (Sekar Jagad edition) | 20 Gram | IDR 13,600,000 | Toko Agung Cikini |
| King Halim (Shuang Xi edition) | 5 Gram | IDR 3,170,000 | Toko Agung Cikini |
| King Halim (Dragon edition) | 5 Gram | IDR 3,170,000 | Toko Agung Cikini |
| King Halim (Balinese Dancer edition) | 5 Gram | IDR 3,150,000 | Toko Agung Cikini |
| King Halim (Masjidil Haram edition) | 10 Gram | IDR 6,190,000 | Toko Agung Cikini |
From Table 5, it can be noted that the price of gold bullion in the Indonesian market is influenced by the issuer institution which certifying metal authenticity. This fact strengthens the results of our investigation that reputation vendors have a higher bargaining power towards the market. Besides, the availability of goods supply factor is another determinant ascertaining the high selling prices of commodities in the market. In this context, Antam’s precious metals with the theme “Sekar Jagad” and “Wahyu Tumurun” were made as a limited edition work of art. Limited production quotas will result in a scarcity of products on the market, which also increases consumer interest in having them [39].
The U.S Geological Survey report supports this fact [40], Where in 2016 and 2017 for gold commodities, Indonesia managed to produce as many as 80 tons regularly, this was only evaluated by one commodity, according to a report from the Indonesian Ministry of Trade [41], in 2014 Indonesia managed to export 8mm size Sea-shells on the global market with a value of US$ 28 million. Thus there are still many other opportunities that Indonesia can do for the needs of national development funding.
4.4. Investment engineering
For national development, all efforts must be made. Investment engineering is a way that must be taken to deal with the limitations of physical assets provided by nature or to deal with secondary financing which does not need to be shouldered by the government itself. It is time for the government to expand the concept of economic sharing with the community. Whether it is investment sharing or benefit sharing. The Government of Indonesia, through one of the State-Owned Enterprises, PT Waskita Karya has attempted to carry out economic sharing with the business sector by selling several toll road segments for the capital of other toll road project funding [42]. It is perfect and needs to be appreciated. However, the targeted market is still specific; in other words, only giant capital companies can invest in toll road projects; the administrative process will also be complicated. Therefore, involving all levels of society by eliminating administrative problems such as “minimum investment of US$ 100” or “return on investment can be obtained two years later” will undoubtedly be a powerful way to boost up the source of capital. Indonesian people need to learn from the video game industry to follow the way they do financial engineering as is done by steam-powered platforms from Valve video games company in the United States. They realize that the business model in the game industry that produces games and then sells them off the market will undoubtedly be very dull and make the market become saturated quickly. The way that Valve does to overcome this problem is by creating a community market.
The concept of a community market is to allow end-users to trade game items they obtain from gamification results (such as reward points when winning matches or leveling up) in steam-powered marketplace platforms. The concept of the community market applied by Valve, in our opinion has been successful in making playing video games not dull anymore. A win for all concept, both for platform owners, developers, and end-users. Furthermore, a member in the Reddit community forum once predicted the question related to “how much money is produced by Valve only from every game item traded in the community market?“. Although the question looks like jokes, the money obtained by Valve is estimated to be very serious. Throughout 2012-2013. with a 15% discount on every successful sale of game items, it is estimated that from ± 58 million transactions and trading volume of ± US$ 39 Million, Valve managed to obtain ± US$ 6 Million [43].
5. Conclusion
The results of our investigation showed that there is good interest from the public regarding the decision to invest online, especially those vendors who have known their reputation. This situation is also strengthened by the fact that the products sold by reputable vendors have the opportunity to carry out a pricing premium strategy (selling at higher prices because vendors have a bonafide business image). The investment (financial) engineering method has also been very diverse, even in the video games industry. So we conclude that now is the exact moment for the Indonesian government to make creative breakthroughs to create national project funding opportunities. Because the available market for breakthroughs is not only from the local community but globally. If the government is willing to do that, then we believe that the Smart Cities concept will be successfully implemented in Indonesia and will bring prosperity to all people.
Conflict of Interest
The authors declare no conflict of interest.
- R. Giffinger, “Smart cities Ranking of European medium-sized cities,” October, vol. 16, no. October, pp. 13–18, 2007.
- I. D. G. of I. Application, Buku Panduan Penyusunan Masterplan Smart City 2017. Gerakan Menuju 100 Smart City. Jakarta, Indonesia, 2017.
- R. Mahesa, G. Yudoko, and Y. Anggoro, “Platform Ecosystems for Indonesia Smart Cities,” in 2018 International Conference on Computer, Control, Informatics and its Applications: Recent Challenges in Machine Learning for Computing Applications, IC3INA 2018 – Proceeding, 2019, pp. 34–39.
- R. Mahesa, G. Yudoko, and Y. Anggoro, “Dataset on the sustainable smart city development in Indonesia,” Data Br., vol. 25, pp. 1–16, 2019.
- A. Ramadhiani, “Pemerintah Habiskan Rp 17,27 Triliun demi Lahan Tol Trans Jawa,” Properti Kompas.com, Jul-2017.
- E. Simorangkir, “9 Proyek Bendungan Jokowi Rp 3,85 T akan Rampung Tahun Ini,” detikFinance, Jan-2018.
- M. Idris, “Berapa Biaya Bangun 2.428 Km Rel Baru di Kalimantan?,” Detik Finance, May-2017.
- H. Kusuma, “Ini Daftar Lengkap 14 Proyek yang Dicoret Jokowi dari PSN,” Apr-2018.
- T. Hamdani, “Saat Jokowi Coret 14 Proyek Strategis Nasional Senilai Rp 264 T,” Dec-2018.
- M. Wareza, “SBR 004 Beri Bunga 8,05%, Kemenkeu Cuma Incar Dana Rp 1 T,” CNBC Indonesia Investment, Aug-2018.
- H. K. Dewi, “Kuota Nasional SBR005 Tinggal Rp1,47 Triliun Lagi, Ayo Segera Pesan,” Bareksa News Funds, 2019. .
- D. Cyr, “Website design, trust and culture: An eight country investigation,” Electron. Commer. Res. Appl., vol. 12, no. 6, pp. 373–385, 2013.
- R. N. P. Atmojo, A. D. Cahyani, B. S. Abbas, B. Pardamean, Anindito, and I. D. Manulang, “Design of single user decision support system model based on fuzzy simple additive weighting algorithm to reduce consumer confusion problems in smartphone purchases,” Appl. Math. Sci., vol. 8, no. 13–16, pp. 717–732, 2014.
- Y. Lie, R. N. P. Atmojo, H. H. Muljo, S. Purnamasari, and B. Pardamean, “A comparison of customer preference towards two different types of e-Tailing channel,” in Proceedings of 2017 International Conference on Information Management and Technology, ICIMTech 2017, 2018, vol. 2018-Janua, pp. 171–176.
- R. N. P. Atmojo et al., “Rekening Bersama (RekBer) The Indonesian Escrow Service of Money,” Int. J. Multimed. Ubiquitous Eng., vol. 11, no. 3, pp. 399–410, 2016.
- A. O. Ajayi, G. A. Aderounmu, H. A. Soriyan, and A. David, “An intelligent Quality of Service brokering model for e-commerce,” Expert Syst. Appl., vol. 37, no. 1, pp. 816–823, 2010.
- V. U. Tjhin, R. Tavakoli, and R. N. P. Atmojo, “The Determinants Affecting E-Loyalty: Hospitality Industry in Indonesia,” in 2016 2nd International Conference on Science in Information Technology (ICSITech), 2016, pp. 131–136.
- M. Turilli, A. Vaccaro, and M. Taddeo, “The Case of Online Trust,” Knowledge, Technology & Policy, pp. 1–13, 2010.
- D. G. Gregg and S. Walczak, “Dressing Your Online Auction Business For Success: An Experiment Comparing Two Ebay Businesses,” MIS Q., vol. 32, no. 3, pp. 653–670, 2008.
- R. N. P. Atmojo, Anindito, B. Pardamean, B. S. Abbas, A. D. Cahyani, and I. D. Manulang, “Fuzzy simple additive weighting based, decision support system application for alternative confusion reduction strategy in smartphone purchases,” Am. J. Appl. Sci., vol. 11, no. 4, pp. 666–680, 2014.
- C. W. Yoo, G. L. Sanders, and J. Moon, “Exploring the effect of e- WOM participation on e-Loyalty in e-commerce,” Decis. Support Syst., vol. 55, no. 3, pp. 669–678, 2013.
- E. Toufaily, N. Souiden, and R. Ladhari, “Consumer trust toward retail websites: Comparison between pure click and click-and-brick retailers,” J. Retail. Consum. Serv., vol. 20, no. 6, pp. 538–548, 2013.
- R. N. P. Atmojo et al., “Research Plan Development Concerning E-Image Impact Towards Online Purchase Intention And Premium Pricing Strategies In Indonesia Community Based Online Market,” in 2015 International Conference on Science in Information Technology (ICSITech), 2015, pp. 1–6.
- R. N. P. Atmojo and A. D. Cahyani, “Recommendations for Development of Online Bookstore in Indonesia: a Review From Writer’s Perspective,” J. Comput. Sci., vol. 10, no. 8, pp. 1522–1530, 2014.
- S. Vavilis, M. Petkovi?, and N. Zannone, “A reference model for reputation systems,” Decis. Support Syst., vol. 61, no. 1, pp. 147–154, 2014.
- L. Liu, X. Zhao, H. Wang, W. Song, and C. Du, “Research on Identification Method of Anonymous Fake Reviews in E-commerce,” TELKOMNIKA, vol. 14, no. 4, pp. 1510–1520, 2016.
- Y.-T. Chen and T.-Y. Chou, “Exploring the continuance intentions of consumers for B2C online shopping Perspectives of fairness and trust,” Online Inf. Rev., vol. 36, no. 1, pp. 104–125, 2014.
- D. Gefen and D. W. Straub, “Consumer trust in B2C e-Commerce and the importance of social presence: Experiments in e-Products and e-Services,” Omega, vol. 32, no. 6, pp. 407–424, 2004.
- A. Ogonowski, A. Montandon, E. Botha, and M. Reyneke, “Should new online stores invest in social presence elements? The effect of social presence on initial trust formation,” J. Retail. Consum. Serv., vol. 21, no. 4, pp. 482–491, 2014.
- D. Gefen, “Customer Loyalty in E-Commerce,” J. Assoc. Inf. Syst., vol. 3, no. 1, pp. 27–51, 2002.
- D. Gefen, “E-commerce: the role of familiarity and trust,” Omega, vol. 28, no. 6, pp. 725–737, 2000.
- Y. Hwang and K. C. Lee, “Investigating the moderating role of uncertainty avoidance cultural values on multidimensional online trust,” Inf. Manag., vol. 49, no. 3–4, pp. 171–176, 2012.
- H. Xu, R. Zhang, C. Lin, and W. Gan, “Construction of E-commerce Recommendation System Based on Semantic Annotation of Ontology and User Preference,” TELKOMNIKA Indones. J. Electr. Eng., vol. 12, no. 3, pp. 2028–2035, 2014.
- I. B. Hong and H. Cho, “The impact of consumer trust on attitudinal loyalty and purchase intentions in B2C e-marketplaces: Intermediary trust vs. seller trust,” Int. J. Inf. Manage., vol. 31, no. 5, pp. 469–479, 2011.
- E. Symeonaki, M. Papoutsidakis, D. Tseles, and M. Sigala, “Post-implementation evaluation of a University Management Information System (UMIS),” in Proceedings – 2016 3rd International Conference on Mathematics and Computers in Sciences and in Industry, MCSI 2016, 2017, pp. 14–19.
- W. W. Chin, “The Partial Least Square Approach to Structural Equation Modeling,” in Modern Methods for Business Research, 1998, pp. 295–336.
- K. K. Wong, “Partial Least Squares Structural Equation Modeling ( PLS-SEM ) Techniques Using SmartPLS,” 2013.
- W. Wandoko, B. S. Abbas, D. Budiastuti, and R. Kosala, “Online trust building through third party trust transfer and third party protection,” J. Phys. Conf. Ser., vol. 801, pp. 1–8, 2017.
- S. Worchel, J. Lee, and A. Adewole, “Effects of supply and demand on ratings of object value,” J. Pers. Soc. Psychol., vol. 32, no. 5, pp. 906–914, 1975.
- U. S. G. Survey, “Mineral Commodity Summaries 2018,” 2018.
- T. M. of T. R. of Indonesia, “Indonesian South Sea Pearls,” 2016.
- A. Basith, “Waskita Karya jual 18 ruas tol untuk menutupi utangnya,” Kontan Industri, 2018.
- Reddit, “Valve’s Cash Cow – The Steam Community Market.” 2013.
No related articles were found.