
Classification Model of Contact Center Customers Emails Using Machine Learning
Volume 5, Issue 1, Page No 174-182, 2020
Author’s Name: Michael Wenceslaus Putong1,a), Suharjito2
View Affiliations
1Computer Science Department, Binus Graduate Program – Master of Computer Science, Bina Nusantara University, Jakarta, Indonesia 11480,
2Computer Science Department, Binus Online Learning, Bina Nusantara University, Jakarta, Indonesia 11480
a)Author to whom correspondence should be addressed. E-mail: michael.putong@binus.ac.id
Adv. Sci. Technol. Eng. Syst. J. 5(1), 174-182 (2020); ![]() DOI: 10.25046/aj050123
DOI: 10.25046/aj050123
Keywords: Email Classification, Machine Learning, Text Mining

Export Citations
E-mail is one of the media services used at the contact center. The challenge faced by e-mail services is how to handle e-mails that enter large quantities every day efficiently to provide fast and appropriate service to customers. The purpose of this study is to find which method has the best accuracy in classifying emails with four classes. The machine learning models compared in this study are Naive Bayes, SVM, and KNN. The data used in this study are primary data got from one of the contact centers. The NLP technique – Stop word removal, Stemming, and feature extraction using TF-IDF and Word2vec also applied to each algorithm to improve accuracy. The results of this study indicate that the SVM model with the Word2vec data feature produces the highest level of accuracy and the lowest level of accuracy produced by the Naive Bayes model using the TF-IDF data feature. The conclusion is that the classification using the word2vec data feature has a better level of accuracy than the classification using the TF-IDF data feature.
Received: 31 October 2019, Accepted: 04 January 2019, Published Online: 22 January 2020
1. Introduction
Email is one of the tools used to communicate today. Email usage has substantially increased globally. In 2015, the number of emails sent and received, reach over 205 billion per day, and expected to grow around 3% every year, and reach over 246 billion at the end of 2019 [1]. Due to the strong increase of internet penetration, many customers use email to substitute for traditional communication methods such as letters or phone calls. As a result, the company receives every day numerous emails. Previous studies only classify e-mail with two categories, namely spam, and not spam, while in the contact centre the categories used to verify e-mail are four, namely, complaint, inquiry, transaction, and maintenance. With the huge volume of emails received by the contact centre every day, it will be very difficult to process these emails quickly. Hopefully, this research can find the classification model with the best accuracy that applies to be used to assist in processing e-mail at contact centre, especially in terms of categorization. At present, companies are outsourcing their internal email management to a dedicated call-centre environment. Handling e-mail efficiently is one of the main challenges in business [2]. This paper describes the methodologies method that can classify emails into four different categories based on the category that has applied in the contact centre that is, complaint, inquiry, maintenance, and transaction. The dataset used in this research is data primer collected from one of the contact centre. The dataset through the pre-processing stage before the accuracy, precision, and recall of each algorithm evaluated. Data cleaning, case folding, tokenizing, stemming and stop words elimination are pre-processing techniques that have widely used and combined with various algorithms to help improve and analyse which combinations give the best results [3]. The feature from documents extracted using TF-IDF. TF-IDF is a product of two statistics, namely Term Frequency and Inverse Document Frequency. To differentiate more, the number of terms that appear in each document calculated, and all added together [4].
2. Related Works
This paper focuses on comparing the algorithms to find the best result in classifying the emails based on the category used by the contact centre to classify customer emails. There are much research has been conducted for email classifying.
Harisinghaney proposed a research to detect spam emails based on text and images using three algorithms that is Naïve Bayes, KNN and Reverse DBSCAN. They adapt spam filters for each user’s preferences and predict whether or not e-mails include spam using text mining and text recognizing with OCR library TESSERACT. in the study; they could achieve accuracy almost 50% better using pre-processed data compared to the accuracy achieved without using pre-processed data in all three algorithms. KNN with pre-processing data gets 83% accuracy in text and image-based spam filtering compared with 45% without pre-processing data. Similarly, Using Reverse DBSCAN, we achieved 74% accurate results using pre-processed data compared to 48% accuracy without pre-processed data. And finally, the best accuracy achieved by the Naive Bayes algorithm which is an 87% accurate result which is only 47% without pre-processing data [5].
Anitha used a Modified Naïve Bayes (MNB) algorithm to classify emails including spam or not spam. the results indicate that MNB is a spam email classifier that can classify with an average accuracy of 99.5%. Also, this requires a smaller amount of data for training and to provide standard performance with very low training time, 3.5 seconds. So far from this study, it was concluded that MNB is a fast and reliable classifier because it is related to the probability of words independent in the contents of an email. MNB provides the ethics of a new approach to email classification by combining probabilities independent of sequential words [6].
Gomes has studied a comparative approach to classify e-mails whether they are in the category of spam or non-spam e-mail using the Naïve Bayes Classifier and Hidden Markov Model (HMM). Categorization is done by only considering the text content of the body of the email. the results showed that HMM for classification provides better accuracy [1].
The anti-spam email system was implemented by Esmaeili in their research, they implemented an anti-spam system using the Naïve Bayes vs. method. PCA as a classifier, to classify spam and non-spam emails and use the feature selection method to increase the strength and speed of the classifier. The results of the study show that the Bayesian method with less miss classification had better precision compared to PCA, but PCA is a very fast method compared to the Bayesian. So, by increasing the number of training emails, and also using a good classifier such as SVM or ANN instead of the 1-NN method can increase the power of the PCA method [7].
In this study the authors will compare the results of the accuracy of the classification of three methods, namely Naïve Bayes Classification, K-NN and SVM. If in previous studies only classify emails in two classes, namely spam or non-spam, in this study email will be classified in 4 classes, namely complaints, inquiries, maintenance and transactions according to the category used by the banking contact center to classify customer emails.
If in the previous studies using data sources that mostly come from Enron Corpus, but in this study the data used are primary data from the database of one of the banking contact centers. Furthermore, if in previous studies only classify emails into two classes, namely spam and non-spam emails, but in this study, emails are classified into four classes according to the contents of the email namely maintenance, complaint, transaction and inquiry. In this study also uses and compares two different data feature extraction methods namely tf-idf and word2vec, where in previous studies most of them only used one method to extract data features.
3. Research Method
This research is motivated by the development of the company’s service business to customers through contact centers which currently not only serve through telephone media but also through other media, one of which is via email and how contact centers are able to provide fast services to process customer emails where at This is to categorize the customer’s email is still done manually by the contact center agent. The stages of the research carried out can be seen in Figure 1.
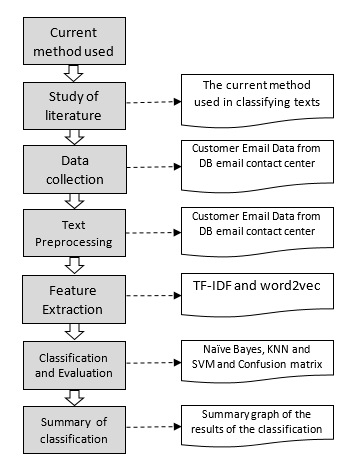 Figure 1: Research Stages
The data used in this study are primary data originating from the contact center email banking database, namely customer emails sent to the call center in the period 2016 to June 2018. The data is obtained by taking directly from the contact center email database.
3.1. Preprocessing
The data that has been obtained will go through the text preprocessing stage with the following methods [8] :
- Tokenization is the procedure of separating the text into words, phrases, or other important parts called tokens. In other words, tokenization is a form of text segmentation. Specifically, segmentation carries or considers only alphabetical or alphanumeric characters that separated from non-alphanumeric characters (for example, punctuation and spaces).
- Stop-words are words that commonly found in the text without dependence on certain topics (for example, conjunctions, prepositions, articles, etc.). Therefore, stop words usually assumed to be irrelevant in the study of text classification and omitted before classification. Specific stop-words for languages that are being studied, such as stemming.
- Convert into lowercase. At this step, it will convert all letters in the uppercase form into lowercase forms before classified.
- Stemming is to get the root word or the form of words that derived. Because words that semantically derived are similar to the root form, word events are usually calculated after applying stemming to the given text. Stemming algorithms are indeed specific to the language being studied.
3.2. Feature Extraction
Text classification is one of the main applications of machine learning. His job is to place new documents without labels into the specified categories. The text classification process involves two main problems, the first problem is the process of extracting feature terms that are effective in the training phase and the second is the actual classification of documents using feature terms in the test phase. Before classifying text, pre-processing has been done. In pre-processing Stop words are omitted and Stemmed is done.
Term frequency is calculated for each term in the document, and TF-IDF is also calculated [4].
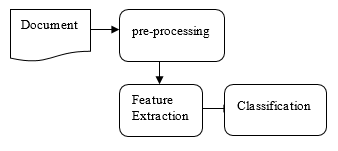 Figure 2: Document Classification Process with feature extraction
Term Frequency-Inverse Document Frequency (TF-IDF) is a numerical statistic that reveals how important a word is to a document. TF-IDF is often used as a weighting factor in information retrieval and text mining. The TF-IDF value increases proportionally to the number of times a word appears in a document but is contrary to the frequency of words in the corpus. This can help control the fact that some words are more common than others. TF-IDF can be successfully used to filter Stop-words in various subject areas including text summaries and classifications.
Term Frequency (TF) is defined as the number of times a term appears in a document.![]()
Inverse Document Frequency (IDF) is the statistical weight used to measure the importance of a term in a text document. The IDF feature is included where it reduces the weight of terms that often appear in the document and increases the weight of terms that rarely appear.![]()
Terms Frequency-Inverse Document Frequency (TF-IDF) is calculated using the following formula: ![]()
![]()
In word2vec, there are two main learning algorithms, continuous bag-of-words, and continuous skip-gram. With continuous bag-of-words, the sequence of words in history does not affect projections. This predicts the current word based on the context. Skip-gram predicts the surrounding words given by the current word. Unlike the standard bag-of-words model, continuous bag-of-words use distributed representation from the context. It is also important to state that the matrix of weights between the input and the projection layer is shared for all word positions. The skip-gram model by default has a training complexity architecture as follows: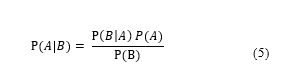
From the formula can be explained, C is the maximum distance for words, D is a representation of the word, and V is dimensionality. This means that for each training word, we will randomly select a number of R in the range <I; C> and use the word R from history and the word R from the future of the word chosen as the correct label. This requires us to do two classifications of the word R with the word chosen as input and each word R + R as the output. Using a binary tree representation of VOCAB the number of output units that require evaluation can go down to around log2 (V) [9].
3.3. Text Classification Techniques
In general, the text classification technique can be divided into two, The Statistical and Machine Learning approaches. Pure Statistical Techniques meet the hypotheses that are manually proclaimed, therefore, the need for algorithms is only minimal. Whereas Machine Learning techniques are specifically made for automation [10].
Naïve Bayes (NB), is a Bayes theorem oriented learning model that is very useful for learning tasks involving high dimensions of data, such as text classification & web mining. In general Bayesian models, classification is obtained by using dependencies (or conditional dependencies) between random variables. This process is usually time-consuming because examining the relationship between all random variables is a combinatorial optimization task. Alternatively, Naïve Bayes loosens the structure dependence between attributes by simply assuming that the attributes are conditionally independent, given a class label. As a result, examining the relationship between attributes no longer needed and derivatives of the NB model can be linearly scaled to training data [11].
K-Nearest Neighbours (KNN) is an example-based classification algorithm where documents that are not seen are classified with the majority category k the most similar training documents. The similarity between two documents can be measured by Euclidean distance from n feature vectors representing documents [12]. 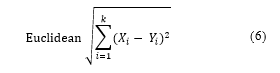
Support vector machine (SVM) is a class of machine learning algorithms that can do pattern recognition and regression based on statistical learning theory and the principle of structural risk minimization. Vladimir Vapnik created the SVM to look for a hyperplane that separates a set of positive examples from a set of negative examples with maximum margins. Margin defined by the distance from the hyperplane to the closest positive and negative examples [13].
3.4. Classification and Evaluation
The data ratio is used 80% for training data and 20% for testing data. In this stage the text classification will be carried out using the Naïve Bayes method, k-NN and SVM and comparing the accuracy values from the classification results of each method to determine which method has the best accuracy. Classification is divided into 4 classes according to categories namely, Complaint, Maintenance, Inquiry and Transaction.
The results of the text classification process will be evaluated to determine the accuracy of each classification method used. The classification results are displayed in the accuracy and confusion matrix table.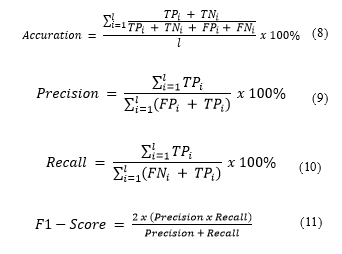
The formula for calculating accuracy, precision, recall and F1-score in a multi-class classification is as follows:
Where, is True Positive, is True Negative, is False Positive, is False Negative and is the number of class classified.
A summary of the classification results will display a graph showing the comparison of accuracy, recall, precision and f1-score of the classification results for each model used in this study.
4. Result and Analysis
This research uses primary data originating from a banking contact centre that contains 55281 emails with different amounts of data for each label according to the amount of data got within the 2016 to 2018 period. The email data used has been manually labelled by contact centre agents based on the categories that have been determined by regulations that apply to the contact centre. Email is divided into 4 classes, namely, Maintenance, Inquiry, Complaint, and Transaction. Emails are labelled based on the intent and purpose contained in the body contents of the email. The following is an example of the email data used in this research.
Data split into training and testing data with ratio 80% for training and 20% for testing.
4.1. Pre-Processing
The following are the steps taken in pre-processing email data :
- Lowercase Conversion
At this step, all letters in the email transformed into lowercase letters.
- Stemming
In this step, each sentence in the body of the email is separated into words, according to the words that make up the sentence. The stemming process is done using the literary library in python.
- Tokenization
At this step, each sentence in the body contents of the e-mail is separated into words, according to the words that form the sentence.
- Remove Stop words
At this step, we eliminate all words that are not important or do not affect the data class.
4.2. Feature Extraction
The feature extraction process using the TF-IDF method produces 665 word features. Examples of feature extraction results using the TF-IDF method can be seen in Table 1.
Table 1: Sample of Feature Extraction Data Result Using TF-IDF
| No | Word |
Total Occurrences |
Document Occurrences |
| 1 | adu | 12,67 | 9,29 |
| 2 | agenda | 0,17 | 0,04 |
| 3 | akibat | 4,04 | 3,63 |
| 4 | akses | 2,33 | 1,96 |
| 5 | akta | 1,75 | 1,54 |
| 6 | akte | 0,29 | 0,25 |
| 7 | aktif | 29,17 | 19,29 |
| 8 | aktifkan | 0,04 | 0,04 |
| 9 | aktivasi | 5,46 | 3,67 |
| 10 | akumulasi | 0,38 | 0,38 |
The feature extraction process using the word2vec method is done with the parameters min_vocab_frequency = 10, and layer_size = 50. The min_vocab_frequency parameter is the minimum frequency of the number of words present in a document and layer_size is the number of vectors generated. The model will ignore words that do not meet the minimum number. The feature used is the average value of each word vector element
The result of feature extraction using word2cev produces 100 word features. An example of the feature extraction using the word2vec method can be seen in Table 2.
Table 2: Sample of Feature Extraction Data Result Using Word2vec
| No | words | vector |
| 1 | kartu | -0,00029 |
| 2 | kredit | -0,00408 |
| 3 | mohon | 0,00951 |
| 4 | informasi | 0,00858 |
| 5 | kirim | 0,02439 |
| 6 | tagih | -0,02724 |
| 7 | percaya | 0,01411 |
| 8 | hormat | 0,00182 |
| 9 | ucap | 0,01586 |
| 10 | surat | 0,03402 |
4.3. Classification
The data classification in this study uses 10000 email data got from a database of one of the contact centers. Data is shared using split validation with a ratio of 80% for training data and 20% for testing data. The type of sampling used is stratified sampling. Email data consists of 4 classes that have 2500 emails for each class, namely Maintenance, Inquiry, Transaction, and Complaint. The data feature was extracted using the TF-IDF and word2vec methods.
- Naive Bayes
Table 3 is the confusion matrix of the email classification results using the Naïve Bayes model and data feature extraction using the TF-IDF method.
Table 3: Confusion Matrix Naive Bayes model with TF-IDF feature extraction
|
true complaint |
true inquiry |
true maintenance |
true transaction |
class precision |
|
|
pred. complaint |
146 | 37 | 21 | 0 | 71.57% |
|
pred. inquiry |
131 | 139 | 57 | 0 | 42.51% |
|
pred. mainenance |
162 | 246 | 230 | 0 | 36.05% |
|
pred. transaction |
61 | 78 | 192 | 500 | 60.17% |
|
class recall |
81.60% | 34.20% | 33.40% | 100% | |
|
Total |
500 | 500 | 500 | 500 |
From table 3 it can be explained that out of the total 2000 emails classified by the number of each class of 500 emails, 146 emails were predicted as true email complaints and 204 emails were predicted as false email complaints, 71.75% class precision and class recall 81.60%. There were 139 emails predicted to be true email inquiry and a total of 188 emails predicted to be the false email inquiry, class precision 42.51% and class recall 34.20%. 230 emails were predicted as true email maintenance and a total of 408 emails were predicted as false email maintenance, class precision 36.05% and class recall 33.40%. 500 emails were predicted as true email transactions and a total of 331 emails were predicted as false email transactions, 60.17% precision classes and 100% class recall.
Table 4 is the confusion matrix of the email classification results using the Naïve Bayes model and data feature extraction using the word2vec method.
Table 4: Confusion Matrix Naive Bayes model with Word2vec feature extraction
|
true complaint |
true inquiry |
true maintenance |
true transaction |
class precision |
|
|
pred. complaint |
408 | 25 | 7 | 0 | 92.73% |
|
pred. inquiry |
18 | 171 | 64 | 0 | 67.59% |
|
pred. maintenance |
21 | 137 | 167 | 0 | 51.38% |
|
pred. transaction |
53 | 167 | 262 | 500 | 50.92% |
|
class recall |
81.60% | 34.20% | 33.40% | 100% | |
|
Total |
500 | 500 | 500 | 500 |
From table 4 it can be explained that out of the total 2000 emails classified by the number of each class of 500 emails, 408 emails were predicted as true email complaints and a total of 440 emails that were predicted as false email complaints, 92.73% class precision and class recall 81.60%. There were 171 emails predicted as true email inquiry and 82 emails predicted as false email inquiry, class precision 67.59% and class recall 34.20%. 167 emails were predicted as true email maintenance and a total of 158 emails were predicted as false email maintenance, class precision 51.38% and class recall 33.40%. 500 emails were predicted to be true email transactions and a total of 482 emails that are predicted to be false email transactions, class precision 50.92% and class recall 100.00%.
Table 5 and Figure 3 are tables and comparison diagrams of email classification results using the Naïve Bayes model and the TF-IDF and word2vec feature extraction method.
Table 5: Summary of Naive Bayes classification result
| Accuracy | Mean Precision | Mean Recall | F1-Score | |
| TF-IDF | 50,75% | 52,57% | 50,75% | 51,65% |
| Word2vec | 62,30% | 65,65% | 62,30% | 63,93% |
From table 8 and figure 2 above it can be seen that the accuracy of email classification using the Naive Bayes model combined with the word2vec feature extraction method has a higher accuracy rate of 63.30%, compared to the accuracy of the classification results of the Naive Bayes model combined with the TF-IDF feature extraction method. which is 50.75%.
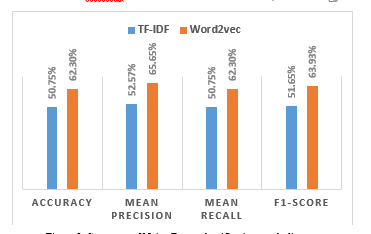 Figure 3: Summary of Naive Bayes classification result diagram
- KNN
The K value used in this classification model is determined by testing using a different K value from the value of K = 1 to the value of K = 10. Figure 4.6 and Table 9 are diagrams and tables of the level of accuracy obtained from the test results with different K values. Classification is done by testing different measure types parameters. The highest accuracy results are obtained with parameters, Measures Types: Numerical Measures and Numerical Measures Type: Cosine Similarity.
Table 6: Level of Accuracy KNN Classification for each K value
| k value | TF-IDF | word2vec |
| 1 | 69,25 | 72,95 |
| 2 | 69,25 | 72,95 |
| 3 | 69,55 | 72,85 |
| 4 | 70,65 | 73,85 |
| 5 | 70 | 72,9 |
| 6 | 70,4 | 73,6 |
| 7 | 69,75 | 72,9 |
| 8 | 70,2 | 73,6 |
| 9 | 69,75 | 74,6 |
| 10 | 69,6 | 74,2 |
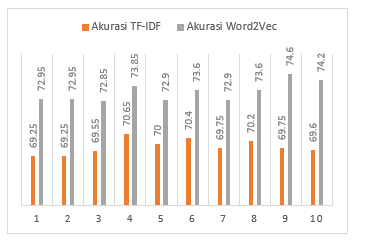 Figure 4: Level of Accuracy KNN Classification for each K value diagram
Table 7 is the confusion matrix of the email classification results using the KNN model with a value of K = 4 and data feature extraction using the TF-IDF method.
Table 7: Confusion Matrix KNN model with TF-IDF feature extraction
|
true complaint |
true inquiry |
true maintenance |
true transaction |
class precision |
|
|
pred. complaint |
329 | 93 | 69 | 0 | 67.01% |
|
pred. inquiry |
108 | 290 | 134 | 0 | 54.51% |
|
pred. maintenance |
60 | 107 | 294 | 0 | 63.77% |
|
pred. transaction |
3 | 10 | 3 | 500 | 96.90% |
|
class recall |
65.80% | 58.00% | 58.80% | 100% | |
|
Total |
500 | 500 | 500 | 500 |
From table 7 it can be explained, out of the total 2000 emails classified by the number of each class of 500 emails, 329 emails were predicted as true email complaints and a total of 162 emails were predicted as false email complaints, 67.01% class precision and class recall 65.80%. There were 290 emails predicted as true email inquiry and a total of 242 emails predicted as false email inquiry, 54.51% precision class and 58.00% class recall. 294 emails were predicted as true email maintenance and a total of 167 emails that were predicted to be false email maintenance, 63.77% precision class, and 58.80% class recall. 500 emails were predicted to be true email transactions and a total of 16 emails that are predicted to be false email transactions, 96.90% class precision and 100.00% class recall.
Table 8 below is the confusion matrix of the results of email classification using the KNN model with a value of K = 9 and data feature extraction using the word2vec method.
Table 8: Confusion Matrix KNN model with Word2vec feature extraction
|
true complaint |
true inquiry |
true maintenance |
true transaction |
class precision |
|
|
pred. complaint |
333 | 50 | 24 | 0 | 81.82% |
|
pred. inquiry |
97 | 299 | 109 | 0 | 59.21% |
|
pred. maintenance |
58 | 135 | 360 | 0 | 65.10% |
|
pred. transaction |
12 | 16 | 7 | 500 | 93.46% |
|
class recall |
66.60% | 59.80% | 72.00% | 100% | |
|
Total |
500 | 500 | 500 | 500 |
From table 8 it can be explained out of the total 2000 emails classified by the number of each class of 500 emails, 333 emails were predicted as true email complaints and a total of 74 emails were predicted as false email complaints, 81.82% class precision and class recall 66.60%. There were 299 emails predicted as true email inquiry and 206 emails predicted as false email inquiry, class precision 59.51% and class recall 59.80%. There are 360 emails predicted as true email maintenance and a total of 193 emails predicted as false email maintenance, 65.10% precision class and 72.00% class recall. 500 emails were predicted as true email transactions and a total of 35 emails were predicted as false email transactions, 93.46% class precision and 100.00% class recall.
Table 9 and Figure 5 are tables and comparison diagrams of email classification using the KNN model and the TF-IDF and word2vec feature extraction method.
Table 9: Summary of KNN classification result
| Accuracy | Mean Precision | Mean Recall | F1-Score | |
| TF-IDF | 70,65% | 70,55% | 70,65% | 70,60% |
| Word2vec | 74,60% | 74,90% | 74,60% | 74,75% |
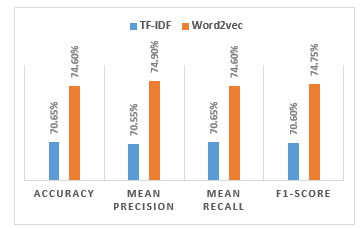 Figure 5: Summary of KNN classification result diagram
From table 9 and figure 5 above it can be seen that the accuracy of email classification using the KNN model using the word2vec data feature has a higher accuracy rate of 74.60% when compared to the KNN model using the TF-IDF data feature 70.65%.
- SVM
Classification with the SVM model is done by testing different types of SVM. The highest accuracy is produced by the SVM model with C-SVC type, sigmoid kernel type and epsilon value of 0.001, which is 77, 85%. Table 13 is the configuration matrix of email classification results using the SVM model and data feature extraction using the TF-IDF method.
Table 10: Confusion Matrix SVM model with TF-IDF feature extraction
|
true complaint |
true inquiry |
true maintenance |
true transaction |
class precision |
|
|
pred. complaint |
356 | 114 | 47 | 0 | 68.86% |
|
pred. inquiry |
107 | 305 | 163 | 15 | 51.69% |
|
pred. maintenance |
32 | 70 | 289 | 0 | 73.91% |
|
pred. transaction |
5 | 11 | 1 | 485 | 96.61% |
|
class recall |
71.20% | 61.00% | 57.80% | 97% | |
|
Total |
500 | 500 | 500 | 500 |
From table 10 it can be explained out of the total 2000 emails classified by the number of each class of 500 emails, 356 emails were predicted as true email complaints and a total of 161 emails were predicted as false email complaints, 68.86% class precision and class recall 71.20%. There were 305 emails predicted as true email inquiry and 285 emails predicted as false email inquiry, class precision 51.69% and class recall 61.00%. 289 emails were predicted to be true email maintenance and a total of 102 emails that were predicted to be false email maintenance, 73.91% class precision and 57.80% class recall. 485 emails were predicted to be true email transactions and a total of 17 emails that were predicted to be false email transactions, class precision 96.61% and class recall 97.00%.
Table 11 is the configuration matrix of email classification results using the SVM model and data feature extraction using the word2vec method
Table 11: Confusion Matrix SVM model with Word2vec feature extraction
|
true complaint |
true inquiry |
true maintenance |
true transaction |
class precision |
|
|
pred. complaint |
398 | 4 | 2 | 0 | 98.51% |
|
pred. inquiry |
56 | 311 | 114 | 0 | 64.66% |
|
pred. maintenance |
42 | 159 | 370 | 22 | 62.39% |
|
pred. transaction |
4 | 26 | 14 | 478 | 91.57% |
|
class recall |
79.60% | 62.20% | 74.00% | 95.60% | |
|
Total |
500 | 500 | 500 | 500 |
From table 11 it can be explained out of the total 2000 emails classified by the number of each class of 500 e-mails, 398 e-mails were predicted as true e-mail complaints and a total of 6 e-mails were predicted as false e-mail complaints, class precision 98.51% and class recall 79.60%. There were 311 emails predicted as true email inquiry and a total of 170 emails predicted as false email inquiry, 64.66% class precision, and 62.20% class recall. 370 emails were predicted as true email maintenance, and a total of 223 emails were predicted as false email maintenance, 62.39% precision class and 74.00% class recall. 478 emails were predicted as true email transactions and a total of 44 emails were predicted as false email transactions, class precision 91.57% and class recall 95.60%.
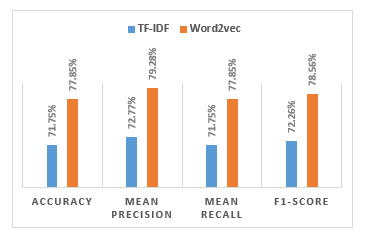 Figure 6: Summary of SVM classification result diagram
Table 12 and Figure 6 are a comparison of email classification results using the SVM model and data features obtained from the TF-IDF and word2vec methods. From table 12 and Figure 6 above it can be seen that the accuracy of email classification using the KNN model using the word2vec data feature has a higher accuracy value of 77.85% when compared to the KNN model using the 71.75% TF-IDF data feature.
Table 12: Summary of SVM classification result
| Accuracy | Mean Precision | Mean Recall | F1-Score | |
| TF-IDF | 71,75% | 72,77% | 71,75% | 72,26% |
| Word2vec | 77,85% | 79,28% | 77,85% | 78,56% |
4.4. Classification Summary
Figure 7 shows the comparison of the accuracy value of the classification results of each model, the highest accuracy value generated by the SVM model with word2vec data features of 77.85%, and the lowest accuracy value generated by the Naive Bayes model with the TF-IDF data features of 50, 75%.
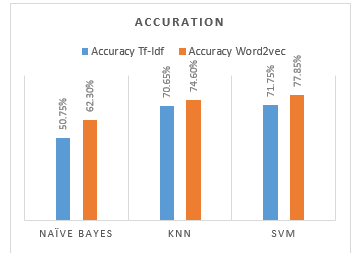 Figure 7: Comparison of Accuracy Diagram
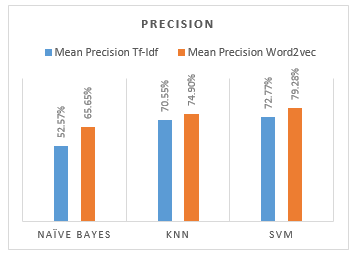 Figure 8: Comparison of Precision Diagram
Figure 8 shows the comparison of the average precision values from the results of the classification of each model, the highest average precision value generated by the SVM model with word2vec data features that is 79.28%, and the lowest average precision value produced by the Naive Bayes model with TF-IDF data features of 52.57%.
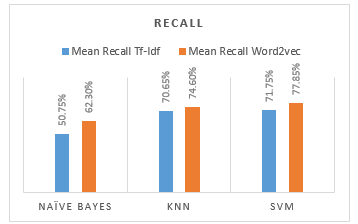 Figure 9: Comparison of Recall Diagram
Figure 9 shows a comparison of the average recall values from the classification results of each model, the highest average recall value generated by the SVM model with word2vec data features of 77.85%, and the lowest average recall value generated by the Naive Bayes model with TF-IDF data features of 50.75%.
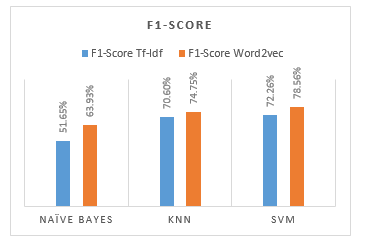 Figure 10: Comparison of F1-Score Diagram
Figure 10 shows a comparison of the F1-Score values from the classification results of each model, the highest F1-Score value generated by the SVM model with word2vec data features of 78.56%, and the lowest F1-Score value generated by the Naive Bayes model with the TF-IDF data features of 51.65%.
Overall accuracy values obtained by classification using the word2vec data features are better when compared to using the TF-IDF data feature. From the classification results, it can be concluded that the data features used in the classification affects the accuracy value.
5. Conclusion
Email classification using the SVM model with Word2vec data features has the highest accuracy rate of 77.85% and the lowest is Naive Bayes model using the TF-IDF data feature of 50.75%. From the results of the classification carried out by each model shows that, classification using different data features has an impact on accuracy, and classification using the word2vec data feature has a better level of accuracy than using the TF-IDF data feature.
- Gomes, S. R., Saroar, S. G., Mosfaiul, M., Telot, A., Khan, B. N., Chakrabarty, A., & Mostakim, M. (2017, September). A Comparative Approach to Email Classification Using Naive Bayes Classifier and Hidden Markov Model. In Advances in Electrical Engineering (ICAEE), 2017 4th International Conference on (pp. 482-487). Dhaka, Bangladesh: IEEE. doi:10.1109/ICAEE.2017.8255404
- Coussement, K., & Van den Poel, D. (2008). Improving customer complaint management by automatic email classification using linguistic style features as predictors. Decision Support Systems, 44(4), 870-882. doi:10.1016/j.dss.2007.10.010
- Vijayarani, S., Ilamathi, M. J., & Nithya, M. (2015). Preprocessing techniques for text mining-an overview. International Journal of Computer Science & Communication Networks, 5(1), 7-16.
- Menaka, S., & Radha, N. (2013). Text classification using keyword extraction technique. International Journal of Advanced Research in Computer Science and Software Engineering, 3(12).
- Harisinghaney, A., Dixit, A., Gupta, S., & Arora, A. (2014, February). Text and image based spam email classification using KNN, Naïve Bayes and Reverse DBSCAN algorithm. 153-155. doi:10.1109/ICROIT.2014.6798302
- Anitha, P. U., Rao, C. V., & Babu, S. (2017, November). Email Spam Classification using Neighbor Probability based Naïve Bayes Algorithm. In 2017 7th International Conference on Communication Systems and Network Technologies (CSNT) (pp. 350-355). Nagpur, India: IEEE. doi:10.1109/CSNT.2017.8418565
- Esmaeili, M., Arjomandzadeh, A., Shams, R., & Zahedi, M. (2017, May). An Anti-Spam System using Naive Bayes Method and Feature Selection Methods. International Journal of Computer Applications, 165(4), 1-5.
- Uysal, A. K., & Gunal, S. (2014). The impact of preprocessing on text classification. Information Processing and Management, 50(1), 104-112. doi:10.1016/j.ipm.2013.08.006
- Lilleberg, J., Zhu, Y., & Zhang, Y. (2015, July). Support Vector Machines and Word2vec for Text Classification with Semantic Features. 136-140. doi:10.1109/ICCI-CC.2015.7259377
- Thangaraj, M., & Sivakami, M. (2018). Text Classification Techniques: A Literature Review. Interdisciplinary Journal of Information, Knowledge & Management, 13, 117-135. doi:10.28945/4066
- Wu, J., Pan, S., Zhu, X., Cai , Z., Zhang, P., & Zhang, C. (2015). Self-adaptive attribute weighting for Naive Bayes classification. Expert Systems with Applications, 42(3), 1487-1502. doi:10.1016/j.eswa.2014.09.019
- Adeva, J. G., Atxa, J. P., Carrillo, M. U., & Zengotitabengoa, E. A. (2014). Automatic text classification to support systematic reviews in medicine. Expert Systems with Applications, 41(4), 1498–1508. doi:10.1016/j.eswa.2013.08.047
- Zheng, B., Yoon, S. W., & Lam, S. S. (2014). Breast cancer diagnosis based on feature extraction using a hybrid of K-means and support vector machine algorithms. Expert Systems with Applications, 41(4), 1476-1482. doi:10.1016/j.eswa.2013.08.044