
Sensor Based on-the-go Detection of Macro Nutrients for Agricultural Crops
Volume 5, Issue 1, Page No 128-134, 2020
Author’s Name: Shraddha Balayya Hirematha), Raghavendra Shet, Nikita Patil, Nalini Iyer
View Affiliations
School of ECE, KLE Technological University, 580031, India
a)Author to whom correspondence should be addressed. E-mail: shraddha_h@bvb.edu
Adv. Sci. Technol. Eng. Syst. J. 5(1), 128-134 (2020); ![]() DOI: 10.25046/aj050117
DOI: 10.25046/aj050117
Keywords: Agriculture, Macro nutrients, SPAD meter

Export Citations
Agriculture, being the vital sector, contributes to India’s GDP by 18%. It is necessary to enhance the production in this sector with minimal need of resources to get the good yield of crops. It in turn boosts up the necessity of automation in the field of agriculture. This paper discusses about the experimental study which includes the invasive/non-invasive method to sense the approximate supply of macro nutrients such as Nitrogen, Phosphorous & Potassium to the plants. The nutrient content of leaf is sensed by the usage of optical sensors. The results have been obtained based on the sensor data carried out for the sample test leaf. Thus, the level of the estimated nutrient contents is indicated by three different ranges such as Low (L), Medium (M) and High (H). A mathematical model is developed for nutrient measurement especially for nitrogen and validated with SPAD meters for the measurement of nitrogen content. The other macro nutrients were also estimated, and the entire system is tested at different test conditions with the support of UASD in the field of University of Agricultural Science.
Received: 31 May 2019, Accepted: 02 November 2019, Published Online: 22 January 2020
1. Introduction
As there is an increase in population and the per capital income, the demand for crop yield is drastically increasing with the advancement in technological growth. It is necessary to identify the severe problems involved in crop yield and address the challenges [1]. Even though there is much advancement in the field of science and technology still farmers across the country adopt the traditional practices. The availability of the resources in the process of farming is one of the most important aspects in eco-system. In addition to this nutrient are very important resources for the plants that give structure to the leaf. Since the population growth of the nation is getting enhanced, this creates a necessity to increase the food production. Supplying the appropriate amount of fertilizers and water becomes evident in enhancing the plantation yield as a whole. The basic nutrients provided to the plants are Nitrogen (N), Phosphate (P), and Potassium (K) in the ratio of 4:2:1. On the other hand due to the lack of awareness and quick measurement techniques, the farmers oversupply nutrients and water to plants, leading to destruction of the crops. Especially the excessive supply of nitrogen nutrient to the crops causes the chemical to evaporate and create oxides of nitrogen (NOx) mainly nitric oxide and nitrogen dioxide into the atmosphere. The formed NOX contributes to the formation of smog and acid rain, affecting ozone layer resulting to global warming. Hence there is a necessity for efficient use of nitrogen broadly known as Nitrogen Use Efficiency (NUE).
The fertilizers should be supplied in appropriate manner so that good number of crops can be obtained without any defects. The exact amount of fertilizers will be supplied based on the type of crop, its growth status and the quality of fertilizers or soil. The growth of the plant depends upon absorption and consumption of the nutrients. One of the major challenges in agriculture in order to get the optimized plant yield is reducing the amount of water consumption and fertilizers [2]. Different nutrients are available in the market for plantations. They are scattered to the plantation area for better crop output. Nitrogen related chemicals are distributed in abundant volume as they play an active role in managing an edulcorated premises in the field. Also, potassium and phosphorous aids in plant growth. The growth stage of the plant can be managed in a better way by maintaining proper supply of these nutrients. But many times, unnecessary supply or inadequate supplies of nutrients are evident in all field area leading to environmental hazards and wastage of crop yield. In association with the technology, a smart way has to be established to accurately measure the nutrient content and supply concrete chunk of fertilizers.
The conventional methods of Chlorophyll and Nitrogen analysis require the destruction of the leaf sample. It is also time-consuming and expensive process. The above techniques cannot satisfy the requirements of precision farming. Non-destructive optical techniques based on absorbance and reflectance of light by leaves have been proven as alternative time-saving and simple techniques to quantify Chl in a number of agricultural species such as birch (Betula pendula Roth.)[3], [4], wheat (Triticum aestivum L.)[5] and potato (Solanum tuberosum L.), maize (Zea mays L.)[6] and soybeans (Glycine max L. Merrill.), sorghum (Sorghum bicolor L. Moench.) and pigeonpea (Cajanus cajan L. Millsp.). Strong relationship between CCI and nitrogen was also reported in sugar maple (Acer saccharum Morsh.) (Van den Berg and Perkins2004) [7], [8], and rice (Oryza sativa L).
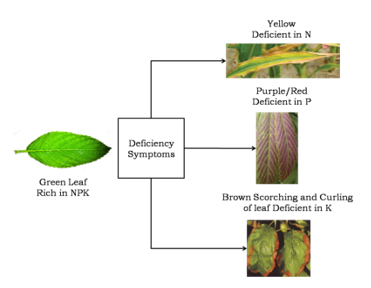 Figure 1: Change of color showcasing nutrient deficiency in leaf
From Figure 1, it is apparent that the deficiency in nutrients results in an outcome in the form visual look of the leaf which proves to be a nutrient deficient plant [9]. The deficiency symptoms in plants completely depend upon the color of the leaf. They are as follows,
- If the color of the leaf results in yellow, it proves to be deficient in N
- If the color of the leaf results in purple/red, it proves to be deficient in P
- If the leaf results in brown scorching and curling of leaf, it proves to be deficient in K
Finally, if the leaf appears to be completely green at its initial and later stages of growth, it results to be rich in all the three macro nutrients.
Methodology carried out to detect the approximate value of nutrients is by the study of spectral reactance of the leaf of the plant. The reactance alters at different stages of the plant growth on the grounds of variation in nutrient content [3]. In particularly the nitrogen is absorbed by the plant through atmosphere and is closely proportional in a linear fashion with chlorophyll. Hence the penetration and reactance of the leaf with light modulates with variation of the color of the leaf from green to yellow. On the other way the different macro nutrients are directly sourced from the soil of the plants.
The techniques present for nutrient and moisture content in plant are:
- Invasive Method
- Non-invasive method
Invasive technique uses destructive method for measurement of nutrients. The invasive methods used for measuring micro and macro nutrients for soil, leaf and irrigation water are:
- Electro-chemical method.
- Ion-selective electrode method.
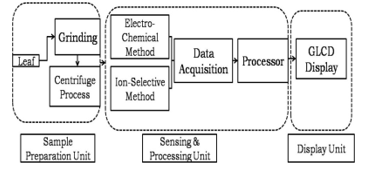 Figure 2: Architecture for Invasive Method
The overall system level block diagram for Invasive technique is depicted in Figure 2. It comprises of the various blocks such as sample preparation unit, sensing & processing unit and display unit. The sample preparation unit consists of sample leaf which is grinded into small pieces and further sent to the centrifuge process where in the sedimentation principle is used to separate the denser substances from less dense ones. The sensing and processing unit inculcates two different methods such as electro-chemical method and ion-selective method to acquire the data from previous unit. The data is further processed and given to the display unit in order to display the required data. The architecture for Non-invasive method is shown in Figure 3. The non-invasive technique uses non-destructive method for measurement of nutrients. This method uses non-contact type of sensors. The optical based sensors with the appropriate wavelength are selected for measuring the nutrients. The output obtained from optical sensor is processed using an embedded system and displayed. Based on the concentration of the nutrients an automatic alarm signal is generated for an inadequate concentration of particular nutrients which in turn controls the switching ON and OFF of the existing drip irrigation system.
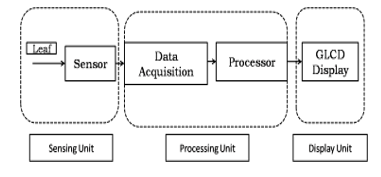 Figure 3: Architecture for Non-invasive Method
In order to quantify the spectral absorption optical sensor was used termed as TCS230.A waveform is generated as a result of the sensor which is later sampled to quantify the changes in nitrogen nutrient in leaf [10]. Different plant families exhibit variations mathematically involving Chlorophyll content Index (CCI) and entire quantity of chlorophyll/nitrogen content [11], [12]. For the product under design a self reliant mathematical model is developed for the species under consideration to a belonged zone. The main feature of the system should include its portability and user friendly behavior.
The organization of the paper is as follows. Section II discusses the implementation details of the system involving nitrogen, phosphorous and potassium detection. Section III discusses the results obtained for each nutrient and lastly section IV concludes the observational study.
2. Proposed Methodology and Implementation
This section describes about the implementation carried out to detect the three essential macro nutrients in plants such as Nitrogen, Phosphorous and Potassium. Two techniques were implemented for stress measurement of different nutrients.
- Non invasive technique for detection of nitrogen and phosphorous.
- Invasive technique for detection of potassium nutrient.
Intermediate sub models were built to reach the set goals. Different methods to improve the efficiency by the means of which precision and smart fertigation is obtained is discussed. This part of the paper also confers about different system models that are developed in order to achieve the set goals. It also discusses various methodologies of optimizations to the built models that are adopted to lock the constraints on various criteria’s and approach by which appropriate nutrient distribution is carried out.
2.1. Nitrogen Detection
This segment of paper describes the details of nitrogen detection in maize leaf using non-invasive technique by discussing the system architecture proposed and implemented, formulating a mathematical model and optimization. Figure 4 shows the structural view of estimating the content of nitrogen in maize plant. It consists of various sub blocks such as color sensor, Pulse modulation wave processing, ADC block, and comparator and display device. The color sensor was used to sense the color of the leaf. Depending upon the color the amount of nitrogen will be estimated. Constant light source was provided to the leaf. The sensor output will be in digital domain. The color of the leaf changes accordingly with the frequency of the output wave. Visible light and infra red are the two light sources which were considered for experimentation. Different set of readings were obtained depending on the lighting conditions. The digital output obtained from the color sensor is provided from the controller for the signal to be processed. The frequency, wavelength of light reflected from the processed data was calculated with the help of algorithm. The frequency obtained is directly proportional to the reflectance of light that in turn changes with the content of chlorophyll of the leaf. Different frequency values are obtained as per the change in the color of the leaf. The relationship between obtained and reference frequency is gained by using mathematical model.
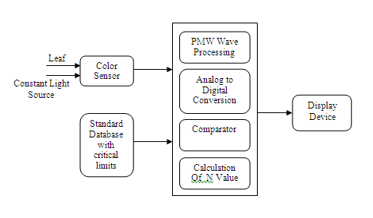 Figure 4: White box of N detecting sub module
The data set for the worst value was aggregated for analytical measurement from UASD College. Based on these values and also the value obtained from the system were compared and the assessed value of nitrogen in percentage of the leaf is unveiled and authenticated.
- Mathematical Modeling
There are several authoritative systems in the market which act as chlorophyll meters. SPAD 502 meter is one such device that is made use in this project to act as a reference for spectral assessment of the leaf [13], [14]. Figure 6 provides an insight of the methodology undertaken to arrive at the inter-relationship between the standard device and the device under design.
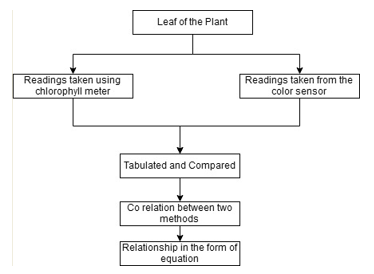 Figure 5: Method to arrive at the relationship between SPAD meter and color sensor
The readings of the leaf using both the devices were taken under different environmental conditions.
Equation (1) describes a linear inter-relation between the data from meter and the color sensor observed by plotting the graph.
Parameter ‘a’ & ‘b’ in Equation 1 constitutes to the slope and intercept respectively. This produces a dedicated mathematical model for nitrogen estimation. While creating a data from the reference meter, the readings were taken from all the different areas of the leaf at various locations. The same technique was also carried out while collecting the leaf data using color sensor
The data tabulation of SPAD meter and N_Sensor plot characterizes non- uniformity and was proportional in an inverted manner with each other revealing no patterns. An in-built function in MatLab i.e. fit function was exploited to fit the curve obtained with the help of polynomial of degree. The equation procured after the fitting procedure is as depicted in Equation 2 which shows inverse proportionality relation between the two data sets. Later stage involved modification of Equation 2 in terms of N_Sensor as exemplified in Equation 3.
 Figure 6: Relationship between chlorophyll content in SPAD and chlorophyll content in sensor
- Optimization
Taguchi’s technique acts as a reference and narrates a systematic approach for planning and conduction of experiments most effectively when there are numerous parameters related to the end results [15]. Hence the most appropriate data is collected which provides valid and objective conclusions as shown in Figure 7. Figure 8 depicts the inclusion of this approach to obtain different features.
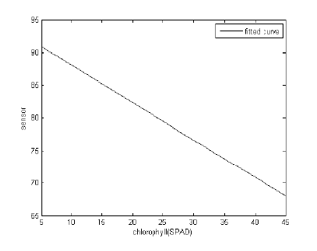 Figure 7: Best fit curve displaying the connection between SPAD device and chlorophyll
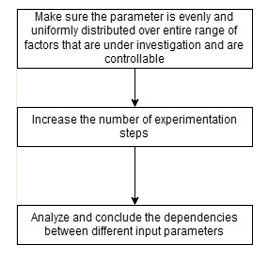 Figure 8: Features list requirement
The signal to noise ratio was plotted and the sensor error was defined as shown in below Figure 9.
 Figure 9: Main effects plot for SN ratios
In terms of achievement a lower range of the ratio of signal and noise should be present. Hence the gilt edge level of data set should be chosen in that range which has very least level of ratio of noise and signal. After above mentioned experimentation the best result is achieved at 5Volts present at second level with the distance of 1cm and at the lower range of frequency of first level. This also covered a large area at 2nd level as shown in Figure 10. A thorough study was investigated to identify the major design factors affecting the quality of the results using ANOVA technique. The outcome of this investigation led to the conclusion that voltage variation mainly influences the results compared to other design parameters.
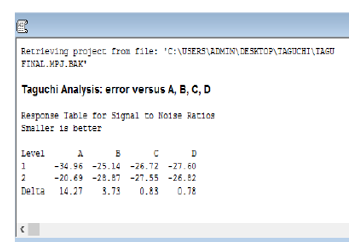 Figure 10: Tabulation of error vs. input factors using Taguchi analysis
2.2. Phosphorous Detection
This is another essential nutrient required in large quantity for the yield to enhance their productivity [16]. As per the observation, this nutrient has absorbance peaks in red regions with the wavelength ranging from 600nm to 700nm. It has no transmission in the near infra-red region. Hence the design in selection of the sensor is enabled such that the emission in light in preferably in the visible region. At the later stage of the sub system an optical filter id designed based on the wavelengths of interest that has to be passed. For this work the wavelength taken into account are beyond 665nm.
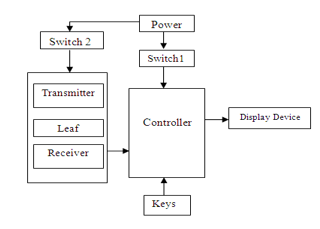 Figure 11: Functional Block Diagram
To calculate the nutrient amount approximately in the maize, crop a conceptual model was developed as depicted in Figure 11. The instrument used to calculate the phosphorous amount is equipped with series of electro-luminescent diodes that eradicates light with greater intensity in the visible range. The output of the designed system produces the range of phosphorous content in three levels – High, Medium and Low. The specimen of interest is exactly positioned between transmitter and receiver. Later the optical sensor detects the reflectance of those wavelengths.
Table 1: Set Threshold Values on Experimental Basis
| Threshold Value | Nature of Leaf |
| 2 | No Green |
| 3 | Green |
Table 2: Readings Obtained for Phosphorous
| Readings | Approximate Phosphorous Content |
| > 3.4 | Sufficient |
| < 3 | Deficient |
Table 1 discusses about the threshold value set based on the numerous readings that differentiates between green and non-green leaf. Table 2 discusses about the obtained readings which provides an approximate phosphorous content. The advantage of the device under investigation is, it identifies the change in Phosphorous content in an approximate manner well before it is visible by naked eye.
2.3. Potassium Detection
This nutrient is considered as the quality nutrient which is required in large amounts for proper growth as well as reproduction of the plants. The detailed block diagram for detecting the potassium content in coconut leaf is shown in Figure 12.
 Figure 12: Functional Block Diagram
An experiment was conducted on coconut leaf to estimate the potassium content. One of the invasive techniques, ion selective electrode method was carried out for estimating the nutrient content. In this approach a K+ electrode is used and the approximate amount of K+ in a standard unit of PPM is determined.
Table 3: Source- Visible light; Measuring parameter- Nitrogen in maize leaf
| Case | Gap between leaf and measuring device in cms | Dark green | Light green | Yellow |
|
Day |
2.4 | 47.05 | 48.81 | 53.26 |
| 2.7 | 45.33 | 47.07 | 51.81 | |
| 3 | 43.10 | 46.01 | 50.95 | |
|
Night |
2.4 | 46.75 | 46.18 | 48.16 |
| 2.7 | 44.83 | 45.98 | 46.445 | |
| 3 | 43.46 | 44.48 | 45.66 |
Table 4: Source-Infrared; Measuring parameter- Nitrogen in maize leaf
| Case | Gap between leaf and measuring device in cms | Dark green | Light green | Yellow |
|
Day |
2.4 | 46.23 | 54.56 | 62.05 |
| 2.7 | 37.27 | 46.34 | 52.34 | |
| 3 | 31.07 | 39.8 | 43.07 | |
|
Night |
2.4 | 41.3 | 45 | 50.06 |
| 2.7 | 36.76 | 39.09 | 41.89 | |
| 3 | 30.12 | 32.76 | 36.23 |
3. Results and Discussion
This part of the study details about the tabulation of results obtained from the designed system for nutrient management in plants. Initial sub sections discuss the detection of nitrogen and phosphorous content in maize plant using non-invasive technique and the last sub section describes the results obtained for potassium content in coconut leaf using invasive technique. An IoT application was built to store the acquired data onto the cloud for further analysis. The created home page with experimental values is been listed.
3.1. Nitrogen Detection
SPAD meter is used as a reference device to carry out the investigation work. The data was recorded and the average of sensor data was calculated for each segment of the leaf. There is a need to compare a wide range of chlorophyll data which is obtained from the spectroscopy. The readings were considered from different segments of the leaf. The most important observation was that the content of chlorophyll was decreased at the center portion of the maize leaf. As it is apparent that leaf’s nitrogen content directly varies with the content of chlorophyll in it. Thus, there is a linear relation between the two. Exploiting this mathematical relation maize leaf nitrogen content is calculated. Tests are conducted during day and night for validating the impact of sunlight on the designed sensor. The sensor is also validated for different sources of light particularly visible and infrared light as depicted in Table 3 and 4
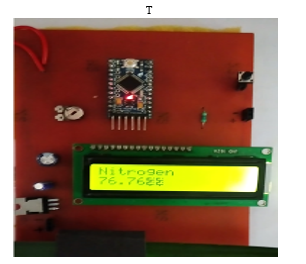 Figure 13: Prototype showing high nitrogen in maize leaf
Figure 13 exhibits the proof of concept of the sub-component implemented.
3.2. Phosphorous Detection
For proof of concept the specimen leaf of maize plant was taken into account. A total of 10 leaves were procured on random basis for analysis. The test was conducted on the leaf using two methods for validation. The work carried out mainly concentrates on developing a strong interdependency between nutrient levels of phosphorous and reflectance numbers in two regions i.e. red and NIR range. [17].
Figure 14 & 15 displays the values obtained by the component under design and web page that includes the real time readings.
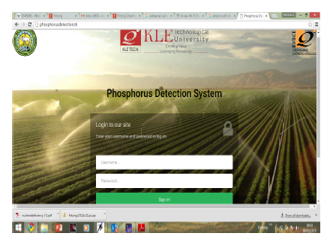 Figure 14: Home Page
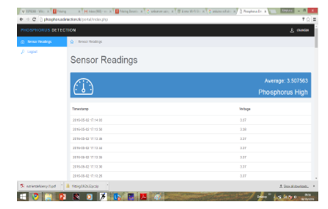 Figure 15: Dash Board
3.3. Potassium Detection
The measuring device initially requires preparation of coconut leaf extract that involves grinding followed by centrifuge process. The electrodes are used to estimate the reading in volts and the data is refined using signal conditioning circuits. The controller processes the conditioned data and displays the results of the nutrient content in terms of High (H), Medium (M) and Low (L). Table 5 displays the results obtained by ion selective method for potassium content in the coconut leaf. There was a linear relationship between the electrode output readings and concentration in PPM. This method of detecting the potassium content was further corroborated by taking the coconut leaf samples for UAS Dharwad which was categorized into less potassium content, medium content and rich in potassium. Using these leaves the results were obtained that stated the potassium content as per its presence in the leaf.
Table 5 : Results Obtained for Potassium Nutrient
| Electrode Output in Volts | Concentration in PPM |
| 0.2 | 4.503 |
| 0.4 | 20.28 |
| 0.6 | 106.204 |
| 0.8 | 478.3 |
| 1.0 | 2154.43 |
| 1.2 | 9703.49 |
4. Conclusion
Irrigation and fertigation play a pivotal role in better yield of crops. Excessive usage of fertilizers, in particular nitrogen leads to evaporation of this chemical which in turn creates global warming. Hence this impacts the environment. The projected work assesses the quantity of the nutrient present in the leaf approximately in the scale of high, medium and low. Three nutrients are addressed which are treated as macro nutrients. The nitrogen and phosphorous was tested and validated for maize plant where as potassium nutrient was initially experimented from coconut leaf. The entire work is based on the spectral analysis which was conducted in isolation for N and P and by inculcating non-invasive method of stress detection. Compared to conventional procedure, sensor-based reasoning of nutrients contributes to large spectrum of readings. Different optimization techniques were involved and among them Taguchi’s approach was used in nitrogen detection.
A server is created to observe the real time data remotely. An invasive technique was also subjected in the proposed work for detecting potassium content in coconut leaf by using ion selective electrode method which was found to be time consuming and involving huge devices for making the required solution.
- B. H. Shraddha, R. M. Shet, P. Nikita and N. C. Iyer, “Nutrient Detection for Maize Plant Using Noninvasive Technique,” 2018 International Conference On Advances in Communication and Computing Technology (ICACCT), Sangamner, 2018, pp. 504-509.doi: 10.1109/ICACCT.2018.8529659
- Ghorbani, Amir Mirzaei Mossivand and Abazar Esmali , “Utility of the Normalised Difference Vegetation Index (NDVI) for land/canopy cover mapping in Khalkhal County”.Ouri 2012
- Bodo M, Schmidhalter U ,” Estimating the nitrogen nutrition index using spectral canopy reflectance measurements”. Europ J Agron. 29:184-190.,2008.
- Betula pendula Roth,”Effects of nitrogen on growth properties and phenology of silver birch” JOURNAL OF FOREST SCIENCE, 58, 2012 (9): 391–399
- Guijun Yang; Chunjiang Zhao; Ruiliang Pu; Haikuan Feng; Zhenhai Li; Heli Li; Chenhong Sun; “Leaf nitrogen spectral reflectance model of winter wheat”( Triticum aestivum L).
- J.E. McMurtrey ; E.M. Middleton ; L.A. Corp ; P.K.E. Campbell ; L.M. Butcher ; C.S.T. Daughtry “Optical reflectance and fluorescence for detecting nitrogen needs in Zea mays L.”
- Van Den Berg, A.K.; Perkins, T.D. Evaluation of a portable chlorophyll meter to estimate chlorophyll and nitrogen contents in sugar maple (Acer saccharum Marsh.) leaves. For. Ecol. Manag. 2004, 200, 113–117.
- P Nikita, P Jyoti, B Shraddha, P Preeti, S Raghavendra, Nalini C Iyer, “ Active Learning in Electronic Measurements and Instrumentation Course through Hands-on ” Journal of Engineering Education Transformations.
- Ahmad U, Mardison S, Tjahjohutomo R, Nurhasanah A , ” Developmentof automatic grading machine prototype for citrus using imageprocessing,” Aust J Agric Eng. 1(5):165-169. , 2010.
- BH Shraddha, M Subhas, P Nikita, P Preeti, K Bhagyashree, RM Shet, P Jyoti, Nalini C Iyer, “Model based Learning of Linear Integrated Circuit Course: A practical approach” Journal of Engineering Education Transformations.
- Anatoly A. Gitelson, Yuri Gritz and Mark N. Merzlyak “Relationships between leaf chlorophyll content and spectral reflectance and algorithms for non-destructive chlorophyll assessment in higher plant leaves”.
- Anand M, Haripriy M, Byju G, ”Chlorophyll meter and leaf colour
chart to estimate chlorophyll content, leaf color, and yield of cassava.Photosynthetic”,. 46: 511-516., 2008. - M. T., Voroney, P. and Parkin, G. 2005, “Predicting nitrogen fertilizer requirements for corn by chlorophyll meter under different N availability conditions”. Can. J. Soil Sci. 85: 149159.
- Chang SX, Robison DJ ,” Nondestructive and rapid estimation of hardwood foliar nitrogen status using the SPAD-502 chlorophyll meter”. Forest Ecol Manag. 181: 331-338.,2003.
- Preeti Pillai, S Raghavendra, B Shraddha, P Nikita, Nalini Iyer, “ Digital Signal Processing: An abstract mathematics to real world experience” Journal of Engineering Education Transformations.
- Osborne, S. L., J. S. Schepers, D. D. Francis, and M. R. Schlemmer. 2002. “Detection of Phosphorus and Nitrogen Deficiencies in Corn Using Spectral Radiance Measurements”.
- Ciganda V, Gitelson A, schepers J,” Non-destructive determination of maize leaf and canopy chlorophyll content. J Plant Physiol” 166: 157-167.,2009.