Performance Portability and Unified Profiling for Finite Element Methods on Parallel Systems

Adv. Sci. Technol. Eng. Syst. J. 5(1), 119–127 (2020);
 DOI: 10.25046/aj050116
The currently available variety of modern, highly-parallel universal processors includes multi-core CPU and many-core GPU (Graphics Processing Units) from different vendors. Systems composed of such processors enable high-performance execution of demanding applications like numerical Finite Element Methods. However, today’s application pro- gramming for parallel systems lacks performance portability: the same program code cannot achieve stable high performance on different parallel architectures. One of the main reasons for this is that parallel programs are developed by utilizing system-specific profiling interfaces of the corresponding hardware vendors. We describe a novel, portable profiling interface: its design, implementation, and evaluation within the popular framework DUNE for solving differential equations using finite element methods. Our profiler is built on top of the PACXX framework for parallel programming in C++, and it supports portable parallel single profiling tool on various target hardware platforms.
1. Introduction
Modern universal processors are becoming highly parallel: multicore CPU and many-core GPU (Graphics Processing Units) are produced by different vendors and exemplify a variety of architecture and hardware solutions. Such processors enable building high-performance systems for computation-intensive applications like numerical finite element methods.
The current programming approaches for parallel computing systems include CUDA [1] that is restricted to GPU produced by NVIDIA, as well as more universal programming models – OpenCL [2], SYCL [3], and PACXX [4] – that follow the idea of unified programming: the programmer can target different hardware without changing the source code, thus reducing the development overhead. However, existing profiling tools are still restricted to the corresponding vendor; therefore, the application programmer usually has to use several different tools to achieve the ultimate portability.
There have been several research efforts to make profiling tools more portable and flexible. CUDA Advisor [5] is a profiling interface that collects data about the performance of both CPU and GPU parts of program code by using the LLVM infrastructure [6].
Experimental approach [7] uses CUDA’s TAU tool for profiling GPU applications by producing a detailed information on communications between CPU and GPU, without modifying the source code. The SASSI instrumentation tool (NVIDIA assembly code “SASS Instrumentor”) [8] relies on customizable metrics: it enables to inserting user-defined instrumentation code (e.g., debug hooks and customized counters) to collect detailed profiling data that are usually not available. The generic tool integrated in the Score-P infrastructure [9] provides an interface for evaluating the performance of OpenCL code on different parallel architectures.
This paper aims at designing a single, cross-platform profiler that significantly improves the portability of program development. We design our profiler by extending the unified programming framework PACXX (Programming Accelerators in C++) [4] with a generic profiling interface: the interface follows the unified programming model of PACXX. Our profiler seamlessly extends the PACXX programming system and enables collecting profiling information at different stages of the development process, for different kinds of the target hardware, thus reducing the development overhead.
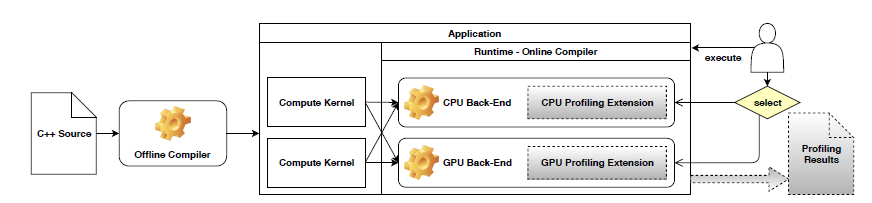 Figure 1: The PACXX framework, extended with profiling (shaded parts)
The unified parallel programming approach of PACXX enables programming CPU/GPU systems in the newest standard C++14/17. PACXX significantly simplifies the development of portable parallel C++ programs by slightly modifying the source code staying within C++. The PACXX advantages were demonstrated for application areas like linear algebra, stencils, and N-Body simulations [10].
We choose Partial Differential Equations (PDE) solving as an application field to illustrate and evaluate our approach to unified profiling, because PDE are broadly used in different areas of engineering and science, including simulation [11], finance [12], numerical modeling [13], and biology [14]. Most of practically important PDE are solved using finite-element (FE) methods. Unfortunately, these methods’ implementation is often tied to a particular data structure representing the corresponding computation grid. C++ is often used for implementing finite-element methods, because of its high performance and modularity. The Finite Element Computational Software (FEniCS) [15] is a C++-based framework for FE variational problems, relying on automatic code generation and the custom FEniCS Form Compiler [16]: it supports performance portability by employing a domain-specific language based on Python [17], and multi-staging optimization. The Firedrake approach [18] achieves performance portability by using an advanced code generator: problems are specified in a Python-embedded, domain-specific language that is lowered to C and then JIT-compiled, so target code is generated at run time. The object-oriented framework Overture [19] for solving PDE on various platforms contains C++ classes for computations in different geometries. The Feel++ framework [20] uses a C++-based domain-specific language whose implementation is compatible with third-party libraries.
In order to evaluate our approach to unified profiling, we consider the Distributed and Unified Numerics Environment (DUNE) [21] as a case study. DUNE offers a unified interface for solving PDE on parallel systems [22]: the interface combines various methods in a modular C++ library. DUNE enables using arbitrarily shaped grids and a large set of particular algorithms. While the design of DUNE is very flexible, its application performance strongly depends on the employed C++ compiler and the target hardware.
The goal of this paper is to extend the flexibility of existing approaches to parallel PDE solving. We achieve performance portability and cross-platform profiling of the finite-element methods for solving PDE, by extending the PACXX framework and integrating it with the existing DUNE framework.
The paper is organized as follows. In Section 2, we describe the C++-based unified programming approach of PACXX and the design of our profiling interface. In Section 3, we show how this interface is used for a portable profiling a simple case on various target architectures. In Sections 4 and 5, we illustrate how PACXX can accelerate grid-based FE algorithms for PDE in the extended DUNE. We demonstrate that the integration of PACXX with DUNE leads to performance portability over different architectures, significantly decreasing the development overhead and improving code maintenance. We experimentally evaluate our unified profiling approach in Section 6, and we summarize our results in Section 7.
2. Programming and profiling
2.1 The PACXX Programming model
We use the PACXX framework [4] that supports a unified, C++based model of parallel programming. In analogy with the recent OpenCL standard [23], PACXX uses the parallelism expressed using kernels that are executed on devices. The main advantage of PACXX, however, is that an application is expressed as singlesource C++ code, whereas OpenCL kernels are implemented in a special kernel language and they need additional host code to be executable. The performance portability in PACXX is ensured by means of several pre-implemented back-ends.
Figure 1 shows that the compilation process of PACXX proceeds in two steps. The first step is the offline compilation that transforms source code into an executable. Kernel’s code is precompiled, and the executable is integrated with the particular back-end for the target CPU or GPU. In the second stage, online compilation is invoked when the executable is started. The integration of the executable with back-ends for different architectures allows the user to choose the target hardware for each execution. The efficient execution on the chosen target system is handled by PACXX transparently: all necessary generation steps and optimizations are performed automatically. This brings the portability of PACXX applications on CPUs and GPUs of different vendors.
2.2 Profiling interface: Design and implementation
Figure 1 shows the design of our unified profiling interface integrated into PACXX: shaded are our profiling extensions to the original PACXX back-ends. These extensions comprise hard ware specific code to collect profiling data. For the user, our profiling interface can be viewed as a wrapper that can choose the corresponding profiling extension for the particular target architecture.
The advantage of our design of profiling is that no changes to the offline compiler of PACXX are necessary. The modifications are made only to the PACXX runtime and back-ends: they are extended with vendor-specific profiling tools: the CPU back-end uses the PAPI library [24], and the back-end for NVIDIA GPUs relies on the CUPTI library [25].
2.3 The profiling extension
For different back-ends, the profiling extensions have a unified structure that includes a changed launch procedure for kernels to manage collecting performance data. We have to modify the way how a kernel is launched, because many existing devices cannot record several profiling metrics simultaneously (e.g., NVIDIA GPUs [25]). For some metrics, multiple reproducible runs of the same kernel may be necessary to record that metric. It becomes mandatory to rebuild the device memory state automatically after each kernel execution, such that the executions are measured independently. This reconstruction of the memory state enables multiple profiling runs for the same program, so that accurate performance data are produced. Traditionally, this is done using a shadow copy mechanism that stores and restores the device memory state transparently at each kernel execution. This solution effectively decouples the profiling from undesirable side effects: eventually this ensures exact performance data and deterministic behavior when measuring multiple kernel launches.
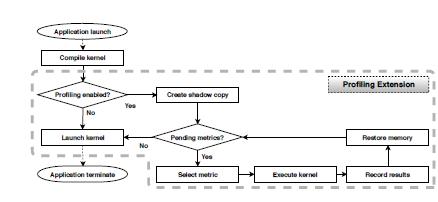 Figure 2: Kernel launch, modified for profiling
Figure 2 shows our modification (in dashed box) to the launch procedure within a PACXX back-end. The new launch procedure reflects the control flow of our profiling extension: the processing steps rely on target-specific code of the concrete back-end. When profiling is enabled, a kernel launch triggers the profiling extension to store a shadow copy of the utilized part of device memory. Then the kernel is executed repeatedly, such that this shadow copy is used for every recorded performance metric. Eventually, the application proceeds using the original kernel launch procedure.
3. The profiler usage
We demonstrate the usage of and evaluate our unified profiler on two application examples – the first is traditional multiplication of matrices, and the second is a more elaborated PDE solver.
3.1 Example: Matrix multiplication
Figure 3 illustrates how matrix multiplication is expressed in PACXX [4]: this program is created from the C++ code by transforming nested sequential loops into parallel calls of a kernel. Arrays a and b stand for the input matrices, and array c stores the resulting matrix. The matrixMultKernel kernel (lines 15-23) is written as a C++ lambda expression to be computed in parallel for each element of c. The kernel run requires an upload of the input data (lines 3-13) and the result fetching (line 26) after the computation, which is analogous to CUDA and OpenCL kernels.
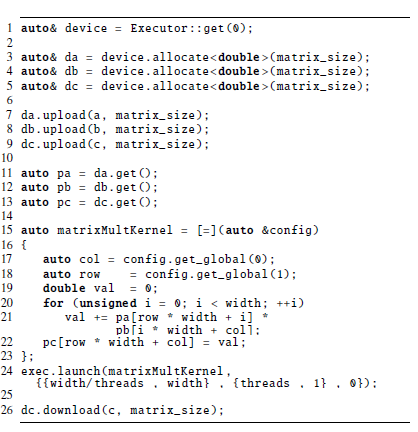 Figure 3: PACXX code example: matrix multiplication
Figure 3 shows that the code employs parallelism by dividing calculations in blocks and threads. Function launch (line 24) invokes the kernel and it partitions work in dimensions (up to three), thus specifying the structure and degree of parallelism. In the range, the first component declares how many blocks are started, while the threads variable in the range declares the threads number in a block. At run time, each block is assigned to a processor that runs all threads of the block in the SIMT (Single Instruction, Multiple Threads) manner, which is a combination of SIMD and multi-threading paradigms. Function get global retrieves the thread id in each dimension of the range. The first dimension of the range in our example corresponds to the row, and the second to the column in the matrix.
After the invocation of PACXX offline compiler, the executable is automatically combined with our profiler. Therefore, PACXX serves effectively as a drop-in for the standard LLVM (Low-Level Virtual Machine) [6] compilation toolchain.
3.2 Workflow of profiling
In Figure 4, the profiling of our example application is invoked with the runtime environment variable PACXX PROF ENABLE enabled, which leads to profiling each kernel invocation. At each kernel run, the runtime system executes the online compilation transparently for the user and it enables the profiler, such that the profiling information is collected from the target device. Variable PACXX DEFAULT RT specifies the target architecture (CPU or GPU). Profiling data are written in an output file that can be either explicitly specified as in Figure 4 or sent to the standard output.
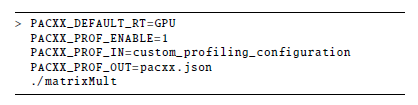 Figure 4: Invoking a PACXX program with profiling
Our profiler always reports one metric – runtime duration – by default. To ask for additional profiling data, the user can specify a specific configuration. The profiler is able to profile all metrics that are supported by the system vendor, e.g., memory throughput and usage, instructions per cycle, etc. All 174 possible metrics for NVIDIA GPUs are listed in [25].
3.3 Visualization of profiling
Figure 5 illustrates the profiling data collected for the matrix multiply example prepared as shown in Figure 4. The profiler produces a JSON-format file that comprises all specified metrics for each started kernel instance. For multiple kernel launches, our profiler records every launch independently, and the output data are prefixed by the kernel name. Thus, the user obtains profiling information automatically: the user does not have to explicitly select the profiling tool for a kernel and the architecture on which it runs: the appropriate profiling functionality is ensured by the PACXX runtime for the target architecture.
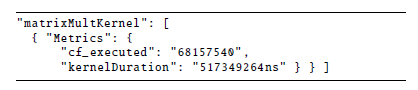 Figure 5: Results of profiling in JSON format
The use of the JSON format enables efficient visualization of the profiling results using Gnuplot or other tools, such that the code behavior on different target platforms can be conveniently compared.
Figure 6 compares the execution time of matrix multiplication on a CPU (Intel Xeon E5-1620 v2) vs. a GPU (NVIDIA Tesla K20c). The input comprises two 4096×4096 square matrices generated randomly. The plot demonstrates how the execution time is dependent of the parallelism amount specified by parameter threads in the code in Figure 3.
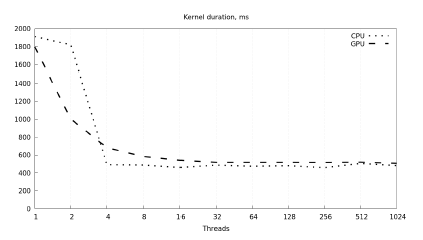 Figure 6: Execution time of matrix multiply on CPU vs. GPU
Figure 7 compares the number of branch statements on CPU vs.
GPU, depending on the number of threads.
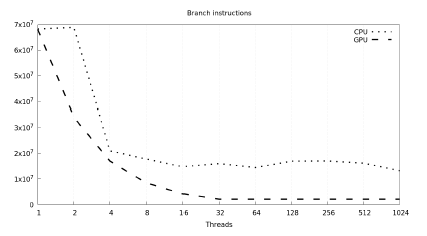 Figure 7: Number of branch instructions on CPU vs. GPU
Summarizing, our profiler enables both specifying metrics and representing profiling results in a uniform manner, such that different target architectures can be compared with each other conveniently.
4. Integrating DUNE with PACXX
In this section, we show the use of our approach to profiling on the case study of the DUNE framework. We explain its efficient integration with the PACXX unified programming framework, by taking into account the design of DUNE’s grid interface.
Our idea of integration is to employ PACXX as a code generator for the DUNE interface which is designed by using abstract interfaces and template meta-programming to separate data structures and algorithms. By reusing existing modules, DUNE offers a rich collection of functionalities.
In our integration with PACXX, we use the fact that DUNE contains C++ modules that provide abstract interfaces with several implementations. The use of generic programming [26] and C++ template meta-programming [27] enables optimizations to be applied at compile time: therefore, DUNE is flexible, without introducing overhead at runtime.
Figure 8 illustrates that our integration comprises two levels.
At the top (abstraction) level, a particular problem is formulated using extensions of a domain-specific language analogous to [28], and is then implemented as a specific DUNE kernel. At the bottom (hardware optimization) level, code is generated for a specific target architecture. This two-level design of the integration toolchain enables suitable optimizations at every processing level.
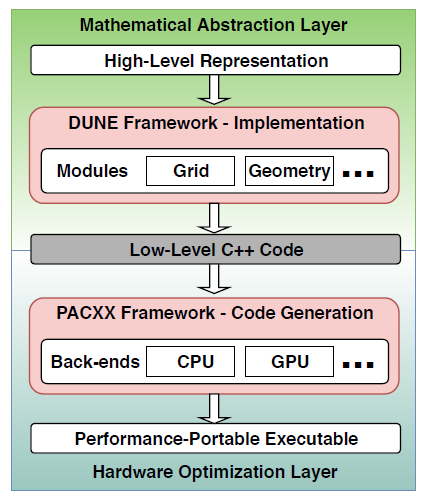 Figure 8: Integration of PACXX with DUNE
The integrated toolchain is now as follows. The PDE problem is stated by the domain expert as an expression of a domain-specific language, which is then implemented by a specific grid-based kernel of DUNE: the framework yields C++ code that contains the resulting kernel with template arguments and runtime values. This code is eventually compiled by PACXX, as we explain below.
The PACXX framework employs the popular LLVM compiler infrastructure and its Intermediate Representation (IR) [6] to obtain portable executables with hardware-specific optimizations. Kernels are compiled offline to IR and then the online compiler generates code and optimizes it for the target architecture [10] transparently for the user. This toolchain enables portable PACXX applications over architectures of modern parallel processors. PACXX also supports C++ template meta-programming which significantly reduces the runtime overhead, and our unified profiling allows profiling of the DUNE without further modifications to the code.
The main advantage of using PACXX vs. existing profilers is the profiling of applications over various platforms, without having to use different tools. Our profiler improves the flexibility of programming process: the program can be configured regarding requested profiling data on every supported target architecture. In addition, due to the use of PACXX for generating code in DUNE we can apply optimizations based on control-flow linearization [29]. Since PACXX is fully compatible with the modern C++14/17 standards, the program developers can use existing C++ code on various target architectures, which significantly reduces the development effort.
5. Compiling kernels: examples
This section describes the use of our integrated DUNE-PACXX framework for generating code for two examples of DUNE kernels: 1) Poisson equation solving, and 2) deformation of material calculation based on the linear elasticity theory. These two examples cover two scenarios: Poisson calculates with low load on a simple 2D grid, and linear elasticity is based on a 3D grid with a heavy load. Example applications of linear elasticity are in computer-aided design, and Poisson is applied in physics to calculate fields of potentials.
5.1 PACXX parallelization
We consider example kernels that are simple sequential C++ codes; they are parallelized according to the PACXX programming approach. The slight one-time adaptation effort of the kernels leads to the performance portability of the resulting code. Thereby the programmer does not have to re-design the program code for each new parallel architecture.
Our two kernel examples work on a grid refined on two levels: the computation in a uniform grid of macro-elements uses a coarsegrained refinement, and each macro-element is further refined to a grid of micro-elements. We parallelize kernels by two ways: either different macro-elements are processed in parallel, or several micro-elements in a macro-element are processed in parallel.
We compare the micro- vs. macro-parallelization approaches regarding their performance against an original sequential version.
5.2 The Poisson kernel
1 // iterating over micro-elements 2 for (int el_y=0; el_y<k; ++el_y)
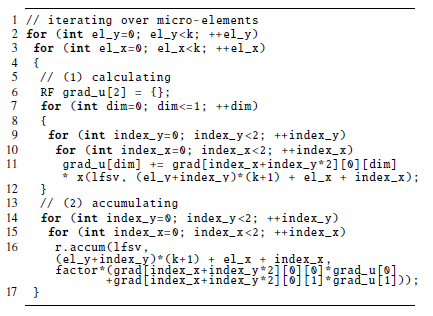 Figure 9: Poisson kernel: sequential C++ code
Figure 9 illustrates the C++ code for the Poisson kernel that computes a single macro-element in DUNE. Two nested for loops in lines 2-3 iterate on the micro-grid. For every element, the computation comprising the loop body is executed. Local basis functions lf sv and x in line 11 compute a gradient, and the consequent accumulation phase (line 16) uses the calculated gradient for updating the computational grid.
Figure 10 shows how the memory is accessed by the kernel in Figure 5.
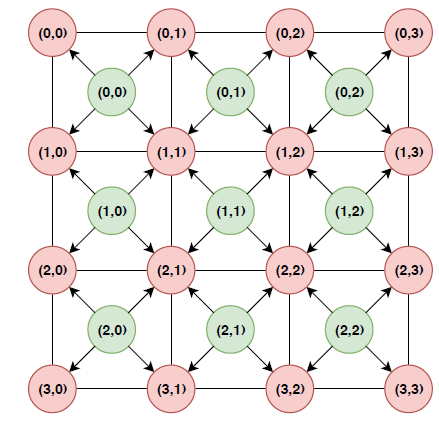 Figure 10: Poisson: micro-grid and data dependencies
For correct parallelization, we must avoid race conditions.
Therefore, we synchronize accesses to memory by distinguishing between two kernels – accumulation and computation. We parallelize the calculation kernel on the micro-grid elements, but temporarily store the results of the calculation kernel, rather than performing write operations immediately.
Afterwards, the corresponding vertices are processed in parallel by the accumulation kernel: it reads the previously stored intermediate results and updates the adjacent vertices by simultaneous write operations. This described implementation guarantees the absence of conflicts in the patterns of memory access at the level of micro-grid.
At a macro-layer, we parallelize computations by executing the main computation for each instance of the kernel, such that process in parallel all macro-elements. For this approach, DUNE’s grid interface must be slightly modified, but the advantage is that the patterns of memory access are not so complicated.
The parallelization at macro-layer implies that workload is distributed in a coarse-grained manner; this is advantageous on largescale since it greatly reduces the parallelization overhead. However, it brings a drawback: global memory must be allocated by all macro-elements simultaneously, so the memory requirement increases. Vice versa, the fine-grained distribution of workload for micro-layer parallelism allocates little memory for a macro-element at a time. Therefore, large micro-grids with enough compute load in a single macro-element especially benefit from the micro-layer parallelization.
5.3 Kernel for linear elasticity
Figure 11 shows our second example – the linear elasticity kernel that consists of three nested for loops. and is thus significantly more complex than Poisson. On the one hand, this complicates the parallelization (while the scheme of parallelization remains similar to Poisson), but on the other hand, this offers more potential of parallelism.
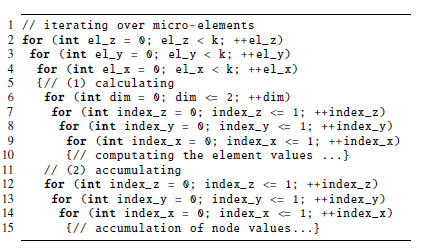 Figure 11: Linear elasticity: sequential C++ code
6. Experimental evaluation
We conduct our measurements using two parallel processors: an Intel CPU Xeon E5-1620v2 with 4 cores of frequency 3.70GHz (8 logical cores), and an NVIDIA GPU Tesla K20c with 2496 compute units. Our CPU contains AVX with vector registers, so we evaluate both scalar and auto-vectorized versions of our kernels. The number of (sub)elements (x-axis) corresponds to the subdivision degree of the grid in each dimension: e.g., 5 sub-elements imply a 5x5x5 grid in a 3D program for linear elasticity.
Each measurement performs one iteration of the linear elasticity program which corresponds to 16 executions of the kernel based on the amount of quadrature points. The following figures compare the three aforementioned platforms (vectorized CPU, scalar CPU and GPU) based on various metrics.
Figure 12 and Figure 13 show the memory operations (lower is better). We observe that read operations can be coalesced quite well, while write operations less so. The GPU with its 32 memory controllers sets the target for other hardware platforms which they struggle to reach.
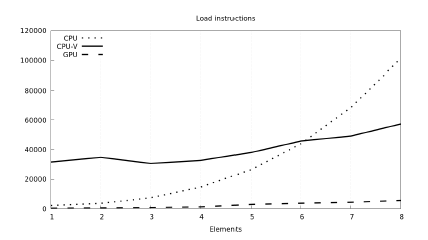 Figure 12: Number of executed memory reads across used platforms
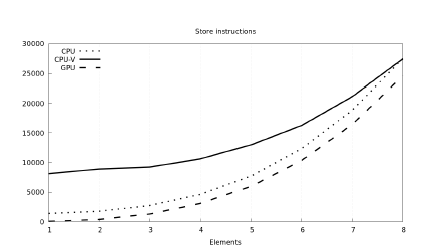 Figure 13: Number of executed memory writes across used platforms
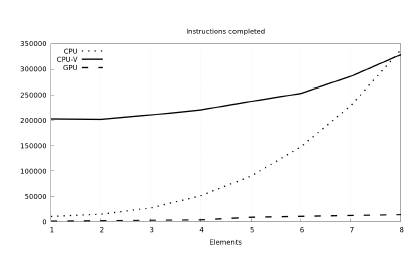 Figure 14: Total completed instructions across used platforms
On the code side, Figure 14 shows the number of executed instructions. We see that CPU vectorization suffers from the low data sizes generating too many scatter-gather instructions (Figure 15 further supports this claim, showing an order of magnitude more processed control-flow instructions in the vectorized CPU version of the kernel). The GPU can distribute the load across its numerous 2496 computing units and keep the number of instructions low.
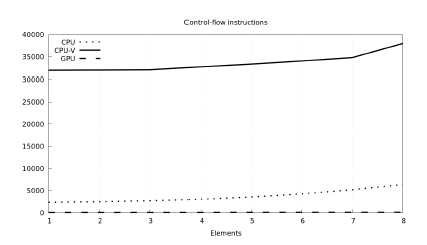 Figure 15: Number of executed control-flow instructions across used platforms
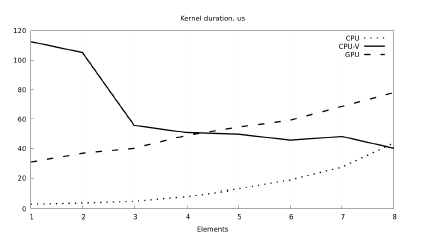 Figure 16: Linear elasticity kernel duration across used platforms
Figure 16 compares the run time of kernel execution. Vectorized CPU version of the kernel does not show good performance with low data amounts, but it improves over the scalar CPU version by element count of 8, matching with the expectation from Figure 14. Surprisingly, the GPU version lags behind the scalar CPU version, so we look into the reasons of low performance on the GPU side.
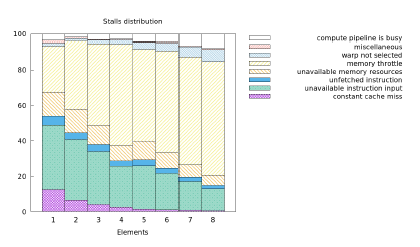 Figure 17: Execution stalls on the GPU causing low performance
Figure 17 shows that the major slowdown reason is memory throttling caused by the hardware limitation to issue memory instructions every 4 cycles. Therefore, memory requests have high divergence and, thus, cannot be fulfilled in a timely manner.
7. Conclusion
We design and implement a novel cross-platform approach to programming and profiling parallel applications, which significantly improves the portability of program development. We extend the unified programming framework PACXX with a generic profiling interface that enables collecting profiling information at different stages of the development process, for different target hardware. Our approach liberates the program developer from having to use several proprietary tools when profiling the same application on different hardware. Therefore, the software development overhead is significantly reduced.
We choose Partial Differential Equations (PDE) solving to illustrate and evaluate our approach of unified profiling, because PDE are broadly used in different areas of engineering and science. As a case study, we use the popular DUNE framework, and we experimentally confirm that the integration of our extended PACXX with DUNE leads to performance portability over different architectures, significantly decreasing development overhead and improving code maintenance.
Acknowledgement
The authors gratefully acknowledge generous support from the German Federal Ministry of Education and Research (BMBF) within the HPC2S E project.
- J. Nickolls, I. Buck, M. Garland, K. Skadron, “Scalable Parallel Programming with CUDA,” Queue, vol. 6, pp. 40–53, Mar. 2008.
- J. Kim, S. Seo, J. Lee, J. Nah, G. Jo, J. Lee, “OpenCL As a Unified Program- ming Model for Heterogeneous CPU/GPU Clusters,” SIGPLAN Not., vol. 47, pp. 299–300, Feb. 2012.
- R. Keryell, R. Reyes, L. Howes, “Khronos SYCL for OpenCL: A Tutorial,” in Proceedings of the 3rd International Workshop on OpenCL, IWOCL ’15, (New York, NY, USA), pp. 24:1–24:1, ACM, 2015.
- M. Haidl, M. Steuwer, T. Humernbrum, and S. Gorlatch, “Multi-stage Pro- gramming for GPUs in C++ Using PACXX,” in Proceedings of the 9th Annual Workshop on General Purpose Processing Using Graphics Processing Unit, GPGPU ’16, (New York, NY, USA), pp. 32–41, ACM, 2016.
- D. Shen, S. L. Song, A. Li, X. Liu, “CUDAAdvisor: LLVM-based Runtime Profiling for Modern GPUs,” in Proceedings of the 2018 International Sym- posium on Code Generation and Optimization, CGO 2018, (New York, NY, USA), pp. 214–227, ACM, 2018.
- C. Lattner, V. Adve, “LLVM: A Compilation Framework for Lifelong Program Analysis & Transformation,” in Proceedings of the International Symposium on Code Generation and Optimization: Feedback-directed and Runtime Op- timization, CGO ’04, (Washington, DC, USA), pp. 75–, IEEE Computer Society, 2004.
- A. D. Malony, S. Biersdorff, W. Spear, S. Mayanglambam, “An Experimental Approach to Performance Measurement of Heterogeneous Parallel Applica- tions Using CUDA,” in Proceedings of the 24th ACM International Conference on Supercomputing, ICS ’10, (New York, NY, USA), pp. 127–136, ACM, 2010.
- M. Stephenson, S. Hari, S. Kumar, Y. Lee, E. Ebrahimi, D. R. Johnson, D. Nel- lans, M. O’Connor, and S. W. Keckler, “Flexible Software Profiling of GPU Architectures,” SIGARCH Comput. Archit. News, vol. 43, pp. 185–197, June 2015.
- R. Dietrich, R. Tschu¨ter, “A generic infrastructure for OpenCL performance analysis,” in 2015 IEEE 8th International Conference on Intelligent Data Acquisition and Advanced Computing Systems: Technology and Applications (IDAACS), vol. 1, pp. 334–341, Sept 2015.
- M. Haidl, B. Hagedorn, S. Gorlatch, “Programming GPUs with C++14 and Just-In-Time Compilation,” in Parallel Computing: On the Road to Exascale, Proceedings of the International Conference on Parallel Computing, ParCo 2015, 1-4 September 2015, Edinburgh, Scotland, UK, pp. 247–256, 2015.
- F. Feldmann, B. Hagemann, L. Ganzer, M. Panfilov, “Numerical simulation of hydrodynamic and gas mixing processes in underground hydrogen storages,” Environmental Earth Sciences, vol. 75, p. 1165, Aug 2016.
- Daniel J. Duffy, Finite Difference methods in financial engineering: a Partial Differential Equation approach. John Wiley & Sons, 2013.
- I. Rucker, W. Ressel, “A numerical drainage model to simulate infiltration into porous pavements for higher road safety,” in 17. Internationales Stuttgarter Symposium, (Wiesbaden), pp. 1293–1303, Springer Fachmedien Wiesbaden, 2017.
- Anthony W. Leung, Systems of nonlinear partial differential equations: ap- plications to biology and engineering, vol. 49. Springer Science & Business Media, 2013.
- M. S. Alnæs, J. Blechta, J. Hake, et al., “The FEniCS project version 1.5,”
Archive of Numerical Software, vol. 3, no. 100, pp. 9–23, 2015. - A. Logg, K. B. Ølgaard, M. E. Rognes, and G. N. Wells, “FFC: the FEniCS form compiler,” in Automated Solution of Differential Equations by the Finite Element Method, pp. 227–238, Springer, 2012.
- G. R. Markall, F. Rathgeber, L. Mitchell, et al., “Performance-Portable Finite Element Assembly Using PyOP2 and FEniCS,” in Supercomputing, (Berlin, Heidelberg), pp. 279–289, Springer Berlin Heidelberg, 2013.
- F. Rathgeber, D. A. Ham, L. Mitchell, et al., “Firedrake: automating the finite element method by composing abstractions,” ACM Transactions on Mathematical Software (TOMS), vol. 43, no. 3, p. 24, 2017.
- D. L. Brown, W. D. Henshaw, and D. J. Quinlan, “Overture: An object- oriented framework for solving partial differential equations,” in International Conference on Computing in Object-Oriented Parallel Environments, pp. 177– 184, Springer, 1997.
- C. Prud’Homme, V. Chabannes, V. Doyeux, et al., “Advances in Feel++: a domain specific embedded language in C++ for partial differential equations,” in Eccomas’ 12-European Congress on Computational Methods in Applied Sciences and Engineering, 2012.
- P. Bastian, M. Blatt, C. Engwer, et al., “The distributed and unified numer- ics environment (DUNE),” in Proc. of the 19th Symposium on Simulation Technique in Hannover, vol. 123, 2006.
- P. Bastian, M. Blatt, A. Dedner, et al., “A generic grid interface for parallel and adaptive scientific computing. Part I: abstract framework,” Computing, vol. 82, no. 2-3, pp. 103–119, 2008.
- J. E. Stone, D. Gohara and G. Shi, “OpenCL: A Parallel Programming Stan- dard for Heterogeneous Computing Systems,” IEEE Des. Test, vol. 12, pp. 66– 73, May 2010.
- J. Dongarra, K. London, S. Moore, P. Mucci and D. Terpstra, “Using PAPI for Hardware Performance Monitoring on Linux Systems,” 08 2009.
- “CUPTI API.” https://docs.nvidia.com/cuda/cupti/r main.html. Accessed: 2018-07-14.
- P. Bastian, F. Heimann, and S. Marnach, “Generic implementation of finite el- ement methods in the distributed and unified numerics environment (DUNE),” Kybernetika, vol. 46, no. 2, pp. 294–315, 2010.
- M. Blatt and P. Bastian, “The iterative solver template library,” in InternationalWorkshop on Applied Parallel Computing, pp. 666–675, Springer, 2006.
- M. S. Alnæs, A. Logg, K. B. Ølgaard, M. E. Rognes, and G. Wells, “UnifiedForm Language: A Domain-specific Language for Weak Formulations of Par- tial Differential Equations,” ACM Trans. Math. Softw., vol. 40, pp. 9:1–9:37, Mar. 2014.
- M. Haidl, S. Moll, L. Klein, H. Sun, S. Hack, and S. Gorlatch, “PACXXv2+RV: An LLVM-based Portable High-Performance Programming Model,” in Proceedings of the Fourth Workshop on the LLVM Compiler Infras- tructure in HPC, LLVM-HPC, (New York, NY, USA), pp. 7:1–7:12, ACM,
2017.