Modelling the Methodology to Assess the Effectiveness of Distributed Information Systems
 , Galina Pavlovna Akimova 1, Matvey Aleksandrovich Pashkin 1, Aleksander Vladimirovich Soloviev 1
Adv. Sci. Technol. Eng. Syst. J. 5(1), 86–92 (2020);
 DOI: 10.25046/aj050111
This research aims to develop the methodology to assess effectiveness of distributed information systems (hereinafter IS). The effectiveness of information systems is reviewed along with their reliability. The article underlines the importance of reliability assessment for large geographically distributed systems. We suggest the approach based on the hierarchical presentation of reliability scheme that constitutes the core of the mathematical model for reliability of a distributed system. The key advantage of the suggested approach is its applicability on geographically distributed systems of different architecture. Successful testing during effectiveness and reliability assessment on 3 geographically distributed IS allows to suggest that the developed methodology is ready to be used in IS reliability assessment projects.
1. Introduction
Rapid development of information and communication technologies contributed to the design and development of new large-scale geographically distributed systems that have become an integral part in the progress of state and transnational corporations. A large-scale geographically distributed system can be viewed as a set of interconnected hard and software. If an IS is unreliable or ineffective then a failure of one or several of the critical nodes can crash the whole system. Thus, it is crucial to be able to detect risks in due time and check operation performance of an IS. Regular reliability and effectiveness assessment will help to eliminate these risks [1]. In large geographically distributed IS, these problems are aggravated by the complexity and heterogeneity of IS hardware and software architecture. Thus, effectiveness and reliability assessment becomes especially important [2].
However, if the term reliability is quite clearly defined [3] then the term IS effectiveness is rather vague. Thus, according to the Russian state standard – GOST 34.003–90 – the effectiveness of an automated system means «the extent to which the goal set at the development of an IS is reached» [4]. In order to be able to measure IS effectiveness at the start of IS design developers have to define quality parameters by which system effectiveness will be assessed during operation [5], [6].
The following parameters are specified when an IS operational effectiveness is discussed from a technical point of view [7]:
- Adaptability – the IS property defining the ability to correlate to different functionalities and change accordingly;
- Availability – the IS property defining the availability of system functions and data stored in it at any time;
- Response time – the IS property defining the ability to guarantee timeliness and appropriate performance with consideration of declared performance indicators [8];
- IS reliability;
- Some studies identify other parameters, e.g. usability [9] or information security [10], resistance to external actions, including disaster recovery etc.
Practice has proved that the system of the abovementioned parameters is quite universal [7]. Besides, if we set one of the parameters as a primary one, e.g. reliability, then the rest of the parameters will be considered as restrictions. Alternatively, reliability may be considered as a restriction to other quality parameters. For example, the system may be “absolutely reliable” but it does not ensure availability of data or timeliness (reasonable response time), thus it cannot be considered effective.
Over the last 25 years there have been many researches dedicated to reliability in the context of IS architecture, data inside this IS and automated processes [5], [6]. However, none of these researches allows to clearly correlate the system reliability with certain distributed nodes and get a unified assessment that can be used in different projects. This article continues the reliability assessment research [11] and is dedicated to the modelling of methodology to assess effectiveness of geographically distributed information systems. The main quality parameter for the purposes of this article is IS reliability, while other parameters are regarded as restrictions.
2. Modelling the reliability of geographically distributed information systems
Reliability is definitely an important parameter of IS effectiveness. According to [12], reliability is an IS property enabling to preserve in time assigned parameters required to fulfill the main function under the influence of malfunctions (failures and breakdowns) of hardware, software and data errors, personnel and users mistakes in standard operational conditions and working environment when maintenance and servicing parameters are specified.
IS consisting of many parts distributed over a large territory have much longer operational lifespan than general life cycle for computer technologies that is normally 5-7 years [13, 14]. For example, reviewed herein IS – Russian Federation Automated System “Vybory” and “Electronic archive for personal record keeping” of the Russian State Pension Fund –have been operating not less than 20 years [15].
2.1. Task setting for modelling of the methodology to assess effectiveness of distributed information systems
IS reliability assessment in a dynamic environment with the purpose of detection of vulnerable spots in terms of reliability will allow to identify beforehand the areas of possible failures. Besides, it will enable to make a targeted modernization of an IS, and, finally, to save money. Providing this, the task setting for IS reliability assessment method can be formulated as follows:
Given:
- The set of soft and hardware of an IS (TSSH) PT = { PTi }
- Parametric perturbations on the PT set in time t:
- ε(t) – reliability violation on the PT set,
- Requirements towards reliability parameters Τ = { ρT } on the PT set
Find:
- A set of reliability parameters assessment models PT : ρ
Solution:
- Make an IS reliability scheme.
- Develop a general reliability model for this scheme.
- Develop a reliability assessment method.
Supplementary notes:
Reliability can serve as a restriction for other IS quality parameters: availability, response time etc.
Within this task, we do not consider the issues of mass nodes failures of a distributed IS for reasons of catastrophic character.
2.2. The modelling of a reliability scheme for geographically distributed information systems
The development of reliability scheme is the key stage at effectiveness modelling in general and reliability modelling specifically. It is convenient to introduce a reliability scheme for hierarchical geographically distributed IS in the form of graph G(V, E), where V = { vi } is a set of reliability nodes vi. Every node consists of all soft and hardware stored on a certain closed territory (an office, a building, an organization). E = { ej } is a set of communication channels (СС) ej. Every element of the set E connects a couple of elements of the set V.
The development of a mathematical reliability assessment model by (network) graph is a difficult task. However, the majority of geographically distributed IS is designed hierarchically, which makes the task considerably easier.
Statement. Reliability scheme of a large hierarchical geographically distributed IS can be introduced in the form of a tree or a forest.
Let us consider an IS structure consisting of one central node and two regional nodes. Let us assume that CC ej have communication bandwidth of 4 Mb/s on the region- center level, 2 Mb/s between regions. The formed reliability graph is a network consisting of three nodes and three arcs (see fig.1). Let us assume that data processing power on vi nodes of the center-region graph correlates as 2:1 (proportionally to the number of lower-level nodes to one upper-level node). It is useless to make evenly powerful nodes because this will result in overspending at the development of an IS.
The use of Prim algorithm [15] to form a graph tree (in our case a maximum tree) with the starting vertex in the root of the tree (vertex Center) produces a spanning tree without region-region arc. Maximum tree is formed because there is a need to create communication channels that will guarantee implementation of timeliness restrictions at reliability assessment.
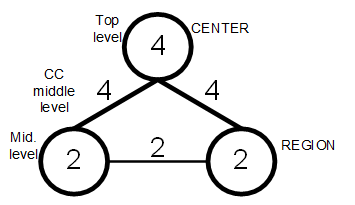 Figure 1. Reliability graph for basic two-level IS scheme
Increasing the number of levels in the IS hierarchy by one will produce an IS containing 3 levels of reliability nodes hierarchy vi: center, region, district. In this IS every region has two districts. Let us assume that CC ej have communication bandwidth of 4 Mb/s on the region-center level, 2 Mb/s on the district – region level, 1 Mb/s between districts of the same region, and 2 Mb/s between regions.
The formed reliability graph is a network consisting of seven nodes and nine arcs (see fig.2). Let us assume that data processing power on vi nodes of the center-region-district graph correlates as 4:2:1 (proportionally to the number of lower-level nodes to one upper-level node).
Using the same modified Prim algorithm [16] we produce a spanning graph tree without arcs region-region and district-district. Thus, we got the same result for a three-level scheme as for a two-level one (providing we take into account the restriction that CC between nodes of the same hierarchy level are less powerful than CC between nodes of different hierarchy levels).
By applying a mathematical induction method, i.e. increasing the number of levels by addition of child nodes to the leaf node (fig.2) it is possible to form more complex graphs and maximum trees for them.
Providing the above we can formulate the task for reliability scheme modelling in the form of a tree or a forest based on the IS graph scheme.
A graph describing the IS scheme G(V, E). Where V = { vi } is a set of IS reliability nodes . Every node vi = { TSSHik }, TSSHik is a certain set of soft and hardware of a node. E = { ej } is a weighted set of all communication channels (CC) ej. Every element of the set E connects a couple of elements of the set V. The weight of ej means CC communication bandwidth.
The set of tree-type reliability schemes Tr = { G’l(V, E’) }, where G’l(V, E’) is the maximum tree l, V = { vi } is the set of all reliability nodes vi. E’ = { ej } is the set of IS communication channels (CC) of the maximum total weight that does not form a cycle. Every element of the set E’ connects a couple of elements of the set V.
Restrictions:
- IS is hierarchically designed;
- The tree is formed by passing the arcs G(V, E) from the root to the leaves (downwards) with the ban to pass the arcs upwards along the tree.
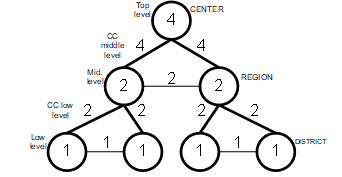 Figure 2. Reliability graph for a basic three-level IS scheme.
When a graph has a complex structure (see fig. 3), it may be difficult to locate a maximum tree (trees) because the use of classic Prim algorithm allows inclusion into the tree the arcs from lower levels to upper levels. This is possible, for example, when a starting vertex is Center 3 and there is no CC 5 (see fig.3). It is also possible to get a tree without arcs from vertex Center 3 to regions (see fig.3). Such solution will contradict the flow of main data in an IS.
For such cases, the Prim algorithm should be modified either by addition of the option allowing marking vertices in the data structure as non-visitable (e.g. in case of a failure) or the introduction into the algorithm of a vertex level label and a forced ban to consider arcs from lower to upper levels of the hierarchy (see fig.4).
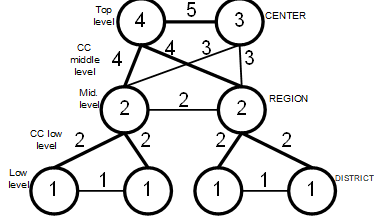 Figure 3. Reliability graph for a three-level IS scheme with 2 centers
If there is a backup data processing center for the central node (e.g. nodes Center 4 and 3 on fig. 3) then end-user processes are still addressing the same data copy at a time. Thus, the central node is considered as single (e.g. by combining vertexes Center 4 and 3 on fig. 3) but in the model it is necessary to consider its backup (e.g. in the basic case using the formula Kr.b. = 1 – (1 – Кr)n, where n is the number of backup nodes for which reliability is defined as Кr).
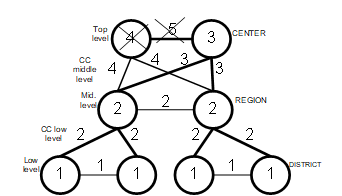 Figure 4. Reliability graph for a three-level IS scheme with two centers and the option to eliminate some vertices and arcs
If central nodes and communication channels have nominally the same processing power, it is possible to form several different trees if we choose different starting graph vertices, i.e. it is possible to form not a tree but a forest. Forming a forest does not significantly complicate the initial task. According to the reliability assessment model presented below it is necessary to make calculations by several trees and take the minimal assessment.
Forming one or several maximum trees (critical sections) in the general reliability graph is justified because the calculation and reliability scheme is much easier and there is no significant distortion of reliability assessment parameters.
Generally, for every tree (or section) of the initial reliability scheme there is a need to assess reliability according to the further suggested reliability assessment model and choose a minimal model. The complexity of reliability scheme algorithmic modelling depends on the number of vertices in every maximum tree and in general case is O(mn2), where n is the number of vertices in a tree, and m is a number of trees.
The authors suggested this approach after the analysis of application of reliability assessment methods for large geographically distributed IS [17].
2.3. General reliability assessment model
IS reliability model for vi nodes in general is formed based on the reliability scheme. Then, it is detailed for every vi node depending on available soft and hardware PTi = { PTij } of the vi node.
The general reliability model scheme for a three-level hierarchical distributed IS (see fig.2) is as follows [18]:
ρ = Кr IS = Кr t.l. ∑i=1Nm.l.(bi Кr cc m.l. i К r m.l. i (∑ j=1Nl.l.i aij Кr cc l.l. ij Кr l.l. ij))
where Кr t.l. – a reliability parameter for IS top-level objects (a non-detailed object reliability model for objects like data processing centers, central servers, software of central database etc.);
bi = Оbi / ∑i=1Nm.l.Оbi – the share of objects serviced by i– node of the middle level IS, Оbi – a number of reliability elements serviced by i-node of the middle level IS (∑i=1Nm.l.bi = 1);
Nm.l. – the number of elements of the middle level IS;
Кr cс m.l. i – TSSH CC reliability parameter between top and middle level;
Кr m.l. i –parameter of i-node reliability of the middle level IS;
aij= Оbij/∑j=1Nl.l.i Оbij – the share of objects serviced by j-node of the low level IS node connected with the middle level i (∑j=1N l.l.iaij = 1) against general number of low level objects connected with i-node of the middle level IS;
Nl.l.i – the number of low-level nodes connected with i-node of the middle level;
Кr cc l.l. ij – the TSSH CC reliability parameter of the middle level i-node – low level j-node;
Кr l.l. ij – the reliability parameter of the low level j-node connected with the middle level i-node.
A general model for reliability assessment is formed for availability parameter Кr (probability that the IS will be functioning at any given time), i.e. for a complex parameter for failure-free performance and recoverability of an IS. However, the choice of a reliability parameter is not crucial in this situation – the methodology shows how to design a reliability scheme, how to transform it into a tree (or a forest), how to form a reliability assessment model according to the scheme (schemes). Similarly, it is possible to form a reliability models for other parameters, such as:
- Operational availability parameter (Kor) is the probability that the object will be functioning at any given time t, apart from planned periods when the use of the object for its intended purpose is not required. Starting that moment the object will demonstrate failure-free performance for the set period.
- Technical use parameter (Кtu) is the ratio of expected value of intervals when the object is operationally available over a period of use to the sum of expected values of intervals when the object is available and idle due to technical maintenance or repairs over the same period of use.
- Planned use parameter (Кп) is a part of use period when the object must not be on planned maintenance or repair.
- Effectiveness parameter (Кef) is a ratio of the value of effectiveness parameter when the object is used for its intended purposes for a certain period of operation to the nominal value of this parameter calculated under the condition that the object failures does not happen over the same period. The effectiveness parameter specifies the influence of object failures on its effectiveness when used for its intended purposes.
The suggested model for reliability assessment allows by induction to increase or decrease the number of levels, by calculation of corresponding weighting factors and by addition of the next level standard reliability parameters sum. It should be noted that the failure of a node of any level equals to the failure of all its child nodes. This partly takes into account mass failures.
3. Reliability assessment methodology
Now that the mathematical reliability assessment model is developed, it is time to start modelling the methodology to ensure reliability. It should be started with the elaboration of the terms failure and crash for a certain system, the choice of reliability parameters (availability rate, probability of failure-free performance, operational availability rate).
For the purpose of this research, IS is considered as a complex geographically distributed multifunctional system. Thus, in addition to «Full availability» and «Total crash» states there are many intermediate states with different levels of availability and corresponding performance effectiveness.
The developed model allows defining an IS total crash state – a total system crash is possible at the failure of upper level object and/or failure of all middle level objects and/or all low level objects.
Partial IS failure – the failure of one middle level object, which equals to the failure of all lower level objects handled by this middle level sector of an IS.
3.1. Modelling the methodology for reliability assessment
Summing up the methodology modelling in three major projects (Russian State Automated System “Vybory” [15], Electronic archive for personal record keeping” of the Russian Pension Fund and management system for the concept «Smart City Skolkovo» [16]) we came to the conclusion that it is necessary to undertake the following steps to develop a quantitative reliability assessment methodology and make the actual assessment:
- Develop a reliability scheme in the form of a graph and detect one or several trees.
- For every formed tree develop a mathematical model for reliability assessment according to the presented above model specifying the number of node levels.
- Elaborate the terms for failure and crash of an IS according to its functionality. For example, the system failure is registered if function fi ϵ F cannot be executed for a period of time more than T minutes (seconds), where F is a set of functions, crucial to IS if not executed.
- Define the terms failure and crash according to the critical number of IS operating nodes. For example, the failure of an IS node is registered if less than N automated working stations (AWS) of an IS does not perform required functionality F for a period of time more than T minutes (seconds).
- Define reliability parameter (parameters), principles of failure and crash probability distributions, restrictions and assumptions at reliability assessment.
- Define the effect other IS have on the system reliability and adjust the mathematical model taking into account this effect.
- Develop the form and procedure for the collection of IS reliability statistics data, which include every node and element of IS scheme and reliability model.
- Collect statistic data on the nodes and reliability elements of the IS.
- It is recommended to develop mathematical models for reliability parameters, e.g. for timeliness and IS function execution, and the scheme for the use of these parameters at the system reliability assessment. For example, if at the current reliability rate timeliness is not sufficient, then the failure of a node or IS in general is registered. Thus, in the most general case reliability parameters serve as reliability model restrictions.
- Specify the general mathematical reliability model by every node and reliability element taking into account possibility of backup and influence of other parameters and systems.
- Calculate system reliability parameters taking into account restrictions (including timeliness and function execution). The calculations are made for every formed i-tree. Then a pessimistic approach is applied, i.e. Кr IS = min(Кr ISi) is chosen.
- Calculate reliability parameters according to the model described above for every node of every level of the reliability scheme.
- For reliability nodes for which there are no failure statistics calculate anticipated reliability as the lowest among the same calculated reliability nodes of an IS.
- If necessary, specify parameters calculations for every node or reliability element.
- At the end of the calculation make an IS “health chart”, i.e. IS scheme where risky nodes and reliability elements are marked.
- The overall risk and weaknesses chart used at the detailed reliability assessment is defined by detected critical nodes.
- If the risks are confirmed by the detailed assessment, it is necessary to develop an action plan to eliminate these risks.
3.2. Specifics of the interpretation of calculation results in the reliability model
Consider a more complex case. A distributed IS consists of several top level nodes, thus it is necessary to form a maximum tree for every vertex and calculate the assessment for every such tree.
As a result we have a set of assessments: Кr IS = { Кr ISi }.
In IS reliability assessment we apply a pessimistic approach, i.e. choose Кr IS = mini(Кr ISi).
The produced indicators both for IS in general and for every separate reliability node and element are compared against the reliability set Τ = { ρT } existing on the PT set.
Reliability assessment can be done quite fast with the use of the suggested method. And with the use of some software for calculations even faster. However, the assessment is not too accurate and can be used only for estimated rough calculations.
4. Modelling the effectiveness of distributed information systems
In order to assess effectiveness it is needed not only to model reliability but also develop models of other IS quality performance parameters.
The authors developed the following mathematical models of IS quality parameters for the assessment of IS effectiveness: IS availability and response time (timeliness). These models can be supplemented by IS reliability assessment models as additional restrictions.
4.1. The model for the assessment of IS functions performance availability
Here is the formal task formulation for the IS availability assessment by listed functions.
Given:
- Functionality volume F (total number of all IS operations by all operation types).
- Data volume D (total data volume stored in IS database).
- Restriction Fd (maximum admissible F value that allows to consider IS functional).
- Restriction Dd (maximum admissible D value that allows to consider IS functional).
- IS reliability (Кr).
Find:
Probability of availability of the minimum admissible IS functionality and data volume.
Solution:
Mathematical model of availability is the probability to perform IS operation s by a user:
Рp (F³Fd) = Р(F³Fd) Кr IS
And the probability of IS data availability to a user:
Рd (D³Dd) = Р(D³Dd) Кr IS
where Р(F³Fd) – the probability of performing functionality volume F, i.e. performing of IS functions not less than directly set (or admissible) Fd subject to failure-free performance of IS soft and hardware;
Р(D³Dd) – the probability of availability of data volume D not less than directly set (or admissible) Dd subject to failure-free performance of IS soft and hardware;
Кr IS – IS reliability indicator calculated according to the reliability assessment model (see above the general IS reliability assessment) that serves as a restriction of the model.
P(F³Fd)= ni / N(i),
where ni – the number of operation of i-type (see the list of operation types above) that satisfies the inequation F³Fd,
N(i) – the total number of operation of i-type performed in an IS at the collection and processing of information.
P(D³Dd)= d / D,
where d – the volume of available data,
D – total data volume in an IS.
Additional parameters specifying availability:
- Average percent of IS functions F availability over a period of T;
- Average percent of IS data D availability over a period T.
4.2. The model for the assessment of IS functions timeliness (response time)
Here is the formal task formulation for the IS timeliness assessment.
Given:
- Functionality volume F (total number of all IS operations by all operation types).
- Restriction Td (maximum admissible time value that provides an IS user with acceptable result of the IS function performance)
- IS reliability (Кr IS)
Find:
The probability of IS performance of its functionality in full over a period not less than maximum admissible time
Solution:
Mathematical model for timeliness is defined as the probability of information processing over a period of t that is not more than the set (admissible) Td, with reliability restriction:
Рt (t£Тd) = Р (t£Тd) Кr IS ,
where Р (t£Тd) – the probability of information processing during operations performance (the types of operations are listed in the first paragraph of the section) in an IS over a period of t that is mot more than the set (admissible) Тd subject to failure-free performance of soft and hardware;
Кr IS – IS availability indicator (see section 2.4).
In order to calculate all time intervals Т it is necessary to obtain statistics data and find admissible time Тd allowing to get the probability assessment of function timeliness.
Probability assessment of i-type function timeliness over a period not exceeding admissible is calculated by the following formula:
P(Тi£ Tdi)= ni/N(i)
where ni – the number of performed i-type operations Тi that satisfy the inequation Тi£Tdi;
N(i) – the number of operations of i-type from the set of operations F l=[1,N(i)].
5. Practical implementation of reliability assessment methodology
Effectiveness and reliability assessment methods developed according to the suggested by the authors methodology are described in [13, 18]. This methodology can be easily automated. For example, software complex for the assessment of effectiveness and reliability of the Russian Federation Automated System “Vybory” was created based on this methodology.
The suggested methodology formed the basis for the methods used by the Russian Federation Automated System “Vybory” and soft and hardware complex “Electronic archive for personal record keeping” of the Russian Federation Pension Fund. The calculations made according to the implemented methods revealed reliability bottlenecks in IS nodes, which allowed to make their targeted modernization.
Besides, the developed methodology was used at the development of the logic-mathematical model for Skolkovo “Smart city” management system concept for the Skolkovo Innovation center [17]. This allowed to design the management system with regard to reliability and effectiveness on the concept stage and set justified criteria for the selection of soft and hardware solutions at the detailed design stage.
6. Comparison with other approaches and model restrictions
First researches on the reliability assessment of distributed systems were focused on the solution of individual tasks – assessment of mistakes at data transfer or instability of communication channels bandwidth between IS nodes [19],[20]. Engineering approach and special set of tools to assess IS reliability is described in [5] и [6].
The most detailed IS effectiveness assessment model that takes into account not only the quality of the system itself but also the data circulating in it, user experience and other business-oriented parameters is D&M IS Success Model [7]. According to classification [7] the described model assess only technical aspect of the system performance and is similar to approaches based on IS architecture assessment [20], [21]. It can be used along with D&M IS Success Model and supplement it with regard to geographically distributed systems.
Another possible application of the suggested method is its use with IS effectiveness assessment models based on machine learning and data analyses [22]. During machine learning the reliability scheme in force (or any other parameter of IS effectiveness) is adjusted and used for the presentation of the current situation and fast calculation of IS effectiveness parameters.
The majority of researches focuses on “reliability of data” circulating in the system (a process approach) [23] or on failure probability [24] not taking into account architecture specifics of the assessed IS.
The most recent researches on the reliability assessment of distributed systems are mainly based on the use of Markov chains [2], [25] that allow to understand the correlation between the states of different system components, define bottlenecks of a small distributed system. However, it does not allow to get a clear IS reliability assessment comprising over 100 nodes in a dynamic state.
In section 1.2 it is demonstrated that reliability scheme modelling with the use of Prim algorithm is applied for hierarchical systems. The same approach may be employed in the non-hierarchical systems. To do so it is needed to locate one or several central nodes and form the reliability scheme for each of them.
It should be noted that the suggested model does not take into account some important parameters, e.g. it does not cover the issue of data deterioration at the reliability assessment [26] that in future could be considered at the development of reliability scheme or any other parameter of IS effectiveness. A simplified description of the mathematical model was presented in the suggested methodology.
7. Conclusion
This article describes methodology for modelling IS effectiveness that was brought up to the level of applied operational methods that were implemented during the development of the major federal level information systems: the Russian Federation State Automated System “Vybory”, “Electronic archive for personal record keeping” of the Russian Federation Pension Fund, Skolkovo “Smart city” concept, which is undoubtedly the advantage of this work.
Another advantage of the developed mathematical model is that it takes into consideration a geographically distributed architecture of an IS and has a great potential for extensibility into more complex distributed IS configuration.
In further studies, it is planned to improve Prim algorithm convergence at the formation of critical sections (maximum trees of the reliability scheme), to develop a method for specification of nodes reliability models of the reliability scheme and its automatization with the help of specialized software, to develop a methodology to model other IS quality parameters such as adaptability, resistance to external actions (including actions of catastrophic character).
We plan to develop the software allowing to improve the reliability scheme calculation of certain nodes and elaborate modelling methodology for such effectiveness parameters as adaptability and disaster recovery. The focus of the research will be on the analysis of Prim algorithm convergence at the calculation of several maximum trees.
Conflict of Interest
The authors declare no conflict of interest.
- L. F. Pitt, R. T. Watson, C. B. Kavan “Service quality: a measure of information systems effectiveness” MIS quarterly, 173-187, 1995. https://doi.org/10.2307/249687
- A. Waseem, Y.W. Wu “A survey on reliability in distributed systems” Journal of Computer and System Sciences, No. 79.8., 1243-1255, 2013
- F. M. Zahedi “Reliability metric for information systems based on customer requirements” International Journal of Quality & Reliability Management 14.8, P. 791-813, 1997. https://doi.org/10.1108/02656719710181312
- GOST 34.003-90 Informacionnaja tehnologija. Kompleks standartov na avtomatizirovannye sistemy. Avtomatizirovannye sistemy. Terminy i opredelenija, M.: Izd-vo standartov., 1992.
- M. C. Boudreau, D. Gefen, D.W. Straub “Validation in information systems research: a state-of-the-art assessment” MIS quarterly, 1-16, 2001. https://doi.org/10.2307/3250956
- P.K. Kapoor, H. Pham, A. Gupta, P.C. Jha “Software reliability assessment with OR applications” Springer, London, 2011.
- W. H. Delone, E. R. McLean “The DeLone and McLean model of information systems success: a ten-year update” Journal of management information systems. No. 19(4). 9-30, 2003. https://doi.org/10.1080/07421222.2003.11045748
- X. Lu, K. Moriyama, I Luque., M. Kanda, Y. Jiang, R.Takanuki, K. Mori “Timeliness and reliability oriented autonomous network-based information services integration in multi-agent systems” IEICE TRANSACTIONS on Information and Systems. No. 88(9), 2089-2097, 2005. https://doi.org/10.1093/ietisy/e88-d.9.2089
- A. Bangor, P. T. Kortum, J. T. Miller “An empirical evaluation of the system usability scale” Intl. Journal of Human–Computer Interaction. No. 24 (6), 574-594, 2008. https://doi.org/10.1080/10447310802205776
- M. Nancy, T. Stehney “Security quality requirements engineering (SQUARE) methodology” ACM SIGSOFT Software Engineering Notes. Vol. 30. No. 4. 2005. https://doi.org/10.1145/1082983.1083214
- Akimova G. P., Solovyev A. V., Tarkhanov I. A., Reliability assessment method for geographically distributed information systems // 2018 IEEE 12th International Conference on Application of Information and Communication Technologies (AICT), Almaty, Kazakhstan, 2018, pp. 1-4., https://doi.org/10.1109/ICAICT.2018.8747055
- GOST 27.002-89. “Reliability in technology. Basic concepts. Terms and Definitions“, M.: Publishing Standards, 1989.
- P. Stafford “You can believe the Hype Cycle’s take on technology” Financial Times. 30 May 2008.
- B. Furneaux, M. R. Wade “An exploration of organizational level information systems discontinuance intentions”, Mis Quarterly, 573-598, 2011. https://doi.org/10.2307/23042797
- G. P. Akimova, E.V. Pashkina, A. V. Soloviev “Analiz ocenki jeffektivnosti ierarhicheskoj territorial’no-raspredelennoj informacionnoj sistemy na primere GAS “Vybory“ Proceedings of the Institute of System Analysis of the Russian Academy of Sciences, vol. 58, 25-38, 2010.
- T. H. Cormen, C. E. Leiserson, R. L. Rivest, C. Stein “Introduction to Algorithms“ Third Edition. MIT Press. ISBN 0-262-03384-4. Section 23.2: The algorithms of Kruskal and Prim, 631–663, 2009.
- A.V. Soloviev, Concept «Umnyj gorod Skolkovo» for Skolkovo innovation center and set of measures for its implementation. Vol 3. Logiko-matematicheskaja model’ «Umnogo goroda»: research report. ISA RAN. 2012.
- A. V. Soloviev, E.Y. Komleva, “Metodicheskoe obespechenie nadezhnosti v oblasti hranenija jelektronnyh dokumentov” Proceedings of the XXIII International Conference “Documentation in the Information Society: Archival Studies and Documentation in the Modern World”, Rosarchive, , 321-331, 2017.
- F. Proschan, R. E. Barlow “Mathematical theory of reliability.” SIAM series in applied mathematics. 1967.
- L. Svobodova “Reliability issues in distributed information processing systems” Dig. Papers FTCS-9: 9th Annu. Symp. Fault-Tolerant Computing. 1979.
- K. Goševa-Popstojanova, S. T. Kishor “Architecture-based approach to reliability assessment of software systems” Performance Evaluation. No. 45.2-3. 179-204. 2001. https://doi.org/10.1016/s0166-5316(01)00034-7
- N. P. L. Ernawatiningsih, P. Kepramareni,, “Effectiveness of Accounting Information Systems and the Affecting Factors” International Journal of Applied Business and International Management, 4(2), 33-40, 2019 https://doi.org/10.32535/ijabim.v4i2.564
- R. Krishnan, J. Peters, R. Padman, D. Kaplan “On data reliability assessment in accounting information systems” Information Systems Research. No. 16(3). 307-326, 2005. https://doi.org/10.1287/isre.1050.0063
- A. Choudhary, A.S Baghel., O.P. Sangwan “Parameter Estimation of Software Reliability Model Using Firefly Optimization” Data Engineering and Intelligent Computing. Springer. Singapore, 407-415, 2018. https://doi.org/10.1007/978-981-10-3223-3_39
- Z. Zheng “Semi-markov models of composite web services for their performance, reliability and bottlenecks” IEEE Transactions on Services Computing, No. 10.3, 448-460, 2017. https://doi.org/10.1109/tsc.2015.2475957
- J. Xu, D. Yu, Q. Hu, M. Xie “A reliability assessment approach for systems with heterogeneous component information” Quality Engineering, 1-11, 18.12.2017. https://doi.org/10.1080/08982112.2017.1402935