
The Financial Services Authority of Indonesia E-Reporting System Development Based on Metadata XBRL Taxonomy
Volume 5, Issue 1, Page No 58-70, 2020
Author’s Name: Rachmad Farizd1,a), Suharjito2
View Affiliations
1Computer Science Department, Binus Graduate Program – Master of Computer Science, Bina Nusantara University, Jakarta, Indonesia 11480,
2Computer Science Department, Binus Online Learning, Bina Nusantara University, Jakarta, Indonesia 11480
a)Author to whom correspondence should be addressed. E-mail: rachmad.farizd@gmail.co.id
Adv. Sci. Technol. Eng. Syst. J. 5(1), 58-70 (2020); ![]() DOI: 10.25046/aj050108
DOI: 10.25046/aj050108
Keywords: XBRL Taxonomy, Accounting Information System, Otoritas Jasa Keuangan (OJK)

Export Citations
The XBRL taxonomy has been proven to be able to restore various forms of redundancies and ambiguities in making financial reports from financial service institutions. However, the nature of XBRL which is oriented towards documents and based on XML makes the XBRL taxonomy difficult to use because the information cannot be directly read by ordinary users. The same obstacle was felt by the Financial Services Authority of Indonesia (Indonesian: Otoritas Jasa Keuangan or OJK) as financial regulator in utilizing the XBRL taxonomy, therefore a web-based application system called E-Reporting was developed to input financial statements conducted from financial service institutions to the regulator. The core of the application system is the XBRL taxonomy reading and mapping function, utilizing the Java library for reading XML and the Spring Java framework as a system backend, the Zkoss framework as the system frontend, and the database for storing data and specifically developed for the needs of the OJK. The purpose of this paper is to show other ways of implementing XBRL taxonomy, one of which is to present XBRL into a dynamic user interface according to the dynamic and flexible nature of XBRL. The results of the system evaluation indicate that the system is quite good at presenting the taxonomy into a user interface that suits the needs and can ease the burden of data validation, as well as providing convenience in forming the instance document, which is needed as the final result of the reporting process carried out by financial service institutions. Therefore, this system has been proven to provide added value in the use of XBRL taxonomy in financial reporting activities.
Received: 19 October 2019, Accepted: 08 January 2020, Published Online: 15 January 2020
1. Introduction
The Financial Services Authority of Indonesia (Indonesian: Otoritas Jasa Keuangan or OJK) has the main duties governed by the law, namely in the field of supervision, monitoring, and decision-making. OJK establishes a one-stop integrated financial reporting policy as an accountability report for the financial services sector (SJK) so that a single point of contact can be realized for financial reporting from all financial services institutions (LJK). This reporting is based on metadata using the eXtensible Business Reporting Language (XBRL) taxonomy methodology so that the definition and reporting format for data uniformity is achieved, see [1]. The goal is to be able to reduce all forms of ambiguity and redundancy and facilitate the exchange and analysis of data that can have an impact on the quality of data that is useful in the decision-making process, see [2]. Although it is possible that the tag in the XBRL taxonomy is given incorrectly in financial terms, and allows the use of inconsistent standards, see [3].
OJK also has special attention to the weaknesses of document-oriented and XML-based XBRL. Making it difficult to exploit, process, adjust, search and retrieve data from a large set of XBRL files, even for tools that provide XML-based functionality, see [4] and [5]. Also, the process of manually retrieving and tagging data will spend hours and increase costs related to XBRL utilization, see [6, 7]. To overcome this weakness and facilitate the implementation of metadata-based reporting, a system was built as a pilot project in the reporting of the Financing Company (Indonesian: Perusahaan Pembiayaan or PP) called the SIPP client tool. This system is a substitute for taxonomy so that the process of data retrieval and tagging can be done automatically then create XBRL instance documents that will be sent by LJK to OJK, so the taxonomy itself is only used as a reference as the formation of XBRL instances. This system has the following weaknesses and disadvantages:
- The system cannot follow the extensible nature of XBRL’s taxonomy, which can be expanded and adapted to various variations and report requirements, see [8]. When there is a new version or an update from an existing version of the XBRL taxonomy owned by OJK, the system must be rebuilt and then distributed to LJK because the system is a standalone application.
- The input data validation process in the OJK client application is now in the form of a separate small application so that the input data must be re-validated on the client application in the LJK and the server in the OJK, so it is ineffective and inefficient.
- Large instance documents cannot be accommodated using a client application so that it can hamper the reporting process because it must be sent directly to OJK.
- Having the risk of financial information from the reporter being stolen because documents are sent through the internet network.
The implementation of the XBRL taxonomy in the SIPP client tool system is not optimal with these weaknesses and makes the vision and mission of the OJK unreachable in terms of reporting. The purpose of this research is to obtain and develop a replacement system to overcome the various weaknesses of the XBRL taxonomy mentioned earlier so that this metadata-based financial reporting can be applied throughout the FSS in the future. It is hoped that this new system can add value in the use of XBRL in terms of flexibility, efficiency, and security in the use of XBRL taxonomy in financial reporting from LJK to OJK.
2. Literature Review
All accounting information must be able to be issued clearly and effectively in digital form so that it can leave the traditional processes that are heavily exposed to human intervention. This is one of the obstacles and shortcomings of the use of XBRL for ordinary people because of the XBRL nature which is oriented towards documents and is based on XML, see [4]. The low level of understanding and knowledge of XBRL among accountants and other relevant stakeholders is also a significant problem as in [9]. The fact is that some respondents found refusing to use this new technology and the lack of application technology related software development to accommodate the use of XBRL, besides that the government also had to produce more training courses for entrepreneurs, see [10, 11].
There are several studies conducted to overcome the weaknesses in XBRL, thereby maximizing the implementation and adoption of XBRL. One of them is research by translating the XBRL format into Ontology Web Language (OWL) with the semantic web, the aim is to eliminate the possibility of redundancy and improve consistency so that conclusions can be drawn quickly and useful for business decisions of companies or organizations, see [5, 12]. Charles Hoffman also considers the semantic web to have many logical possibilities for the development of information technology so that it can produce more value, see [13]. The results are considered better in providing semantic data for XBRL, compared to previous research conducted by Garcia and Gil which presents a mapping based on structural transformation from XML to RDF (Resource Description Framework) and OWL, see [14]. However, OWL is not a language that can be directly used by business and financial people and not even for IT staff, besides OWL is designed only for special purposes so that the support of tools and expertise is minimal, see [15]. Table 1 is an example of the XBRL element transformation with the monetaryItemType data type to OWL.
Table 1 : Transformation of XBRL into OWL
| Language | Transformation |
| XBRL |
<element id=”currentLoans” name =”currentLoans” type = xbrli:monetaryItemType xbrli:balance =”credit” substitutionGroup = “xbrli:item”> </ element > |
| OWL |
Declaration (Class ( ex:currentLoans )) SubClassOf (ex:currentAssets xbrlo:monetaryItemType ) SubClassOf ( ex:currentAssets xbrlo:credit ) |
Other research related to the development of portable open-source software, named Arelle to facilitate the reading of XBRL instances. The initial goal is to meet the need for devices that can parse and validate XBRL instance documents and support document versions. Arelle is an independent platform, developed entirely from scratch in Python. Using the MVC (Model-View-Controller) architecture, where the Model as a representation of XBRL objects, the Controller as a representation of interaction from users and program control from outside, and the View representation of the API interactions that were defined earlier with the Model to display the interface, see [16].
There is patent related to the development of systems and methods for processing, presenting, and mapping XBRL data to a set of flat tables, where each table represents a single hypercube projection. The aim is to maintain the very flexible nature of XBRL, and almost every entity that uses XBRL for reporting can extend the standard taxonomy to adjust its use to suit the needs of a particular entity. Because, this flexibility and adjustments can make it difficult to see data encapsulated in XBRL instance documents. The concept is to map XBRL data so that it can be mapped automatically back and forth between XBRL instances, by generating a set of flat tables automatically, where each table represents a single hypercube projection, see [17].
Other research related to the discussion and evaluation of the development of “XBRL-Passport” (Pilot Athens stock exchange’s Statements Source Portal). This prototype was built as a smart solution for clients, because of the long process and various formats of collecting and analyzing financial data from various sources, thus making companies have to spend more consistency costs, see [18]. The prototype architecture consists of 3 simple layers, namely: the database layer with MySQL, the logic layer with PHP, and the application layer using the web. Because XBRL data is embedded in various types of files such as XBRL, HTML, Excel, XML, or text, and the limitations of web applications for parsing the XBRL format, makes the information displayed in HTML format uses XBRL schemes rather than XBRL based. The initial targets of developing this prototype are:
- Provision of financial data storage locations from companies listed on the ASE (Athens Stock Exchange), by first being converted to XBRL.
- Make data relevant and ready to be analyzed.
- For companies with the same sector, comparisons can be made.
XBRL will not change the current operational standards and financial conditions or also significantly improve the quality of the company’s financial statements. Companies may not get many benefits from implementing XBRL, even companies can spend more money to implement XBRL. But with XBRL it is possible to exchange financial information from a variety of different software platforms, see [7]. The requirements of a successful XBRL application are: (1) the specifications and taxonomies must be suitable for many companies, (2) application programs are similar to software that is currently widely used by accounting within companies, (3) can transfer information to specific forms were required by users. In [7], there are several reasons for implementing XBRL that can make companies spend more money:
- During the process of collecting, processing, and transferring, and investigating information requires a lot of money, see [19].
- Incomplete and misleading information releases can result in latency litigation costs (AICPA, 1976).
- By releasing information, the company can lose its competitive advantage, see [20].
- Companies can spend large funds to comply with regulations issued by the relevant government, and to ensure that information can be released or not, the company can re-issue costs, see [20].
3. Method
This study adopted the design science research (DSR) schema to describe the research design. The DSR framework can contribute to new knowledge when new solutions are proposed for known problems as seen in previous researches [21, 22]. The contribution of this study is the method of reading from the related XBRL taxonomy, then displaying it in another form of GUI that is flexible following the nature of XBRL. This research presents the development of a prototype system in the following steps: (1) gathering information related to the application of XBRL on an existing system; (2) uses information related to application to develop a process for reading taxonomies systematically; (3) changing the results of the XBRL taxonomy reading into a dataset that is ready to be transformed into an input form; (4) creating a dataset of links between data and tags from the related taxonomic schemes; and (5) output in the form of instance documents according to rules and needs.
System development will be carried out with the Agile methodology, which is a development methodology based on iterative development where requirements and solutions develop through collaboration between teams as in [23], to speed up the process and intensely involve stakeholders. The initial development was to create a function to reading and mapping the XBRL dictionary as the core system, and then save them into a function in the Java class. Facilitate the process of reading taxonomies and presenting taxonomy in the form of a GUI without having to make a special transformation into another form. Furthermore, the collection of information related to the system is done by observing the reporting process in OJK and conducting interviews with stakeholders in OJK. The data and information obtained will then be used as a reference and as input for the analysis process of the business needs and information expected by the OJK and the result will be a user and system specification document.
The design will use the help of UML (Unified Modeling Language) as a modeling tool commonly used to determine or describe a software system with objects, see [24]. The development of this system uses a web-based application architecture consisting of 3 simple layers: (1) the database layer, (2) the logic layer, (3) the presentation layer. Web application design will use the MVC (Model-View-Controller) pattern, making it easier for teamwork and workloads, because it separates the code into layers of presentation, logic, and data access. Separating the program code into 3 categories will make it easier to manage and read when there are parts of the code that need to be tested, improved, and modified, see [25].
After the system has been developed, it will then be tested using the User Acceptance Test (UAT), which is considered important and suitable for testing agile-developed software that allows visibility and improves communication and feedback to developers from end-user perspective or other stakeholder, see [26, 27]. This acceptance test can be sure whether these functions are acceptable to each other correctly, and the end of the test is carried out at the point between the completion of the development and the release system [28]. The UAT type used is Black Box Testing [29], by dividing it into 2 parts, first on the authorization side and the other on functional.
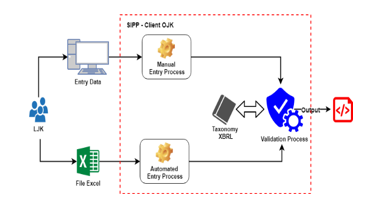 Figure 1: SIPP Client Current Process
4. Analysis and Results
4.1. OJK E-Reporting System
Figure 1 shows the implementation of the XBRL taxonomy in the SIPP client tool system which is not optimal as mentioned in the introduction. After the SIPP client system generates instance documents, LJK needs to send or upload the instance documents to OJK’s Integrated Reporting System (SILARAS) for later validation. If the report passes the validation process, the document will be saved to the OJK file server, and if it is invalid then it will be rejected. The process of SILARAS can be seen in Figure 2.
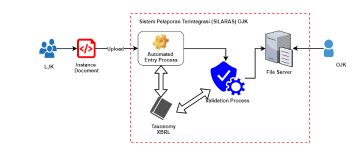 Figure 2: SILARAS Current Process
OJK’s E-Reporting System is a web-based application system that has the main function is to read and map OJK’s XBRL taxonomy for financial reporting conducted by LJK to OJK. The results of this taxonomy reading and mapping will be converted into GUI input forms that will be easier for reporters to use, even for users who are not familiar with XML and XBRL because they will no longer deal with XBRL taxonomy or XML formats. The system makes the validation process more efficient from the client side because the form that is displayed already has validation related to the input limits of each item that is converted into a component in the GUI form. Also, automation of creating report documents (instances) as output following general XBRL rules.
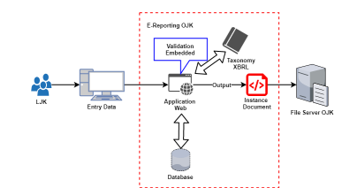 Figure 3: OJK E-Reporting system architecture
The focus of the discussion is how the system can read and map the taxonomy then present it into an input form for reporting and create an instance document as the result of the system. Also, the role of the validation process will be divided between LJK (client) and OJK (server) so that the validation process does not become redundant and more efficient in time and resources. Another plus is that all data inputted and instance documents have been stored on the OJK server so that the LJK does not need to upload instance documents which are usually quite large and take a long time and can increase the security aspects of financial information of LJK as the reporter as shown in Figure 3.
With instance documents already contained in the OJK file server, LJK does not need to send them to the SILARAS application. OJK only needs to select the instance documents that need validation, and the validation is only related to formulas as shown in Figure 4.
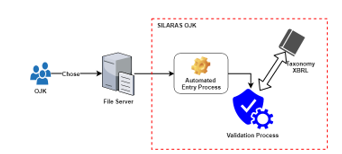 Figure 4: Architectural design application SILARAS OJK
The system architecture will consist of 3 simple layers: the database layer will use the MSSQL Server 2012 database, the logic layer uses the Java programming language with the Spring framework, and the presentation or user interface layer uses the Zkoss framework. Java was chosen because it has a complete library that can be used for reading XBRL taxonomies based on XML, although not specifically for XBRL taxonomies, so there is no need to convert to OWL or RDF as in existing research on semantic web [5, 12, 13]. Zkoss was chosen because it has been proven from several application system developments conducted by the author, it can present and support dynamic user interfaces according to system requirements. Also, Java and Zkoss have been used by OJK in developing application systems as well. The XBRL taxonomy architecture used is existing and standard used by the OJK with a folder hierarchy and the naming of the taxonomies determined by the OJK according to their needs.
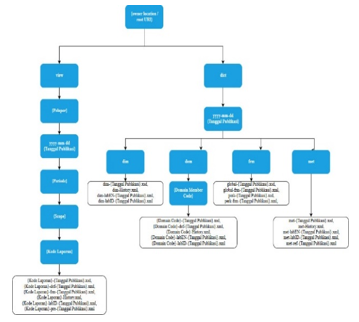 Figure 5: The folder and file structure of the OJK XBRL taxonomy
4.2. Root XBRL Taxonomy of OJK
The root (aloc) is the prefix of the address or location of the XBRL file, even though the file is actually in a local folder on the server computer commonly referred to as a rewrite URL. Aloc contained within the taxonomy framework used by OJK in each file are: http://xbrl.ojk.go.id/taxonomy/.
4.3. OJK Taxonomy Folder and File Structure
OJK has established a folder structure and component framework to facilitate the design and grouping of taxonomies used in financial reporting by LJK to OJK. Under the root folder, there are 2 main folders, namely ‘dict’ and ‘view’ as shown in Figure 5.
- The ‘dict’ folder, also known as a dictionary, contains all the entities, dimensions/axes, and domains needed for all groups of information. The modeling uses Data Point Model (s) (DPM) published by The European Banking Authority (EBA). In the dictionary there are metrics (met), dimensions (dim), and domain (dom) which are grouped into the release date folder as shown in Figure 5.
- The ‘view’ folder contains the main schema file that was first read, and there are several folder hierarchies intended to help classify the report. In the OJK, the classification or report categories are divided into reporters, publication date, period, and scope for each report as shown in Figure 6, with reading patterns:
{root URL}/view/{reporter}/{publication date}/{period}/{scope}/{report code}/{file name}
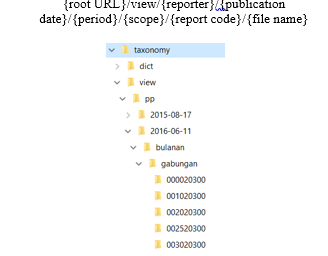 Figure 6: The structure of the view folder on OJK’s taxonomy
4.4. Core Process in OJK’s E-Reporting System
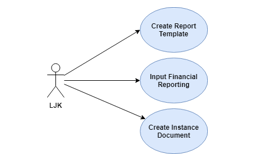 Figure 7: Use case in OJK’s E-Reporting system
In the E-Reporting system there are 3 main entities that users (LJK) do to the system related to the XBRL taxonomy as shown in Figure 7.
- Creating a report template.
- Fill out the report.
- Creating instance documents.
Furthermore, all these entities will become the core processes in the OJK E-Reporting system related to the XBRL taxonomy as shown in Figure 8.
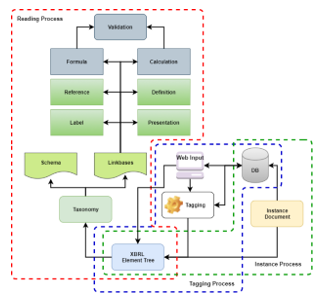 Figure 8: The core process in the OJK E-Reporting system
4.5. Taxonomy Reading and Presentation Process
 Figure 9: Taxonomy reading and transformation process in the OJK E-Reporting system
In Figure 9, the components of the taxonomy are divided into two, namely the schema and linkbase. Schema is part of the taxonomy that defines the items that will be used in reporting, along with the type, and data structure of information. Whereas linkbase is a logical expression of the relationships and relationships between items and the standards that govern it and information specifically related to the scheme. In the reading process, the schema which is the main structure of the taxonomy is stored in a file with the xsd extension. The schema in the view folder is the first file to read, with the pattern as explained before. The naming of this schema file has a naming pattern:
{Report Code}-{Date Version}.xsd.
Schema file contains metadata elements related to the report, the element is part of the taxonomy that contains items and other data related to the items that are linked by linkbase as shown in Figure 10.
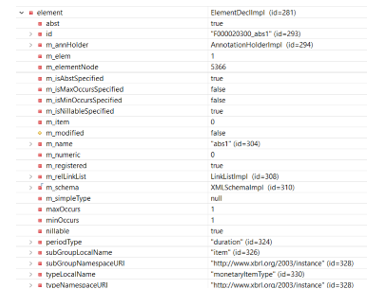 Figure 10: The results of reading the taxonomy elements in the OJK E-Reporting system
In the process of reading and mapping taxonomy XBRL, the system will read directly the elements of the taxonomy selected, but not converted into OWL or RDF as previous research. In the system already available Java class to accommodate the results of taxonomic readings, the reading and mapping process can be faster than having to convert it first into other forms. In general, the reading of the taxonomy carried out by the system for the relationship between documents can be seen in Figure 11.
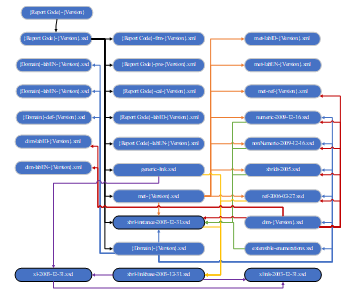 Figure 11: Relationships between files in taxonomy in general
To support the process of reading taxonomies and storing report template data, a data model was made to support the implementation of taxonomies in the OJK as shown in Figure 12. Information stored in XBRL documents cannot be accessed easily for safe and scalable queries and analyzes. So sometimes companies make two copies of data that have the same information, and one of them is stored in a relational database other than the XBRL document itself [30].
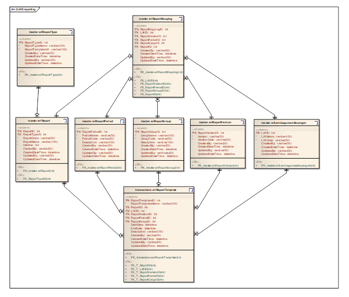 Figure 12: Data model for OJK E-Reporting system
The user must first create a report template based on the taxonomy associated with the report. The reports in OJK are grouped into several criteria and become a folder structure within the taxonomic storage folder as explained in the folder structure points above. This is intended to facilitate the user in viewing the report history or create adjustments to the data if needed. The draft input form of the report template as shown in Figure 13, will then be displayed entirely in the report template list module in the system as shown in Figure 12.
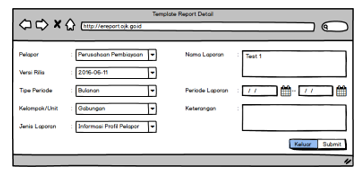 Figure 13: Design input forms for report templates in the OJK E-Reporting system
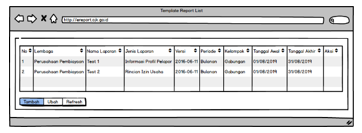 Figure 14: Design list of report templates in the OJK E-Reporting system
In the first part of the schema reading, you will find a namespace with a prefix representing it. The namespace in XBRL is no different from what is understood in XML, namely the naming mechanism that uniquely groups elements and attributes. In the system, the namespace will always be carried as a reference in the creation of an output report document (instance). In Table 2, you can see a list of common namespaces used in the XBRL taxonomy at OJK.
Table 2: The namespace contained in OJK’s XBRL taxonomy
| Prefix | Namespace |
| Xsd | http://www.w3.org/2001/XMLSchema |
| Gen | http://xbrl.org/2008/generic |
| Ref | http://www.xbrl.org/2006/ref |
| Xbrldt | http://xbrl.org/2005/xbrldt |
| Nomnum | http://www.xbrl.org/dtr/type/non-numeric |
| Xl | http://www.xbrl.org/2003/XLink |
| Link | http://www.xbrl.org/2003/linkbase |
| Num | http://www.xbrl.org/dtr/type/numeric |
| Xlink | http://www.w3.org/1999/xlink |
| Enum | http://xbrl.org/PR/2014-03-26/extensible-enumerations |
| Xbrli | http://www.xbrl.org/2003/instance |
| Xsi | http://www.w3.org/2001/XMLSchema-instance |
| iso4217 | http://www.xbrl.org/2003/iso4217 |
| variable | http://xbrl.org/2008/variable |
| F{Kode_Laporan} | http://xbrl.ojk.go.id/taxonomy/F{Kode_Laporan} |
Besides that, in the scheme there are also public elements, which are other concepts of the model represented by codes that are within a certain scope and can provide additional information from key elements such as readable label information, the definition of elements, and references other legal in languages that might be different. Information regarding this resource is generally marked as XLink and represented as an XBRL item, as shown in Figure 15.
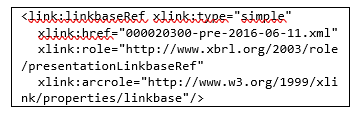 Figure 15: Examples of public elements in the OJK XBRL taxonomy
All resources will have their respective roles following the reference linkbase, also can have their own rules. Besides, the different roles make it possible to apply the Codification itself to present the resource, for example for label resources, the code is ‘lab’, while for the resource definition is ‘def’, and for the presentation is ‘pre’. More complete coding of the linkbase in the OJK taxonomy can be seen in Table 3.
Table 3: Naming on linkbase in the OJK XBRL taxonomy
| Linkbase | Name |
| Label | [report code]-lab[lang]-[version date].xml |
| Presentation | [report code]-pre-[version date].xml |
| Reference | [report code]-ref-[version date].xml |
| Calculation | [report code]-cal-[version date].xml |
| Formula | [report code]-frm-[version date].xml |
Reading the schema will produce elements along with additional information contained in the schema. Then the author tries to simplify the reading of elements, and compile them into a hierarchy with the key in the form of the unique identity of the elements so that it is easy to read and transformed into an input form in the system, henceforth the authors refer to a set of data from these elements into node elements. Examples of node element hierarchies for reading taxonomy schema can be seen in Figure 16.
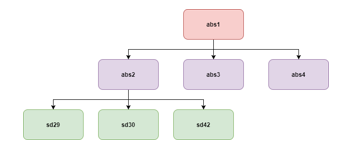 Figure 16: Examples of tree elements from taxonomic reading
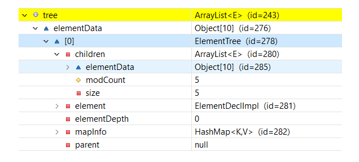 Figure 17: Example of element node results on the OJK E-Reporting system
As shown in Figure 17, at each node the element will have the same attribute property but with different values according to the role. In the reading of the scheme will be divided into 2 (two) types, namely items and tuples. Items do not have nodes underneath, whereas tuples can have one or more items underneath. For example, abs1 is an absolute element that indicates that this node is a tuple and has other derived elements in it. Properties inside the node can be seen in Table 4.
Table 4: Attributes on element nodes
| Attribute | Description |
| Children | List of nodes that are 1 level below |
| Element | The XBRL metadata is specific to the node |
| MapInfo | Summary of information from element that are often read and used in the presentation process |
| Parent | Summary of information from nodes that are 1 level above |
In this presentation process, only the ‘Children’ and ‘MapInfo’ attributes are read because these 2 attributes are sufficient to have the information needed to transform the taxonomy schema that has been read into an input user interface in the system. If an element has a derivative or is an absolute node, then it can be certain that it is an information group or tuple. The process will sort elements that do not have children and are not tuples to be transformed into input components in the form to be displayed. The type of input will be different according to the type of the element, and the different and need special treatment is the type of enumeration element, because this type of element will look to a related domain. The types of elements and components used can be seen in Table 5, while the conversion process is shown in Figure 18.
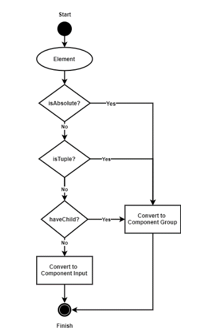 Figure 18: Flow conversion of elements into GUI components on the OJK E-Reporting system
Table 5: Conversion of elements into GUI components
| Type Data | Component Input Type |
| monetary | Integerbox |
| decimal | Integerbox |
| integer | Integerbox |
| date | Datebox |
| time | Timebox |
| string | Textbox |
| enumeration | Combobox |
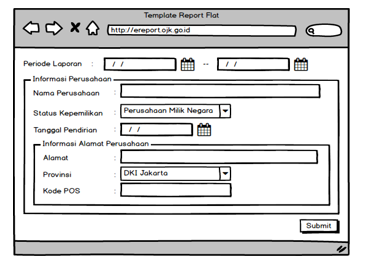 Figure 19: Flat type input form on OJK E-Reporting
For the user interface on the input form, the appearance is different for each type of form (flat, tuple, and nested tuple). Flat type will display a form like most simple input forms where there are labels and component inputs that accommodate data input such as text, date, number, and others. Example of the results of converting taxonomy items with flat type into a user interface component that will be displayed, it can be seen as shown in Figure 19.
For other types of input forms, they will be presented as data tables as shown in Figure 20. The form details will appear as popups if data is added or changed, and the shape is the same as flat types.
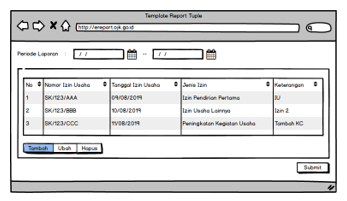 Figure 20: Tuple and nested tuple data input form types on the OJK E-Reporting system
Inside ‘MapInfo’ there is some information such as identity, label, and constraints such as maximum length, format, and what can be input into the component. All this information is in the XBRL results from the reading. With this limitation already embedded in the input form component so that the validation process becomes lighter, for example in the input component with a numeric type, the characters that can be inputted only in the form of digits with a digit length are following the taxonomy reading results. So that this presentation process has fulfilled the dynamic requirements of the user interface and validation of input components.
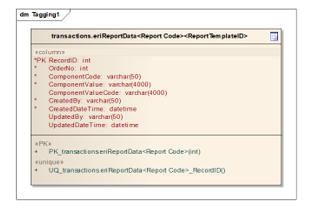 Figure 21: Data model for the results of data tagging on the OJK E-Reporting system
4.6. Data tagging process
The tagging process only stores the values of the input components on the form with the element id. The difficulty is to provide a data model that can accommodate all types of forms and support any changes that exist, both the addition and subtraction of elements from the taxonomy. For this reason, a data model design has been made that can accommodate existing needs, from the flat, tuple, and nested tuple form types having the data model scheme as shown in Figure 21.
The database table is contained in the transaction table data schema and will be created automatically for each report template created when the taxonomy for the template is read, making it easier and faster to query data tagging because data queries go directly to specific tables for data- data related to the financial statement template created. The table name will have a pattern:
transactions.eriReportData<Report_Code><Report_Tmpl_ID>
Although the taxonomy will change in the future, this data model will not be affected because the system will only synchronize the tagging data only because the main orientation of the data tagging is still based on the results of the XBRL taxonomy reading.
4.7. Creating instance documents
An instance document is a file containing data reported based on the XBRL taxonomy consisting of a schema and linkbase file, which has been created by OJK. In this OJK E-Reporting system, instance document files will automatically be formed after the taxonomy presentation process and the data tagging process have been carried out. The instance creation process uses the data stream method so that it does not require large memory. The process of forming documents has been based on XBRL instance document provisions in general and stored on the file server repository. The instance document file in OJK has the form shown in Figure 22.
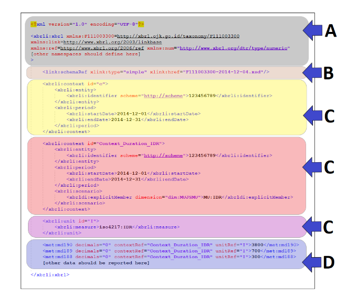 Figure 22: Example contents of instance document content generated by the OJK E-Reporting system
The following is an explanation of each part of the instance document:
- The header consists of XML Header and XBRL Header. In the XBRL header, the namespace and schema location is listed for the namespace used that is used in the document instance and is usually the same as the taxonomy (A).
- Schema location as described previously outside the instance document informs about the taxonomic reference used (B).
- The context consists of elements that contain information about the reporter and contain information about the reporting period. Also, scenarios can be added, namely specific conditions obtained from the intersection of values of the dimensions involved (C).
- Primary items are items that contain reported data that has been tagged with references that are needed. For primary items that are empty, the ‘xsi:nil=”true”’ attribute is added (D).
5. Experimental Result
The system was developed and tested using a taxonomy sample of monthly reporting from the the Financing Company (Indonesian: Perusahaan Pembiayaan or PP). The test only uses a representative of 1 report with flat type, not on all reports in PP. The focus of the experiment is how the system presents reports from the reading of taxonomy schema, until instance documents are formed. Experiments carried out from the user to log in, until the formation of report documents known as document instances. The login module in Figure 23, is the login standard that exists in all OJK systems. Login can use system validation by checking the master user table, and using LDAP validation. To add to the safety factor, a caption check is added, to ensure that no other system is attempting to enter the OJK E-Reporting system.
 Figure 23: Login module on the OJK E-Reporting system
The main module after the user has logged in is the report template list. Users are required to create a report template in advance that refers to the type of report you want to create, and the system will aim at the exact taxonomy that will be used. Experiments use flat type reports as shown in Figure 24 at record number 1. Input form to add report templates as shown in Figure 25, which has been adjusted to the needs of financial statements and taxonomy structure to the OJK. The input form for the list report template is also adjusted to the architecture of OJK’s taxonomy, according to the design of the previous system.
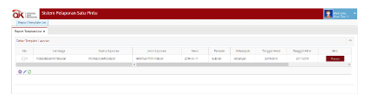 Figure 24: List of report templates module on the OJK E-Reporting system
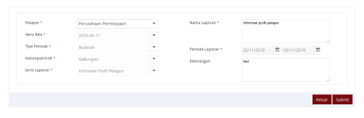 Figure 25: Report template input form module in the OJK E-Reporting system
Figure 26 shows the folder structure and the files associated with the selected report template. The folder presents the taxonomic grouping structure applied in OJK and becomes the parameter setting of the report template. The first schema file to read is a file with XSD extension, as explained at the taxonomy reading process point.
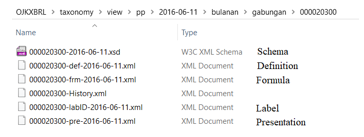 Figure 26: The folder structure and the files associated with the selected report template
In the schema file, the system will read all namespaces and linkbases associated with this scheme. Most of the main files needed are in this folder, except for the metadata associated with the dictionary (dict) as explained in the previous taxonomy reading point. In this experiment, we used samples for absolute elements (abs1 and abs2) as shown in Figure 27, to minimize the scope of the experiment. As seen in Figure 11, to see the child elements of these items, the system will read the presentation file form the folder that is read in Figure 26.
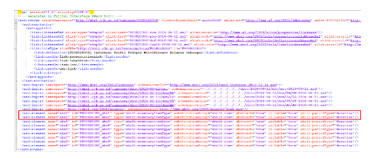 Figure 27: Example schema file that was read in this experiment
In the presentation file that is read, we can see that the abs2 item is the child of abs1 item. And abs2 has several derived items in it as seen in the presentation file in Figure 28. From here, the system can read the required data set and will read other related metadata from items that will be displayed such as labels, dictionaries related to boundaries, and the association of data with other dimensions. The system will process the taxonomy reading result of the metadata, then display it in the form of a user interface. That way XBRL users don’t need to deal with taxonomy in XML anymore, but already in the GUI format as shown in Figure 29.
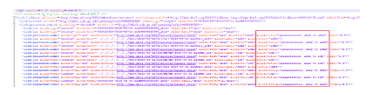 Figure 28: Example presentation file that was read in this experiment
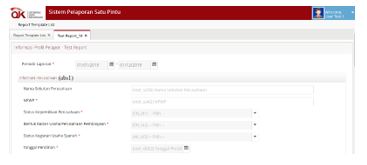 Figure 29: Report input module for flat type in OJK E-Reporting system
The experiment is continued by making changes to the taxonomy, for example by removing items or changing labels and input limits related to the selected report. In the presentation file in Figure 28, items with identity sd42 are subtracted. Then the label of item sd30 is changed, and the input given a restriction must be filled. Figure 30 shows an experiment related to change as mentioned before. Items with the identity sd42 are no longer found in the form. Whereas for items with sd30 there are changes to the label, and the input has a different data validation from before which is not allowed to be blank as shown in Figure 30. Validation of input components includes checking the blank data, allowed characters, and the length of characters inputted. Experiments show system boundaries related to this validation, the system cannot display data that has been covered if changes are made in the taxonomy related to this limit, so the data does not pass the validation. As a result, the system is well adapted to changes in both the data and taxonomy structure. If there are items that are omitted in the taxonomy, then the data that has been inputted cannot be maintained in the database.
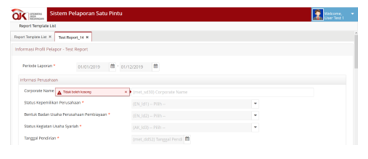 Figure 30: Report input module after taxonomy modification
After the user input data, the next task of the system is to tag data. The goal is that data can be added into a dataset that will be ready to be written into an instance document as shown in Figure 31, as result of the process. Experiments show the system can properly produce instance documents even though the taxonomy has changed, both structurally and in the dictionary associated with the items contained in the taxonomic structure. Regarding the experiment mentioned earlier, when an element with identity sd42 is removed from the presentation an instance document will be formed as shown in Figure 32. It is important to understand, only changes in presentation and data types will affect document instances.
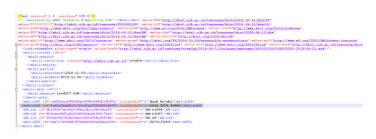 Figure 31: Document instance generated before taxonomy modification
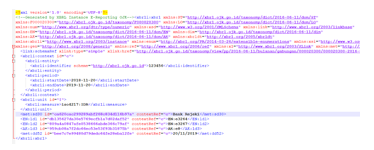 Figure 32: Document instance generated after taxonomy modification
Table 6: UAT scenario on authorization
| Date | Title | Description |
| Login | Testing the login module | |
| Case-Id | Description | |
| LOG-01 | Log in by filling in the username column | |
| LOG-02 | Log in by filling in the password field | |
| LOG-03 | Log in by filling in the captcha column | |
Table 7: Potential errors on the UAT authorization
| Case-Id | Scenario | Screen | Sub-Screen | Problem |
| AU-01 | Log in to the application | Login | 01 | Username, password and captcha are left blank |
| 02 | Incorrect username, password and captcha |
6. Testing and Evaluation
OJK E-Reporting System is tested and evaluated using the User Acceptance Test (UAT) at the Directorate of Statistics and Information IKNB (DSIN) and the OJK Financing Company Supervisor. Acceptance testing performs validation on the software product, and UAT is one of the classified of acceptance tests. The UAT will focus on the requirements of the system design based on the system use case scenario to consider the usability of the system and ensure that the process is carried out in the right way [27-29]. Testing goes on by dividing it into 2 parts, namely: authorization and functionality. For UAT authorization only focuses on access rights to report templates that are owned only. Test scenarios for authorization testing can be seen in Table 6, and error potential in Table 7.
After doing the UAT on the authorization side, no errors were found in user authentication, but there was an error in the list of report templates that were displayed not in accordance with their rights. Furthermore, in functional testing, test scenarios can be seen in Table 8 and potential errors in Table 9.
Table 8: Skenario UAT on functionality
| Date | Title | Description |
| Form | Tests for testing taxonomy transformations into input forms for data reporting | |
| Case-Id | Description | |
| FRM-01 | Select a report template to display as an input form | |
| FRM-02 | Entry data and then saved | |
Table 9: Potential error UAT on functionality
| Case-Id | Scenario | Screen | Sub-Screen | Problem |
| UI-01 | Data reporting | Form | 01 | Displays report forms that have no taxonomy |
| 02 |
Entry data with incorrect data |
After conducting the UAT on the fictional presentation of XBRL taxonomy and input data, no errors were found. It needs to be re-validated if there are report templates for which there are no taxonomic guidelines, then they don’t need to be displayed. The process of presenting taxonomies into input forms also takes a little time, but the forms already have input limitations so the process of making instance document reports becomes faster. Finally, an evaluation of the system readiness carried out by the stakeholders to ensure the system is ready can be seen in Table 10.
Table 10: OJK E-Reporting system readiness checklist
| Items | Description | Values |
| Scope of development | The scope of development consists of re-engineering a system of existing systems that are live and used. |
Good Enough Not good |
| Unit test by developer | A unit test has been carried out by the developer. |
Good Enough Not good |
| User Acceptance Test |
· User Acceptance Tests are carried out in the main functions of the system as a whole because the system was developed from scratch, with reference to the existing system using the Application Making Request Form. · Testing has been carried out both by the Directorate of Statistics and Information of the IKJB (DSIN) of the OJK and the OJK Financing Company Supervisor (May 19, 2019) with good results and all features running smoothly. |
Good Enough Not good |
|
Primary & secondary DC locations
|
Main server location: DC colocation at Sentul Bogor, Indonesia |
Good Enough Not good |
| Hardware specifications |
· 3 Web Servers · 1 Database Server Server virtual with high availability |
Good Enough Not good |
7. Conclusion
From the results of discussions that have been obtained in the development and testing of the OJK E-Reporting system, it can be concluded as follows:
- The system has been able to properly present the XBRL taxonomy flexibility adopted by XBRL, although it cannot yet be used for complex financial reporting of LJK.
- Separation of validation has a big impact on processing time because there is validation on the client-side that has been done when data is inputted. This has an impact on the processing of overall validation at OJK so that it becomes faster and more effective.
- Automated creation and storage of XBRL instance documents performed by the OJK E-Reporting system does not overload the client-side (LJK), because it is directly created and stored on the server-side (OJK).
OJK’s E-Reporting System can cover weaknesses and deficiencies in the existing system (SIPP client tool), in terms of flexibility, validation efficiency, and convenience. The system still has great potential to be developed because it cannot yet support the reading of complex taxonomies with the implementation of interrelationships between existing reports. Validation placement based on formulas will no longer be needed if the input component in the taxonomy transformation form can be checked directly when the user fills into input data. Also, it is necessary to add varieties of input data types (e.g. xls file), so that users can provide data in other forms and do not need to manually input data.
- J. W. Kim, J.-H. Lim and W. G. No, “The effect of first wave mandatory XBRL reporting across the financial information environment.,” Journal of Information Systems, vol. 26, no. 1, pp. 127-153, 2012.
- R. Chowdhuri, V. Y. Yoon, R. T. Richard and U. O. Etudo, “Ontology based integration of XBRL filings for financial decision making,” Decision Support Systems, vol. 68, pp. 64-76, 2014.
- A. Bahri, “Pros and Cons of XBRL (A New Era In The Field of Commerce),” International Journal of Business Management and Scientific, vol. 30, June 2017.
- J. Bao, G. Rong, X. Li and L. Ding, “Representing Financial Reports on the Semantic Web,” Semantic Web Rules Lecture Notes in Computer Science, pp. 144-152, 2010.
- R. García and R. Gil, “Publishing XBRL as linked open data,” In CEUR Workshop Proceedings, vol. 538, 2009.
- M. Vasarhelyi, D. Chan and J. Krahel, “XBRL consequences to financial reporting, data analysis, decision support, and others,” Rutgers University, 2010.
- H. Chen and W. Sun, “Study on Rational Application of eXtensible Business Reporting Language,” JSW, vol. 6, no. 2, pp. 257-264, 2011.
- M. Willis, “Improving investor communications and analysis via standardization,” The International Journal of Digital Accounting Research, vol. 7, pp. 153-165, 2007.
- S. A. A. Azhar and U. Subramanian, “Impact of XBRL in Emerging Countries,” Available at SSRN 3462951, 2019.
- S. R. Abed, “The Perception of XBRL Technology in the Jordanian Context: An Exploratory Study,” Research Journal of Applied Sciences, vol. 13, no. 1, pp. 1-4, 2019.
- C. E. L. Ceballos, “The International Language of Information Xbrl, in the Tuluá SMES,” International Journal of Economics and Management Systems, vol. 3, 2018.
- C. Hoffman and M. M. Rodríguez, “Digitizing Financial Reports – Issues and Insights: A Viewpoint,” The International Journal of Digital Accounting Research, vol. 13, 2013.
- C. Hoffman, “Financial Reporting Using XBRL, IFRS and US GAAP Edition,” UBMatrix, 2006.
- R. García and R. Gil, “Triplificating and linking XBRL financial data,” Proceedings of the 6th International Conference on Semantic Systems, September 2010.
- J. Cardoso, M. Hepp and M. D. Lytras, The semantic web: real-world applications from industry, vol. 6, Springer Science & Business Media, 2007.
- H. Fischer and D. Mueller, “Open Source & XBRL: the Arelle® Project,” In 2011 Kansas University XBRL Conference, pp. 29-30, 2011.
- C. Binstock and B. Milnes, “XBRL flat table mapping system and method”. Patent U.S. Patent No. 9,292,544, 22 Mar. 2016.
- E. Stergiaki, A. Vazakidis and A. Stavropoulos, “Development and Evaluation of a Prototype web XBRL-Enabled Financial Platform for the Generation and Presentation of Financial Statements according to IFRS,” International Journal of Accounting and Taxation, vol. 3, no. 1, pp. 74-101, 2015.
- R. K. Elliott and P. D. Jacobson, “Costs and benefits of business information,” Accounting horizons, vol. 8, no. 4, pp. 80-96, 1994.
- R. L. Watts and J. L. Zimmerman, “Positive accounting theory: a ten year perspective,” Accounting review, pp. 131-156, 1990.
- S. Gregor and A. R. Hevner, “Positioning and presenting design science research for maximum impact,” MIS quarterly, pp. 337-355, 2013.
- C. C. Chou, C. J. Chang and J. Peng, “Integrating XBRL data with textual information in Chinese: A semantic web approach,” International Journal of Accounting Information Systems, vol. 6, pp. 32-46, 2016.
- R. S. Pressman, Software engineering: a practitioners approach, Boston: McGraw-Hill Education, 2015.
- L. D. Bentley, K. C. Dittman and J. L. Whitten, System analysis and design methods, Boston: McGraw Hill, 2000.
- L. Forte, “Building a Modern Web Application Using an MVC Framework,” 2016.
- B. Haugset and G. K. Hanssen, “Automated acceptance testing: A literature review and an industrial case study,” In Agile, 2008. AGILE’08. Conference, pp. 27-38, August 2008.
- P. Pandit and S. Tahiliani, “AgileUAT: A framework for user acceptance testing based on user stories and acceptance criteria,” International Journal of Computer Applications, vol. 120, no. 10, 2015.
- J. A. Shim, H. J. Kwon, H. J. Jung and M. S. Hwang, “Design of acceptance test process with the application of agile development methodology,” International Journal of Control and Automation, vol. 9, no. 2, pp. 343-352, 2016.
- M. E. Khan, “Different Software Testing Levels for Detecting Errors,” International Journal of Software Engineering (IJSE), vol. 2, no. 4, pp. 70-80, 2011.
- I. Belev, “Alternatives for Storing and Validating XBRL Data,” American Scientific Research Journal for Engineering, Technology, and Sciences (ASRJETS), vol. 60, no. 1, pp. 191-201, 2019.