
Windowing Accuracy Evaluation for PSLR Enhancement of SAR Image Recovery
Volume 5, Issue 1, Page No 48-57, 2020
Author’s Name: Mohamed Bakry El_Mashade1,a), Haitham Akah2, Shimaa Abd El-Monem2
View Affiliations
1Electrical Engineering Dept., Faculty of Engineering, Al_Azhar University, Nasr City, Cairo, Egypt
2Space Communication Dept., National Authority for Remote Sensing and Space Sciences, Nozha El-Gedida, Cairo, Egypt
a)Author to whom correspondence should be addressed. E-mail: Mohamed.B.ElMashade@azhar.edu.eg
Adv. Sci. Technol. Eng. Syst. J. 5(1), 48-57 (2020); ![]() DOI: 10.25046/aj050107
DOI: 10.25046/aj050107
Keywords: Synthetic Aperture Radar, SAR image processing, Windowing, SAR image quality, Range-Doppler Algorithm

Export Citations
Synthetic aperture radar (SAR) is an imaging device mounted on a moving platform. Its ability to identify a weak target from a nearby strong one depends upon the peak side lobe ratio (PSLR). This paper is intended to ameliorate such important ratio through the use of windowing of the transmitted pulse and studying the noise sensitivity of the resulted image. Two experiments are simulated for different types of windows using point target and earth images. PSLR, dynamic range, spatial resolution, radiometric resolution, mean and standard deviation are evaluated for each window of the point target image. Also, the sensitivity to noise is discussed through the calculation of the mean square error, root mean square error, signal-to-noise ratio (SNR), peak SNR for the earth image. Experimental results show that Triangular, Gaussian and Hann achieve the highest PSLR performance with different reductions in their resolution, whilst Taylor has the worst performance due to its high sensitivity to noise. The remaining ones give intermediate performance.
Received: 19 October 2019, Accepted: 28 December 2019, Published Online: 15 January 2020
1. Introduction
Synthetic aperture radar (SAR) can be viewed as an aerial remote surveillance tool because of its ability to originate 2D and 3D high-resolution mapping with all-weather visibility. It is an imaging radar mounted on a moving platform. To originate an image of a target, it sequentially transmits electromagnetic waves and collects the backscattered echoes through the radar antenna. It employs the motion of the radar antenna over a target region to provide finer spatial resolution. In other words, a target scene is illuminated by successive pulses of radio waves with wavelengths of a meter down to several millimeters and the echo of each pulse is received and recorded. The consecutive times of transmission/reception are translated into different locations due to the platform movement. By processing these successive echoes, the recordings from multiple antenna positions are combined to establish an image for the target under test. Typically, an appropriate coherent combination of the received signals allows the construction of a virtual aperture which is much longer than the physical antenna length. In this regard, the larger the aperture, the higher the image resolution will be, regardless of whether the aperture is physical (a large antenna) or synthetic (a moving antenna). As a consequence of this, high-resolution images, with comparatively small physical antennas, can be created. In general, SAR employs the different locations of the sensor, as it moves along the flight path, to simulate a large antenna from a smaller one. This enables its sensor to provide high resolution imagery which will not be degraded with distance as in the case of traditional radar systems with large antennas. For these reasons, SAR becomes a more popular imaging sensor in most practical applications [1-5].
There are different modes of operation of SAR systems. Since the strip-map SAR mode is the most interesting one of these modes, it is chosen to be the scope of treatment in this paper. The appellation of this mode originates from the fact that it is associated with the type of SAR that can continually map strips of the ground as the aircraft flies by. In this mode, the electromagnetic energy is transmitted and its associated radar beam is used to illuminate a specified area that is called footprint. The radar antenna is pointed along a fixed direction according to the flight path, and the antenna footprint covers a strip on the illuminated surface of a point target [6-8]. The length of the strip is limited by the distance to which the sensor moves through the travel. In this regard, SAR strip-map data acquisition geometry is illustrated in Figure 1. In this figure, the flight direction is called azimuth direction, whilst the perpendicular to which is called range direction; the length of which extends from the radar antenna to the target [9,10].
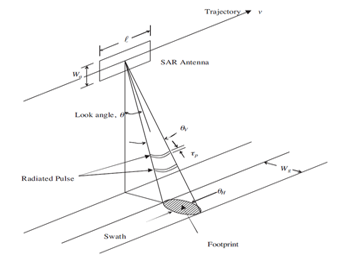 Figure 1: SAR data acquisition geometry
The received SAR signal can be considered as a two-dimensional (range and azimuth) signal; the construction of which is as shown in Figure 2.
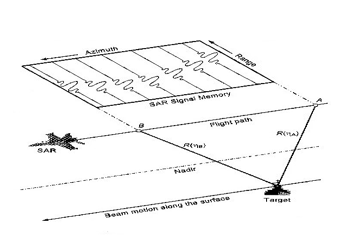 Figure 2: SAR data construction as a 2-dimensional signal
In this figure, it is shown that when the sensor is at position A, the target lies in a radar beam. So, the received signal is recorded in one row of the memory. While the sensor moves, it sends more pulses and the received signal is written in another memory location. When the sensor is at position B, on the other hand, the target leaves the beam and the last received signal is preserved. This two-dimensional signal is called “raw data”, “phase history data”, or “echo”. Its coordinates are the range (fast) time and the azimuth (slow) time. Power spreading of this raw data represents the input to the SAR signal processing/image formation algorithm; the main function of which is to compress the signal energy in order to reconstruct the final image [11-13].
The final version of image processing is called single look complex (SLC) image. To extract the SLC image from the raw (echo) data, there are several algorithms including range-Doppler algorithm (RDA), chirp scaling algorithm, SPECAN algorithm, and omega-k algorithm. Due to its efficiency, accuracy, maturity, and ease of implementation, RDA is the most widely used algorithm. For this reason, it is chosen to be an image formation processor in this research. This algorithm requires some information about the transmitted pulse and imaging geometry, such as range and satellite velocity, to construct the range and azimuth compressions, respectively. Its idea is based on matched filtering process to perform such types of compression. Additionally, it uses block processing to achieve frequency domain representation of both range and azimuth separately. Accordingly, RDA has some steps, as Figure 3 demonstrates, that must be followed in order to formulate the SLC image. In these steps, the FFT-based measurement represents the error resulting from the effect known as leakage. It occurs when calculating a non-periodic data by FFT. To overcome such error, the window function must be applied [14-16]. Thus, by applying a window function to the algorithm shown in Figure 3-a, a new modified version of this algorithm is clarified in Figure 3-b.
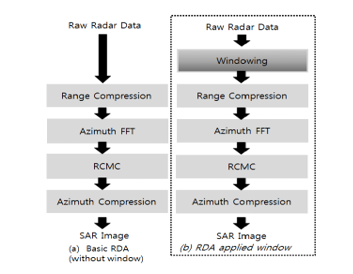 Figure 3: (a) Block diagram of basic RDA (b) Block diagram of RDA applied window
It is of interest here to enhance the peak side lobe ratio (PSLR) of SAR image. This can be achieved by applying a window function to the transmitted pulse. Gaussian, Kaiser, Taylor, Chebyshev, Triangular, Hann, Blackman, Flattop and Tukey window functions are used to generate different raw data which is applied to RDA to get the final SAR image for each window. Additionally, PSLR, dynamic range, spatial and radiometric resolutions are studied. Moreover, the mean square error (MSE), root means square error (RMSE), signal-to-noise ratio (SNR) and peak SNR (PSNR) are computed for the above mentioned window functions.
The paper is structured as follows: section 2 is concerned with the model description of the underlined point of research. Section 3 discusses the problem under examination. SAR raw data generation with different window functions is outlined and a comparison between the accuracy of the final images is made in section 4. In section 5, the windowing range reference signal as well as the result of RDA applied window is presented and the errors in the final images are compared through the metric parameters. Finally, section 6 summarizes our concluded remarks.
2. Model Description
In SAR system, the image formation processor produces an image that is a 2-dimensional mapping of the illuminated scene. The formed image is interpreted in the dimensions of range and cross-range or azimuth. The range resolution of a SAR image is directly related to the bandwidth of the transmitted signal and the cross-range is inversely proportional to the length of the antenna aperture. Therefore, high range resolution is achieved by transmitting wide bandwidth waveforms, and high cross range resolution is achieved by coherently processing returns received from a variety of positions along a flight path to emulate a large aperture. Accordingly, pulse compression is used to maintain the average transmitted power of a relatively long pulse while obtaining the range resolution corresponds to a short pulse. In this regard, linear frequency modulation (LFM) is one of the most common pulse compression techniques. In this type of modulation, the transmitted signal has a form given by:
In the above expression, t represents the fast time, f0 denotes the carrier frequency, kr is the range chirp or FM rate, and Wr(t) is the pulse envelope of the transmitted signal.
The received signal is a replica of the transmitted one with the exception that it is time delayed, attenuated, phase-shifted, and accompanied with additive white Gaussian noise (AWGN). To remove the high-frequency carrier and convert the signal to the baseband, the quadratic demodulation is used and the result can be expressed as:
In this formula, t denotes the range time, η symbolizes the azimuth time, χ represents the attenuation factor from reflection at the target, n(t, η) denotes an additive white Gaussian noise, wa(η-ηc) is the azimuth beam pattern amplitude modification, which is illustrated in Figure 4, and 2R(η)/c refers to the time delay.
Eq.(2) represents a summation of the reflections from M different point targets. This formula is used in MATLAB to generate all the reflections from the area that is required to be imaged during the flight direction. This complex style equation constitutes the signal in its raw form (echo). It is a function of both range domain (fast time) and azimuth domain (slow time) where the energy is spreaded in them.
Basic RDA uses a rectangular window in its transmission. Through the range compression process, which is performed in the frequency domain using the correlation between the raw data and a replica of the rectangular transmitted pulse, Eq.(1) can be expressed as:
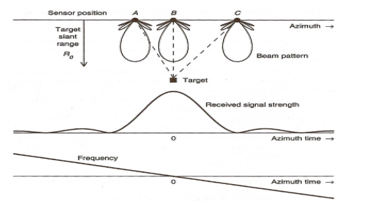 Figure 4: Azimuth Beam Pattern
The result of this correlation is transformed back to the time domain to completely perform the range compression process. On the other hand, to prepare the data for azimuth compression, the second step is to carry out azimuth FFT which is needed to transform the data into the range-Doppler domain. In this domain, RCMC can be applied due to its hyperbolic trend with respect to the azimuth time. Then, azimuth compression is constructed. The result of this compression is transformed back to the time domain using inverse fast Fourier transform (IFFT) to obtain the final image [12].
Due to the importance of windowing in enhancement of PSLR of SAR image generated by RDA, we are going to discuss its basic concepts. In this regard, a window is defined as a symmetrical real function where its weights are applied to the signal spectrum. The maximum value is applied in the middle of the spectrum and roll off towards the edges. The PSLR value for the rectangular window is very high. One of the best methods to reduce it is to apply the smoothing window. Windowing is applied in the frequency domain of the matched filter to reduce the leakage [3]. The effect of windowing appears in smoothing the spectrum where it reduces the discontinuity at the edges. So, the leakage of the main lobe of the resulting compressed pulse is reduced as Figure 5 demonstrates. In contrast, the resolution is degraded due to the reduction of the effective signal bandwidth as a result of compression process [14].
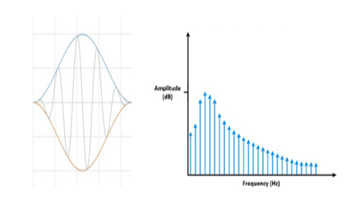 Figure 5: Spectral leakage reduction due to windowing
Rectangular, Gaussian, Kaiser, Taylor, Chebyshev, Triangular, Hann, Blackman, Flattop and Tukey as window functions are used. In our study, two images are simulated to see the effect of each one of these functions on the resulting image. Firstly, the point target image is used for point target evaluation with the aid of impulse response function (IRF). PSLR, dynamic range, spatial resolution, radiometric resolution, and the mean values are computed. Additionally, the sensitivity to channel noise is studied via the calculation of the metric parameters including MSE, RMSE, SNR and PSNR for the second image which is an earth image.
3. Problem Definition
Owing to its ability to measure delicate differences in the surface of the ground, SAR has become one of the most valuable tools for remote sensing of the earth and its environment. In this regard, it has revealed much new information about ground subsidence and the role it can play in natural disasters. One of the key features of the SAR image is target detection, which depends on its ability to differentiate a weak target from a nearby strong one. The PSLR parameter measures the ratio between the largest value of the side lobe to the peak level of the main lobe. For the SAR system IRF, the lower the PSLR is the better the system detectability. Thus, getting the lowest PSLR for any SAR system represents the main goal. The ability of PSLR reduction for SAR image, via windowing of the transmitted pulse, is the objective of this research. The transmitted pulse is changed in accordance with the applied window and the final SAR image will be formulated obeying the specifications of each transmitted signal. Therefore, it is of interest to study the effect of each window on the SAR echo generation and the final SAR image through the image formation processes for the purpose of searching the best one amongst them. Various windows are employed to generate the SAR echo from which the final SAR image, using RDA applied procedure, is obtained. Each window has a different effect on the final image. The difference between the basic RDA and its applied window is illustrated in Figure 3.
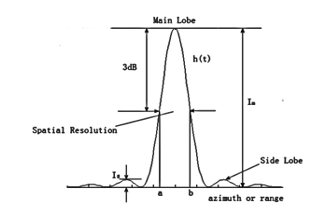 Figure 6: IRF and evaluation of point target parameters
4. Methodology
An experimental approach is implemented by simulating the underlined problem on a PC using MATLAB software. In this simulation, two images are employed. The first one is as bright as possible point target image to make the problem of interest more easily. This image is treated by several windows. Each window is used to generate the raw data with the aid of Eq.(2). This raw data is processed using RDA applied scenario to extract the final SAR image. The SAR image of each window is examined by the IRF. PSLR, dynamic range, spatial resolution, and the radiometric resolution are evaluated in the range direction. These parameters and IRF are displayed in Figure 6. They are calculated with the aid of an interpolation procedure.
The second scene is the earth image. It is used to study the sensitivity of each pulse to channel noise. The mother image is utilized in generating the raw data for several windows using Eq. (2). This raw data is applied to generate the final SAR image using RDA. The noise is added to the raw data to see the sensitivity of each window to such unwanted signal. This noisy raw data is used to generate the final image and MSE along with RMSE, SNR, and PSNR are calculated. In our simulation the following formula is used to generate the noise that is added to the raw data to establish the final data processing:
In the above formula, σ2 denotes the signal power, rand(., .) is the random number generator, M & N represent the number of rows and columns of the image’s pixels.
Firstly, the MSE parameter is regarded as the measure of the quality. It is based on a comparison between the generated image and that containing the actual pixel. It has a mathematical form given by:
Here, f(i,j) denotes the pixels of the original image, g(i,j) represents the same thing for the generated image, M symbolizes the image’s row numbers of pixels, and N refers to the image’s column numbers of pixels.
As well, RMSE measures how much error is there between the two images. Mathematically, it is defined as:
Also, SNR is dealing with the signal strength relative to the background noise. This ratio is usually measured in decibels (dB) using the formula:
Additionally, PSNR is an expression for the ratio between the maximum possible power strength of a signal and its accompanied power of noise. The PSNR parameter is generally expressed in terms of decibel scale. It is mathematically defined as:
In this mathematical expression, MAXF symbolizes the maximum signal power that is existed in the original image.
Moreover, the mean value, which indicates the level of the reflected signal, is calculated. It is well-known that the higher the mean value is, the better signal level becomes.
In the two images of our experimental simulation, several windows are employed in the generation and focusing processes. They include Gaussian, Kaiser, Taylor, Chebyshev, Triangular, Hann, Flattop, Black-man, and Tukey. These two images are applied to generate the echo signal and consequently a SAR image, of dimension 900 x 1034, is extracted. The needed parameters for the generation and focusing of SAR images are summarized in Table 1. The resulting SAR image has a resolution of 1.5mx1m in range and azimuth, respectively.
For point target image, the IRF of each window is studied, in range direction, using the character of intensity which is defined as the squared modulus of the complex pixel of the final image. Additionally, normalized PSLR, spatial resolution, radiometric resolution and dynamic resolution are evaluated. For the earth image, on the other hand, MSE, RMSE, SNR, and PSNR are computed for each window as a series of simulations in the case where the noise variance varies from 0 to 3Watt at 16 steps. A total of 1000 samples are taken for each noise variance level in each window.
Table 1: Needed parameters for the generation and focusing of SAR images
| Parameters | Value | Unit | ||
|
Parameters for range compression
|
Range sampling frequency | fs | 4.5 | GHz |
| Chirp rate | Kr | 4*1013 | s-2 | |
| Chirp length | Tp | 2.5 | s | |
| Range resolution | Pr | 1.5 | m | |
| Parameters for azimuth compression | Velocity | V | 200 | m/s |
| Wavelength | 60 | cm | ||
| Range to target at broadside time t = 0 | R0 | 20 | km | |
| Aperture time | Dur | 3 | s | |
| Pulse repetition frequency | PRF | 300 | Hz | |
| Azimuth resolution | Pa | 1 | m | |
5. Simulation Results
For RDA applied window, the range reference signal is generated as a replica of the transmitted pulse. Accordingly, the windowing range reference signal differs from the rectangular range reference signal which is employed in RDA. Figure 7 depicts the windowing range reference signal for each window in the frequency domain. This signal is used in the application of the two image simulations associated with the point target and the earth. This figure has ten plots each one has two scenes. The first one represents the magnitude while the other refers to the phase. From the displayed results, it is evident that the flattop window in (d) is the narrowest while the rectangular in (a) is the widest. In the two cases, the phase variation has approximately the same behaviour.
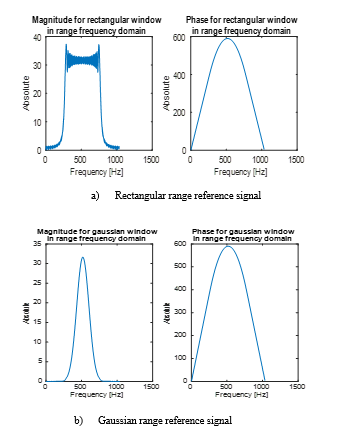
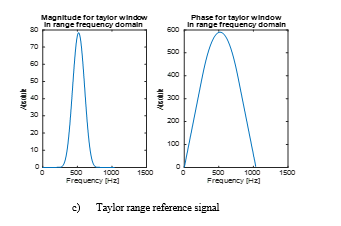
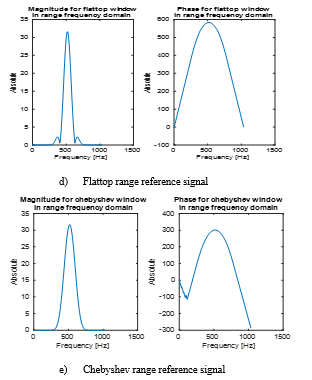
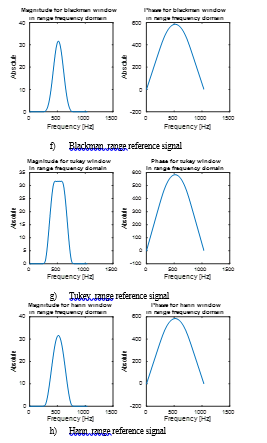
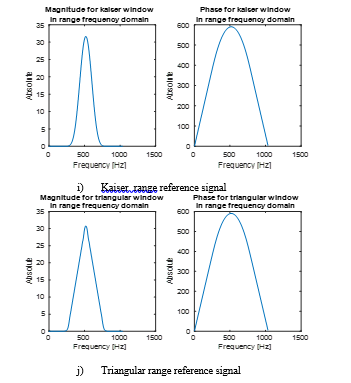 Figure 7: Frequency domain representation of
Windowing range reference signals
In the upcoming text, the obtained results of the two experiments are displayed. The point target image is used to study the IRF for each window for the purpose of the range direction evaluation of the point target. The numerical results of this evaluation are summarized in Table 2Table and Table 3.
Table 2: Point target evaluation results
| Window | PSLR (dB) | Mean |
Dynamic resolution (dB) |
| Range | |||
| Rectangular | -14.23 | 0.0019 | 211.374 |
| Black man | -20.70 | 0.0043 | 196.310 |
| Chebyshev | -20.68 | 0.0049 | 190.551 |
| Flattop | -19.94 | 0.0074 | 182.486 |
| Gaussian | -20.95 | 0.0043 | 196.480 |
| Hann | -19.40 | 0.0035 | 192.717 |
| Kaiser | -20.730 | 0.0046 | 191.825 |
| Taylor | -20.85 | 0.0044 | 211.116 |
| Triangular | -24.89 | 0.0033 | 202.516 |
| Tukey | -15.98 | 0.0030 | 201.898 |
Table 3: Resolution of point target evaluation
| Window |
Radiometric resolution (dB) |
Spatial resolution(m) |
| Range (half) | ||
| Rectangular | 12.985 | 2.7 |
| Black man | 11.420 | 6.3 |
| Chebyshev | 11.156 | 7.2 |
| Flattop | 10.285 | 10.95 |
| Gaussian | 11.377 | 6.3 |
| Hann | 11.802 | 5.25 |
| Kaiser | 11.270 | 6.75 |
| Taylor | 11.334 | 6.6 |
| Triangular | 11.941 | 4.95 |
| Tukey | 12.152 | 4.53 |
Let us now turn our attention to the second experiment which is concerned with earth image. The original earth image that is used in our simulation is depicted in Figure 8.
 Figure 8: Original earth image
This image is used to generate the raw data from which the final SAR image using RDA algorithm is produced. The extracted image for each window is illustrated in Figure 9. From this figure, it is noted that the final image for the Rectangular window has the best resolution and the Flattop window possesses the worst resolution while the resolution of the rest ones is intermediate between these two indicated windows.
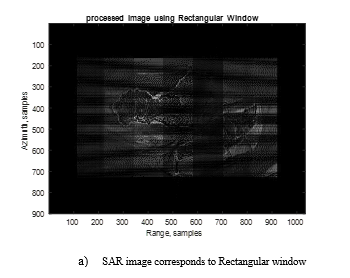
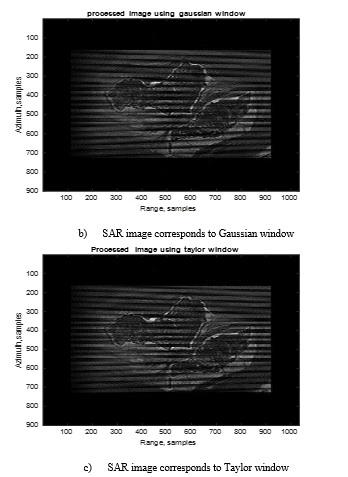
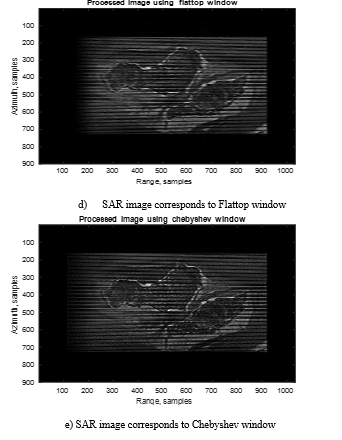
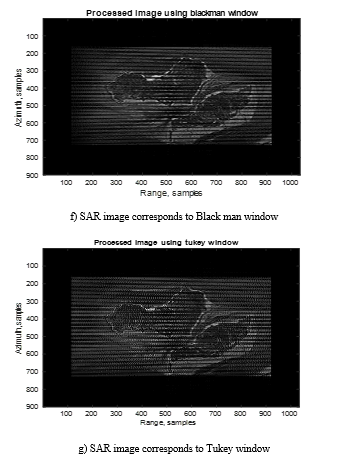
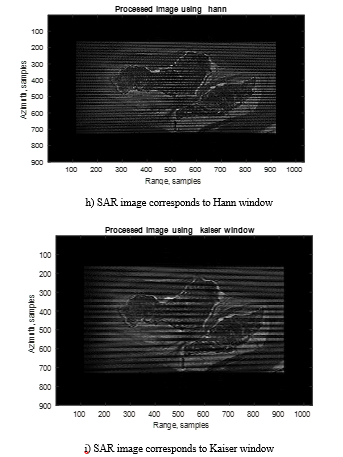
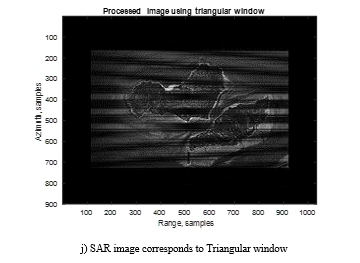 Figure 9: Final SAR images of the examined windows
For the displayed images of Figure 9, MSE, RMSE, PSNR, and SNR are now calculated and the results are plotted in Figure 10.
- MSE against σ
- RMSE variation versus σ
- SNR as a function of σ
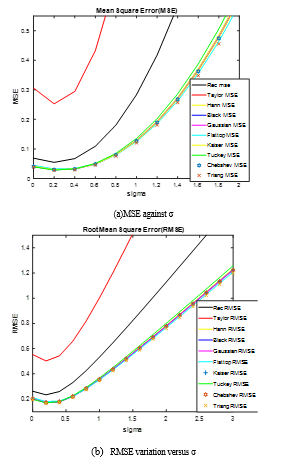
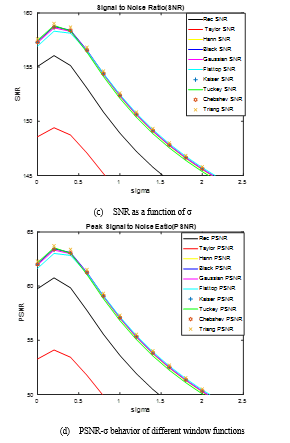 Figure 10:1 Noise sensitivity comparison of different window functions for earth image
From Figure 10, it is seen that Taylor window gives higher MSE and RMSE values, whilst its SNR and PSNR values are lowest. Owing to these worst values, Taylor window possesses the highest sensitivity to channel noise. Other windows perform better than the rectangular window and have less sensitivity to channel noise. Moreover, from Tables 2 & 3, it is recognized that PSLR of the SAR image can be improved by pulse shaping at the price of reducing the radiometric and spatial resolutions. Thus, the strategy of windowing, in general, enhances the image PSLR and consequently, it improves the system detectability in the range direction. On the other hand, the Tukey pulse shaping has the least enhancement factor due to its similarity to the rectangular window, however, its resolution is reduced by a factor of one and half relative to that of the rectangular window. Although Flattop image enhances the PSLR, its spatial resolution is lowered by 25% and its radiometric resolution is reduced by 2.7dB. So, the final image using Flattop pulse shaping has been appeared blurring and unclear as Figure 9 demonstrates. While the PSLR of Triangular window has the highest factor of improvement, which is 10.66 dB, its radiometric resolution is reduced by 1dB only and its spatial resolution is lowered to 54.5%. Next to Triangular window, the Gaussian pulse shaping comes. It has an enhancement factor of 6.72 dB in its PSLR image. However, its radiometric resolution is reduced by 1.6dB and its spatial resolution is lowered to 42.8%. Additionally, the Gaussian pulse shaping has the highest mean value which represents the high level of the reflected signal. Hann image reserves the next location. This type of window functions can similarly improve the image, as other windows, but its resolution is not reduced to a large value. Desbite Hann shows less PSLR improvement than Gaussian, its resolution performance is much better than Gaussian.
As indicated in [3], the Flattop window has the best performance, but this conclusion is from the SNR point of view only. However, studying the effect of this window on the resolution of the resulting image indicates that the final image has been appeared blurring and unclear. This means that the SNR only can’t be used as a best way of selecting the suitable windowing category, but other factors should be taken into account, for any SAR system. On the other hand, the MIMO technique has been introduced in [9]. This technique improves the SAR image but, it requires high resources and its hardware is complex. Additionally, it has the demerits of increasing both the cost and power requirement. In [8], partial windowing has been suggested. This scenario of windowing has some cons as less energy-efficient windows.
In our study, PSLR is improved via windowing the transmitted pulse as well as using this windowing in the matched filtering process in the frequency domain. This has the benefit of easily handling the processing and simplicity in its practical applications.
6. Conclusions
This paper is concerned with studying the effect of windowing on SAR image recovery for the purpose of improving PSLR of such type of images. Different types of window functions are applied to two simulating images; point target and earth. From our displayed results, it is observed that Triangular, Gaussian and Hann give the highest performance for PSLR with different reductions in their resolution. The worst one is the Taylor due to its high sensitivity to noise. The remaining ones have an intermediate performance. Finally, it is concluded that the best pulse shaping is that selected in accordance with the design specifications of a SAR system.
- Oliver C. and Quegan S., “Understanding Synthetic Aperture Radar Images”, Artech House, Boston, 1998.
- Y. K. Chan and V. C. Koo, “An Introduction to synthetic aperture radar (SAR),” Progress In Electromagnetics Research B, vol. 2, pp. 27–60, 2008
- Hyunguk Kim and Jinhwan Koh, “Analysis of Various Window Effect for SAR image Recovery,” JIEIE, Vol. 52, No.12, December 2015, pp. 2108-2116.
- Li Jian and P. Stoica, “An adaptive filtering approach to spectral estimation and SAR imaging”. IEEE Transactions on Signal Processing, 1996, 44 (6), pp.1469–1484.
- Bing Sun, Chuying Fang, Hailun Xu, and Anqi Gao, ” A New Synthetic Aperture Radar (SAR) Imaging Method Combining Match Filter Imaging and Image Edge Enhancement”, Sensors, Vol. 18, No. 12, 2018, pp. 1-16.
- Le-tian Zeng, Chun-hui Yang, Mao-sheng Huang, and Yue-long Zhao, “Verification of Imaging Algorithm for Signal Processing Software within Synthetic Aperture Radar (SAR) System”, Hindawi, Scientific Programming, Volume 2019, pp. 1-12.
- Birsen Yazıcı, Il-Young Son and H Cagri Yanik, “Doppler synthetic aperture radar interferometry: a novel SAR interferometry for height mapping using ultra-narrowband waveforms”, Inverse Problems, Vol. 34, No. 5, May 2018.
- Byoung-GyunLim, Jea-ChoonWoo, Hee-Young Lee, and Young-Soo Kim, “A Modified Subpulsebpulse SAR Processing Procedure Based on the Range-Doppler Algorithm for Synthetic Wideband Waveforms”, Sensors (Basel), 2008 Dec; 8(12): 8224–8236.
- Stéphane Méric and Jean-Yves Baudais, “Waveform Design for MIMO Radar and SAR Application”, Topics in Radar Signal Processing, chapter 3
- Y. K. Chan and V. C. Koo, “An Introduction to synthetic aperture radar (SAR)”, Progress In Electromagnetics Research B, Vol.2, 27–60, 2008
- R. Bamler, “Principles of synthetic aperture radar”, Surveys in Geophysics, Vol. 21, pp. 147–157, 2000.
- Kazuo Ouchi, “Recent Trend and Advance of Synthetic Aperture Radar with Selected Topics”, Remote Sens. 2013, Vol. 5, pp. 716-807
- Laurent Demanet, Matthew Ferrara, Nicholas Maxwell, Jack Poulson, and Lexing Ying, “A Butterfly Algorithm for Synthetic Aperture Radar Imaging”, SIAM Journal on Imaging Sciences, 2012, Vol. 5, No. 1 : pp. 203-243
- A. Leukhina, V. Bezrodnyia, N. Parsaev, “Signals for Synthetic Aperture Radar”, Procedia Engineering 201 (2017), pp. 398–407.
- Vishal M. Patel, Glenn R. Easley, Dennis M. Healy, and Rama Chellappa, “Compressed Synthetic Aperture Radar”, IEEE Journal of Selected Topics in Signal Processing, Vol. 4, No. 2, APRIL 2010, pp. 244-254.
- Jun Shi, Yang Liu, Wei Liu and Xiaoling Zhang, “High-resolution synthetic aperture radar based on the IEEE 802.11 protocol”, Electronics Letters, 2015, 51 (22). pp. 1815-1817.