
Industrial Network for The Control and Supervision of The Acetic Acid Dispatch Process, and Its Influence on The Reduction of Chemical Contaminants for Operators
Volume 5, Issue 1, Page No 13-20, 2020
Author’s Name: Omar Chamorro-Atalaya1,a), Jaime Yataco-Yataco2, Dora Arce-Santillan1
View Affiliations
1Faculty of Engineering and Management, Universidad Nacional Tecnológica de Lima Sur, Perú
2Grupo ODFJELL Terminals, Depósitos Químicos Mineros, Lima, Perú
a)Author to whom correspondence should be addressed. E-mail: omar_chamorro1@hotmail.com
Adv. Sci. Technol. Eng. Syst. J. 5(1), 13-20 (2020); ![]() DOI: 10.25046/aj050103
DOI: 10.25046/aj050103
Keywords: Control, Supervision, SCADA, Distributed Control, Occupational Health and Safety, Programming, Acetic acid

Export Citations
This article develops the design and implementation of an industrial network for the control and supervision of the process of dispatching acetic acid, which aims to reduce the presence of this chemical in the environment, since the process is activated manually by the operators; what generates a lack of precision in several stages of the process, that brings in many occasions, spill of the acetic acid that is highly flammable and harmful for the health of the operators; For this reason, an industrial network controlled by a Siemens S7-1200 Programmable Logic Controller (PLC) was developed using the SIMATIC STEP 7 Software, and a Siemens S410 Distributed Control System (DCS), using the PCS7 V 8.1 Software; where the control logic was programmed and the distributed periphery was implemented. Once the industrial network is implemented, the result is a 19.44% decrease in the presence of acetic acid in the environment; this value is complying with what is established in the regulation of “Permissible Limit Values of Chemical Agents in the Work Environment”.
Received: 11 September 2019, Accepted: 09 December 2019, Published Online: 15 January 2020
1. Introduction
Currently, almost all operators are exposed to some kind of risk, especially if the work to be done is linked to the use of chemical inputs; In fact, the risks of contact with chemical inputs are considered the most harmful in human health. Therefore, industries are in need of safeguarding the health of their operators; through the use of technologies, capable of reducing or mitigating the presence of chemical contaminants. As part of the strategies there is remote control, capable of supervising and controlling industrial processes from distant points. [1]
In other words, occupational health and safety requirements for operators and the environment, makes current industries have secure systems that allow generating data records and interact in a comfortable way through graphic interfaces, these systems are called SCADA (Supervisory Control and Data Acquisition) or control systems and process supervision. [2]
In a study carried out in Sangolqui, Ecuador, it is obtained that the implementation of these remote control and supervision systems (SCADA) has an effective communication infrastructure, which allows a 61.66% reduction of the risks to the operators in your industrial processes [3]
Likewise, in the industrial network of control and supervision of the crude oil industry it has been determined that the functionality achieved with the automation of the LACT units (Lease Automatic Custody Transfer) or Automatic Measurement Units for Custody Transfer, is 93.8 %, these results were able to meet the needs of the process, complying with the parameters established by the ARCH (Agency for Control and Regulation of Hydrocarbons) and ensuring the integrity of the unit of its workers before operational errors. [4]
The automatic control of emptying and filling of oil, reduces the intervention of the operator by 12% (18 minutes), and generates an optimal control in the spill of the liquid which is of high risk for the operators. [5]
In this sense, the present work aims to determine the influence of the decrease of chemical contaminants for the operators, through the design and implementation of an industrial network that will control and supervise the process of acetic acid dispatch.
The present work is structured as follows. Section 2 presents the methodology used in this research work; This methodology will have an Experimental Design of Quasi Experimental type, with a quantitative approach, since there will be a comparison of before and after the results obtained in relation to the presence of acetic acid in the environment. Section 3 shows the results obtained after observing the technical reports. Section 4 presents the statistical analysis. Finally, in Section 5 the discussion of the results obtained is presented.
2. Methodology
The process followed for the development of the proposal is as follows:
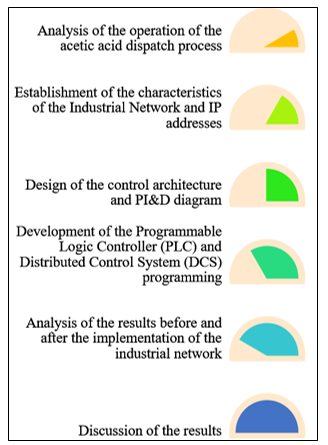 Figure 1: Development procedure
Once the procedure has been established, then the description of the system to be automated is carried out, with the purpose that said description establishes the context over which the guidelines for the development of the industrial network will be given, which will supervise and control the process of Chemicals dispatch.
According to the analysis performed, during the dispatch operation of trucks containing acetic acid, a series of equipment that are involved in the system are used, which require the intervention of the operators to perform the following activities:
- Valve maneuvers.
- Motor operation.
- Monitoring of constant connection of ground system against static loads.
- Registered operations.
- Permanent monitoring of possible overfill during the tanker truck dispatch process.
The steps to perform the dispatch operation are described in the following table:
Table 1: Steps to be performed in the Office Operation
| Steps | Supervisor | Operator 1 | Operator 2 | Operator 3 |
| Step 1: check permits office | █ | |||
| Step 2: truck income | █ | |||
| Step 3: take tare | █ | |||
| Step 4: pump ignition | █ | |||
| Step 5: valve opening | █ | |||
| Step 6: pump and valve monitoring | █ | █ | ||
| Step 7: final weight monitoring | █ | |||
| Step 8: procedural valve closure | █ | |||
| Step 9: pump off | █ | |||
| Step 10: connection and disconnection | █ |
Source: self-made
As shown in the table above, 4 people are needed for the operation of the dispatch process; there must be constant communication between the supervisor and the operators for the control and registration of the offices. Dispatch trucks have a capacity of 30 t and have up to 5 compartments.
Taking as reference the described, next, we will proceed to describe the characteristics of the industrial network for the control and supervision of the process of clearance of acetic acid; which is comprised of:
- CCM Electrical Room
- Communications board
- PLC cabinet
- Balance monitoring cabinet
- Network analyzer cabinet
- Server Room
- Computer Technology Cabinet
- Industrial Instrumentation Cabinet
- Balance control room
- Customer stations
- Engineering station
The control architecture of the Industrial Network fulfills 3 important functions:
- Record historical data.
- Supervise the plant, safety interlocks and protection.
- Communicate with the existing DQM-1 system. (Future)
To guarantee these functions, the system has the following characteristics:
- The industrial network data server is located in the server room and is connected through a fiber optic network with the DQM-1 control network. (Future)
- The PLC was installed in the Industrial Instrumentation Cabinet, inside the DQM-2 electrical room.
- The “control switch” communication switch will allow the exchange of information between the PLC and the data server.
- All remote start / stop signals from each PLC will be using the control logic and sent to the CCM via Profibus DP communication.
Communication between the main Controller and the Supervision System is via Ethernet. For this, 100/1000 Mbps high speed industrial switches were considered.
For the automated industrial network, the use of:
- A PC called the Operating Station; it is located in the control room. This PC performs the operation, supervision and control in DQM-2. The monitoring software considered for this PC is of the “runtime” type.
- A PC called an Engineering Station is installed in the control room, intended for operation and maintenance work. The monitoring software considered for this PC is of type “Runtime & Development”.
- Implementation of the card at the S7-300 level, projection of energy management through an industrial network branch in Mod Bus protocol.
- A Data Server to manage all the information that comes from the Control System. The server must include TCP / IP Ethernet connectivity and two next-generation network cards have been considered.
The communication network of the control system of the DQM-2 plant has the ability to communicate through a communication platform based on Ethernet TCP / IP and allows your data server to communicate with the server of the DQM-1 plant, to allow data from the new control system and the existing control system to be monitored from both plants. This link will be through fiber optics.
For the energy stage and grounding system the following was considered:
- Each cabinet has a copper bar to concentrate the connection of the Profibus DP fieldbus cable shields, analog 4–20 mA signal. And supply 24 VDC. An earth well was connected, which is connected to a group of earth wells near the Control Room or Electrical Room.
All analog signal instruments (transmitters) have Profibus DP communication. The discrete signal instruments and control signal switch contacts (switches, position switch, etc.) are of the dry contact type for an operating voltage of 110 VAC / 60Hz.
Following the development of the industrial network for the control and supervision of the acetic acid dispatch process, the following Table shows the established IP addresses:
Table 2: IP addresses
| Currently | IP Assignment | |||
| DQM-02 | IP Address | Terminal Name | Equipment Bus | Plant Bus |
| Industrial Server | OSS1A | 172.168.1.100 | 172.168.0.100 | |
| Engineering Station | INSTRUDQM2 | 172.168.1.21 | 172.168.0.21 | |
| CPU-PLC | 172.168.0.10 | |||
| HMI Balance Room | 172.168.0.50 | |||
| HMI GARITA | 172.168.0.52 | |||
|
Balance 10 |
172.168.1.110 | |||
|
Balance 11 |
172.168.1.111 | |||
|
Balance 12 |
172.168.1.112 | |||
| XSCALANCE01 | SW01-TB-SVR | 172.168.1.181 | ||
| XSCALANCE02 | SW02-PB-SRV | 172.168.0.182 | ||
| XSCALANCE03 | SW03-TB-CCM | 172.168.1.183 | ||
Source: self-made
After the description of the characteristics of the industrial network for the control and supervision of the process of acetic acid dispatch in the previous point, then I will proceed to represent the control architecture, for which I highlight the components and the type of communication protocol used in the process of data transfer, between the CCM Electrical Room, server room, balance control room and field elements.
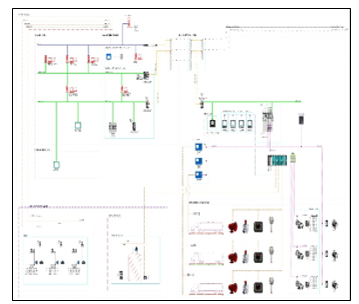 Figure 2: Industrial network control architecture
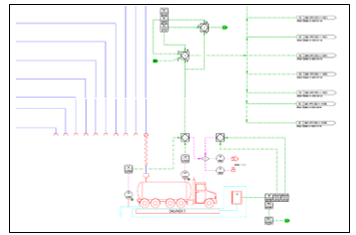 Figure 3: PI&D diagram
Next we proceed to develop the programming of the Siemens S7-1200 Programmable Logic Controller using the SIMATIC STEP 7 Software, and then perform the programming of the Distributed Control System (DCS SIEMENS S410), through the PCS7 V8.1 Software, where I configure the control logic.
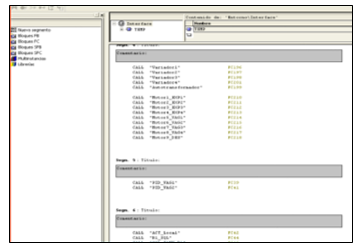 Figure 4: OB1 program execution block
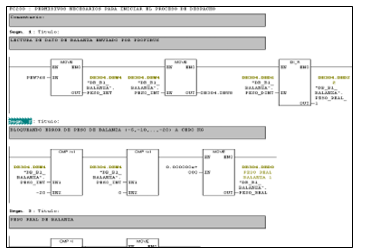 Figure 5. Ladder language programming
The monitoring system developed has areas for specific use and is always available to the user. The primary purpose of these areas is that the user can be immediately warned of any problem that occurs in the process and can also quickly go to review any screen of the process that is necessary. Likewise, the criterion that access to control and supervision is restricted and that the operation of the equipment is only carried out by authorized users was used.
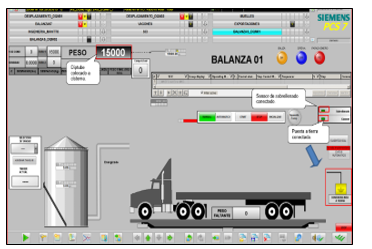 Figure 6: Grounding connection and overfill sensor connection
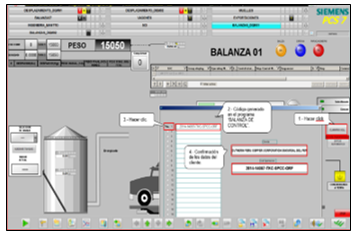 Figure 7: Generation of the operation code
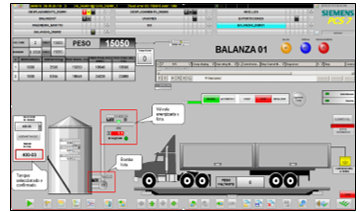 Figure 8: Enabled pump and energized valve for office 1
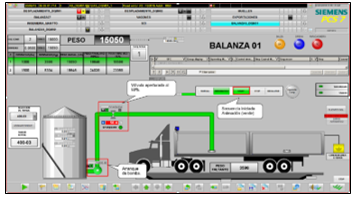 Figure 9: Starting the dispatch pump and opening the 50% electric valve
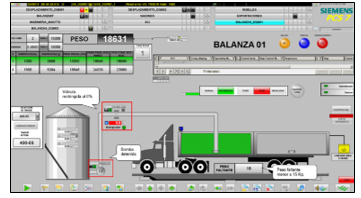 Figure 10. Electric valve completely closed, for a lack weight less than 15 kg – compartment 1
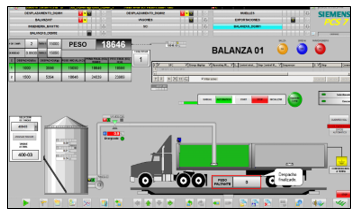 Figure 11. Finished office – compartment 1
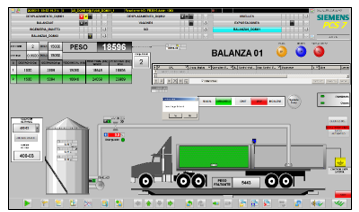 Figure 12: Compartment dispatch configuration 2
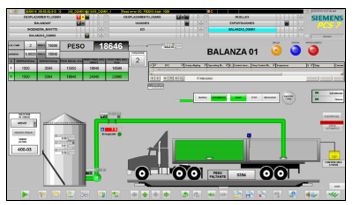 Figure 13: Dispatch of compartment 2
 Figure 14. Electrical valve restricted to 15%, for a lack weight less than 70 kg. – compartment 2
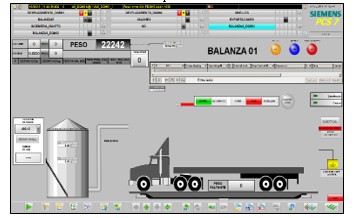 Figure 15: finished office – removal from the tank
3. Results
In order to determine the influence on the decrease of chemical contaminants for operators; It was established that the research design is Experimental of Quasi-Experimental type, since there will be a comparison of before (pre-test) and after (post-test), the presence of acetic acid in the environment.
Our choice is based on the fact that, with the quasi-experimental design, it is intended to study the impact or influence of treatments and / or processes of change, in situations where the subjects or units of observation have not been assigned according to a criterion random. [6]
Likewise, the population is constituted by the Control and Supervision System of the acetic acid dispatch process, which is constituted by the CCM Electrical Room, the Server Room and the Balance Control Room; since, the population is defined as the totality of the phenomenon to be studied where population units have a common characteristic of which is studied and gives rise to the research data. [7]
The sample is equal to the population, since; if the population is less than fifty, the population is equal to the sample or the unit of analysis. [8] The type of sampling is non-probabilistic of the type “Deliberate, critical or by trial”, which is an effective technique in situations where there is only a restricted number of units of analysis with similar qualities; this type of sampling generates that the results obtained are highly accurate with a minimum margin of error. [9]
In the present investigation 63 measurements have been made, which were taken in an interval of 1 hour, in a period of one week, that is to say, 9 measurements were made, both before (pre-test) and after (post- test) of the presence of acetic acid in the environment; these results were processed with the statistical software SPSS version 24. Given the above, the data processing is shown below.
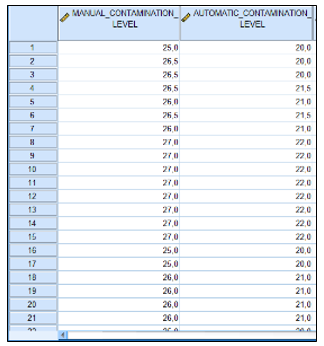 Figure 16. Data processing
Likewise, in order to determine the influence of the decrease of chemical contaminants for the operators, through the design and implementation of an industrial network that will control and supervise the process of dispatching acetic acid; the statistical tool “Arithmetic Media” was used; The following Table shows the result of the measurements in relation to the presence of acetic acid in the environment.
It should be noted that according to the regulation of “Permissible Limit Values of Chemical Agents in the Work Environment” approved by the D.S. N° 015-2005-SA, by the Ministry of Health of the Peruvian state, the permissible limit value of acetic acid is 24.5 mg/m3. [10]
Table 3. Average level of acetic acid pollution before and after the industrial network
| N | Minimum | Maximum | Half | |
| Manual Contamination Level | 63 | 25,0 | 27,5 | 26,206 |
| Automatic Contamination Level | 63 | 20,0 | 22,5 | 21,111 |
| Valid N (per list) | 63 |
Source: SPSS
To determine the extent to which the industrial network influences the control and supervision of the acetic acid dispatch process in the reduction of chemical agents; we will use the following formula; which consists in calculating the average for each of the groups (manual and automatic); The difference between the two average observations will be the influence or impact of the present investigation.
Where:
% influence = Percentage influence
AAI = Average after implementation
ABI = Average before implementation
According to the results in table 3, we replace the values in equation 1, obtaining the following:
According to the result, the percentage of influence has decreased by 19.44%; although this value seems small, it is very significant, since with this decrease, it is complying with what is established in the regulation of “Permissible Limit Values of Chemical Agents in the Work Environment”.
Once the data analysis has been obtained and the influence result obtained, the normality test will be carried out in order to determine if the data is reliable.
The following levels of significance are considered: [11]
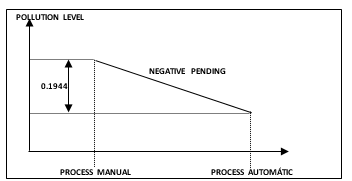 Figure 17. Representation of the decrease of acetic acid in the environment
- 05 for research projects
- 01 for quality research
- 10 to find markets and policies
So for the present investigation the level of significance (p) is 0.05 and implies that the researcher has a 95% reliability; below is the following statistical criteria established for this test:
- If the value p < 0.05, the data comes from a normal distribution
- If the value p >0.05, the data does not follow a normal distribution
The criterion to determine which values to use in the normality test is the following:
- Kolmogorov -Smirnov / large samples (> 30)
- Shapiro Wilk / small samples (<30)
In our case we will use the Shapiro Wilk test; the following table shows the result obtained:
| Kolmogorov-Smirnova | Shapiro-Wilk | |||||
| Statistical | GL | SIG. | Statistical | GL | SIG. | |
| Manual Contamination Level | ,186 | 63 | ,000 | ,871 | 63 | ,000 |
| Automatic Contamination Level | ,229 | 63 | ,000 | ,814 | 63 | ,000 |
Table 4: Normality test
Source: SPSS
With the result of the normality test we can interpret that the values obtained are 95% reliable, that is to say that the data obtained have a normal distribution (True values).
Finally, we will determine the level of significance of the decrease result, using the T-Student test; this test is used when the following requirements are met:
- When it is possible to calculate the mean and standard deviation from the sample.
- The sample size must be less than 30.
For the development of this test we will initially calculate the degrees of freedom, which are the numbers of values of a sample that we can freely specify, after we already know something about that sample (n = 63), the calculation refers to the number of quantities of the sample, in this case they are the measurements made, minus the number of restrictions that bind the observations and the statistic, then the degree of freedom is as follows:
Degree of freedom:
Replacing in (2):
Once the degree of freedom is obtained, we will use the T-Student table to determine the critical value, with this we will statistically corroborate the influence of the industrial network variable on chemical pollutants.
Table 5: T-student
Source: (Campos, 2010)
The calculated critical value is 1.6706; with the critical value found, we will determine the significance value of the decrease in acetic acid in the environment, using the T-Student Test, of the SPSS statistical program.
Table 6: Test T – student
| 95% trust interval for the difference | GL | Sig. Bilateral | ||
| Lower | Higher | |||
|
Manual Contamination Level
Automatic Contamination Level |
4,9131 | 5,2774 | 62 | ,000 |
Source: SPSS
Next, we will analyze the results of the T-Student test (Bilateral Significance), and replace the result in the following expression.
The acceptance region is:
-∞ < t <+1,6706
t = 0,000
-∞ < 0,000 < 1,6706
With the result obtained, we can confirm that there is an influence of the industrial network variable on the variable polluting chemical agents, that is, the variables are related to each other. Also, since the significance value is less than 0.05, it means that there is a high level of significance in the decrease in acetic acid in the environment.
4. Discussion
In relation to the results of this research, the following discussions are held below:
Regarding the decrease of chemical contaminants for operators; in another study, it is pointed out that when implementing the SCADA system, it ensures that the operational conditions of the gas pipeline where natural gas is transported are controlled in real time, efficiently and safely. And in this way it contributes to the reduction of damage to facilities, workers, neighbors and the environment. [12]
Within the same approach in the investigation entitled Automation in the process of industrial painting in the drying stage, it is pointed out that when the control and supervision system was launched, many advantages were observed; Since, this mechanism generated an optimum precision in the drying stage, this was of utmost importance for the factory, since by emitting the toxic chemicals present in the paints in a smaller amount, thus reducing the risk of the health and safety of its personal. [13]
Another investigation with similar results, indicates that the automated system achieved the reduction of particles in the production of detergents, because the system was in charge of optimally controlling and supervising the entire process, generating that the staff has less contact with it (pumps, corrosive and flammable materials), thus achieving a significant increase in operator safety. In addition, it was demonstrated that the control system brings numerous operational, safety, production and monetary benefits. [14]
5. Conclusions
It is concluded that it was possible to determine the influence of the implementation of the industrial network for the control and supervision of the acetic acid dispatch process on the decrease of chemical contaminants for the operators, which is 19.44%; Although this value seems small, it is very significant, since with this decrease, it would be complying with what is established in the regulation of “Permissible Limit Values of Chemical Agents in the Work Environment”.
It is concluded that it was possible to design and implement an industrial network for the control and supervision of the acetic acid dispatch process, through the programming of the Siemens S7-1200 Programmable Logic Controller (PLC) through the SIMATIC STEP 7 Software, and a System of Distributed Control (DCS) Siemens S410, through the PCS7 V 8.1 Software, where the control logic was programmed and the distributed periphery for digital inputs and outputs was implemented to receive and emit signals from the field.
Finally, it is concluded that this project shows a high level of significance of 0.000, in relation to the decrease in acetic acid in the environments; also by means of the normality test we can interpret that the obtained values are 95% reliable, that is to say that the obtained data have a normal distribution; Therefore, the project contributes to occupational health and safety standards for operators and environmental protection.
Acknowledgment
The authors wish to acknowledge and thank the ODFJELL Terminals Group, Mining Chemical Deposits, Lima-Peru.
- Yataco, J. (2019). Design of an industrial network for the control and supervision of the chemical products dispatch process, to reduce the operator’s exposure to harmful vapors, in the company Depósito Químicos Mineros S.A. ”. (Undergraduate thesis). Peruvian Wings University, Lima.
- Colomer, J., Meléndez, J., & Ayza, J. (2010). Introduction to the monitoring and expert supervision of processes. Methods and tools. Spanish Automatic Committee: Automated.
- Cueva, G., & Villa, A. (2019). Design and implementation of a SCADA system for the CEDIT industrial process simulation line, based on a chicken processing chain. (Undergraduate thesis). University of the armed forces, Sangolquí.
- Sandoval, C. (2017). Automation of LACT units for crude oil in the fields. University of the Armed Forces-ESPE, 1-6.
- Estévez, C., & Garcés, I. (2014). Design and simulation of a station to automate the process of emptying and filling with oil the modules of the tools of the Schlumberger company that operate at the bottom of the well during drilling. University of the Armed Forces, 1-8.
- Arnau, J. (1997). Experimental designs in schemes. Barcelona: University of Barcelona.
- Tamayo and Tamayo, M. (2003). The process of scientific research. Mexico: LIMUSA.
- Hernández, R., Fernández, C. B., & Pilar, M. d. (2003). Investigation methodology . Mexico: Mc Graw Hill.
- Landa, M., & Ramírez, M. (2018). Design of a student satisfaction questionnaire for a professional level course under the inverted learning model. Education Pages Magazine.
- Ministry of Health of the Peruvian state (2005). D.S. N ° 015-2005-SA. Perú
- Manterola, C., & Pineda, V. (2008). The value of “p” and the “statistical significance”. Chilean Magazine, 60: 86-9.
- Padilla, I. (2015). Automation of a valve in a sectioning station and in a devil trap of gas pipelines. (Undergraduate thesis). National Polytechnic Institute, Quito.
- Ceballos, J., Hidalgo, S., & Salazar, J. (2014). Automation in the industrial painting process in the drying stage. (Undergraduate thesis). National Polytechnic Institute, Quito.
- Guiterrez, J. (2013). Design of an automated system for the production of disinfectants of a detergent plant. (Undergraduate thesis). Simon Bolivar University, Venezuela.