A Multi-Objective Voltage Optimization Technique in Distribution Feeders with High Photovoltaic Penetration

Adv. Sci. Technol. Eng. Syst. J. 4(6), 377–385 (2019);
 DOI: 10.25046/aj040648
With increasing photovoltaic (PV) penetration on distribution feeders, voltage functions is always a challenge. To control these variations due to the intermittent nature of PV generation,many utility companies use the traditional voltage regulating devices such as ON/OFF load tap changers, voltage regulators, switched capacitor banks and reactors. The use of smart inverters (SI) has been reported to provide a more effective and economical way of voltage regulation on distribution feeder. It then becomes necessary to optimally control the operation of these traditional voltage regulating devices and the SIs. This paper presents a multi-objective technique that minimizes the voltage fluctuation (by implementing conservative voltage reduction), the overall system active power losses and the amount of reactive power injection from the capacitor banks with various constraints on the smart inverter reactive power injection and voltage regulator switching. The proposed algorithm is tested on an IEEE 34 node system with six units of 300kW (400kV A SIs) PVs integrated using real data from an existing 1.4MW PV plant located at FIU. The Pareto optimization results of the proposed algorithm show the various optimal values of the PVs power factor, the voltage regulator settings and the capacitor reactive power injection. Using one of the Pareto optimal solutions, the results show that the system bus voltage profiles, total system power losses and capacitor reactive power injection were e ized.
1. Introduction
For environmental reasons, there has been a consistent increase in global installation of photovoltaic (PV) systems. This is further facilitated by the declining cost of PV modules over the years [1–5]. The increase is PV installations is evident as the financial invest- ments in PV installation globally is also on the rise. The increase in levels of PV penetration have lead to several challenges which include reverse power flow, voltage control issues, power quality issues [6–9] (voltage and current harmonics, flicker, momentaries), protection coordination problems, and possible increase in system losses. [3, 10–12]. Of these issues, voltage control is one of the most important and of concern to utility companies. Traditionally, utility companies uses the legacy devices such as reactors, voltage regulators (VR), ON/OFF load tap changers (OLTC), and switched capacitor bank for voltage control [13, 14]. With the integration of intermittent renewable energy resources such as PV systems, the need for fast and more effective voltage control becomes imperative. According to IEEE 1547-2018 [15, 16], inverter-based DERs such as PVs are allowed to participate in feeder voltage regulation. Ac-
cording to [11, 17, 18], the use of smart inverters (SIs) could provide a more effective and economical way of voltage control especially at high levels of penetration of inverter-based DERs. Voltage op- timization can be carried out with the use of several components in a distribution network. Several devices such as voltage regula- tors, OLTC, switched capacitor banks, reactors, energy storages and recently smart inverters (SI). SIs can be used to make significant im- pact on the voltage profile of the distribution system using the power factor control mode or the Volt-VAR/Watt control mode. With all these devices simultaneously present in the distribution network, there is an obvious need for optimizing their operation and also their interaction in the system. Therefore the optimal coordination of the control operations of the smart inverter and these existing legacy devices becomes necessary. This paper presents a multi-objective voltage control an optimization algorithm which is an extension of a previous work done by the authors in [19]. In order to take the advantage of the reactive power injection by the smart inverter, the reactive power injection by the switched capacitor banks are mini- mized as one of the optimization objectives. The smart inverters are set to constant power factor mode with the optimal value selected between 0.6 − 1 to allow for reactive power injection. The VR and OLTC switching constraints are set within ±16. The other objective functions are to flatten the nodal voltage profile towards the lower threshold of 0.95pu and minimize the overall active power losses in the network. The rest of the paper is organized as follows: Section 2 presents a brief review of existing voltage control and optimization techniques; the proposed optimization algorithm and its formulation is presented in Section 3; Section 4 describes the feeder used as case study and the simulation set up; Section 5 presents the simulation results and their analyses; while Section 6 concludes the paper.
2. Voltage Control and Optimization Methods
Several voltage control techniques have been proposed and reported in literature. Active distribution networks allow for bidirectional flow of active and reactive power due to the integration of distributed renewable energy generators. An evolutionary-based algorithm for LTC and shunt capacitor Scheduling was proposed by authors of [20]. The study was done to minimize the active power loss of the system while keeping the operation of the voltage control devices and the total harmonic distortion within limits. An NREL report and publication by Ding et al [21, 22] developed an iterative optimization algorithm that coordinates the use of SI, LTCs and capacitor banks for optimal voltage regulation while implementing conservative voltage reduction technique as a means of mini zing the total system losses. The impact of the proposed optimization algorithm on the system’s power quality was also analyzed. Reference [23] developed three fuzzy logic controllers that control the OLTC switching, the reactive power sharing (to enable a relaxation of the OLTC switching operation) and reduce the active power curtailment from the integrated distributed generation. Similar to [23], authors of [24] proposed a Volt-VAR optimization (VVO) algorithm that relax the voltage regulators and LTC operations as well as minimizing the amount of PV generation curtailed. The proposed VVO multistage algorithm was compared to the multi-objective VVO. Most of the previously published papers did not optimally choose the SI setting such as its power factor, minimization of reactive power injection by the shunt capacitor banks by allowing more reactive power injection by the SIs, and flattening the system’s voltage profile and implementing conservation voltage reduction by pushing the nodal values to 0.95 pu. To address these research gaps, this paper proposes a multi-objective optimization algorithm that flattens the node voltage profile, minimizes the power loss in the network as well as minimizing the reactive power injection by the capacitor banks by optimally selecting the power factors of the SIs , the tap position of the voltage regulators and LTC as and the amount of reactive power to be injected by the capacitor banks.
3. Formulation of Proposed Optimization Algorithm
Objective functions
The first objective OF1 of the proposed optimization algorithm is to flatten the voltage profile of the network as much as possible and also to make the nodal voltages close to the lower boundary of the ANSI C84.1 voltage range of 0.95pu. The benefit of this approach is to take the advantage of conservative voltage reduction which allows the total load on the network to be reduced by simply lowering the nodal voltages.
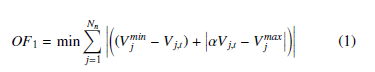 where Vminj and Vmaxj are the minimum and maximum allowable nodal voltages respectively as expressed in equation (4), while α is a factor which is used to make the nodal voltage Vj,t close to Vminj .
Objective 2 (OF2) is minimizes the total active power losses in the network.
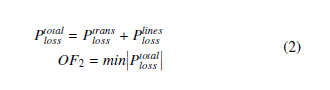 where = Ptransloss is the sum of the active power loss in the trans-
formers and Plinesloss is the sum of the active power loss in the lines.
The third objective (OF3) of this work is to minimize the total amount of reactive power injected by the two capacitor banks connected to buses 844 and 848.
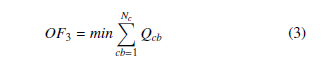 Where Qcb is the capacitor bank reactive power injection and Nc is the total number of capacitor banks in the network.
Constraints Formulation
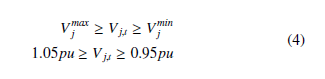
Bus voltage constrains is set to be within the ANSI C84.1 standards.
 Capacitor bank VAR and switching constrains is given as equation (5). The maximum reactive power injection by these capacitors are 300kVAR and 450kVAR according to the values in the feeder parameters.
![]() Typical VRs and OLTCs have 32 tap steps. For each tap step, the change in voltage is typically 0.625%.
Typical VRs and OLTCs have 32 tap steps. For each tap step, the change in voltage is typically 0.625%.
![]() To enable the SIs inject some reactive power into the network in order to allow for some voltage control by the SI, the PF values of the SI are set as variable for the optimization in other to get their optimal values.
To enable the SIs inject some reactive power into the network in order to allow for some voltage control by the SI, the PF values of the SI are set as variable for the optimization in other to get their optimal values.
 Table 1: PV Specifications
| PVs | Maximum | Inverter | Phases | Default PF |
| Power (kW) | (kVA) | |||
| PV1 and PV5 | 300 | 400 | 1 | 0.8 |
| PV2, PV3, PV4 and PV6 | 300 | 400 | 3 | 0.8 |
4. Feeder Test Case and Simulation
In order to validate the effectiveness of the proposed multi-objective optimization technique, six PVs with specifications as shown in table 1 are integrated to an IEEE 34 node distribution feeder (as shown in figure 1). For each of the PVs, a minute resolution actual global horizontal irradiance and temperature data (as shown in figures 2 and 3 respectively) are used as input to estimate the power output of the six PVs. The PV locations were selected a little farther from the substation transformer where there is a potential for some voltage regulation issues.
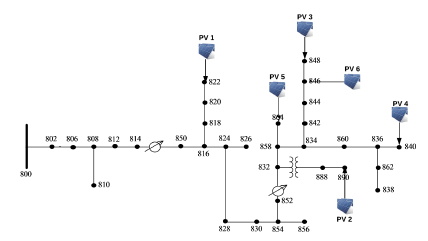 Figure 1: IEEE 34 node test feeder with PV locations
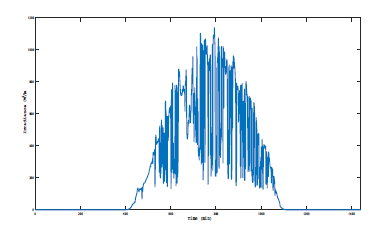 Figure 2: 1-minute resolution global horizontal irradiance profile of the location used for the simulation
5. Simulation results and Analysis
The PV integrated IEEE feeder was modelled using the OpenDSS software with the optimization algorithm developed with MATLAB. A time series simulation with a total time step of 1440 minutes was
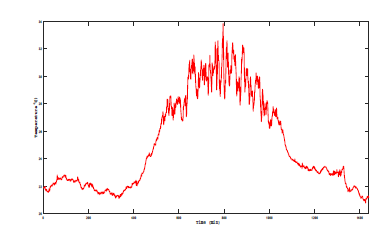 Figure 3: 1-minute resolution temperature data of the location used for the simulation
carried out. Based on the three objective functions formulated, the Pareto fronts for the 24 hour optimization are plotted as shown in figures 4, 5 and 6. The Pareto fronts show the several optimal solutions available for the multi-objective optimization.
Based on the objective of highest priority, the values of the variables which are the tap settings of the LTCs, power factor of the PVs, reactive power injection of the capacitor banks, can be selected. For example, if the objective of highest priority is to have the minimum amount of losses (OF2) in the network the Pareto optimal values with their corresponding decision variables is as presented in tables 2 and 3. The loss minimization objective presented in tables 2 and 3 show the optimal values of the tap settings of the LTCs, power factor of the PVs, reactive power injection of the capacitor banks that will achieve the minimum amount of losses in the network. Using the optimal values acquired from the optimization algorithm, the nodal voltages of the network were simulated. The nodal voltages of buses (single phase buses) 822 and 864 are as shown in figures 9a-9b respectively while the nodal voltage for buses 840, 846, 848 and 890 are as shown figures 7, 8, 10 and 11 respectively.
The voltage profile on these buses clearly show the effectiveness of the proposed optimization algorithm. The bus voltage profiles were adequately reduced without going below the ANSI C84.1 standard voltage level of 0.95pu. As mentioned earlier, this was done to implement the benefits of Conservative voltage reduction which can be effectively used to reduce the total load on the network as well as minimize the total system power loss. Also, as shown in figure 11, the un-optimized voltage profile of bus 890 was increased from less than the minimum 0.95pu to values above the minimum 0.95pu.
Figure 12 show the un-optimized and optimized total system losses. The figure clearly shows the there is consistent reduction in the overall system losses after optimization. Figure 13 shows the capacitor reactive power with and without the use of the proposed optimization algorithm. The value of the kVAR injection by the capacitor banks were consistently reduced which further shows the effectiveness of the proposed optimization algorithm.
6. Conclusions
With the consistent rise in PV penetration on distribution feeders, effective voltage regulation and optimization using Volt-VAR control becomes very important. This paper presented a multi-objective optimization using the existing network legacy devices (switched
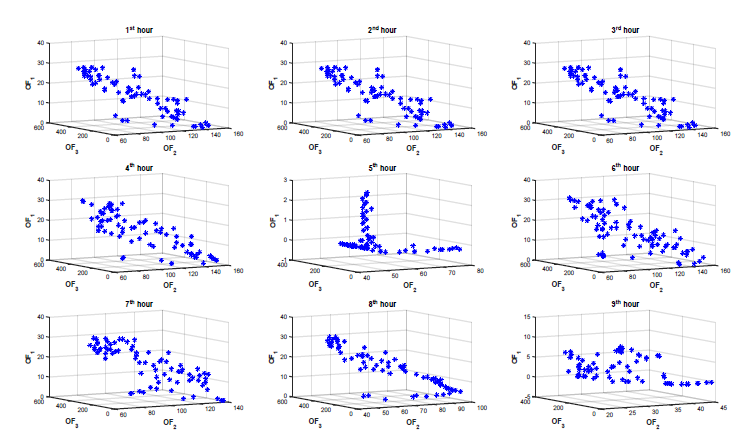 Figure 4: Hourly Pareto optimization curve for the optimized objective functions
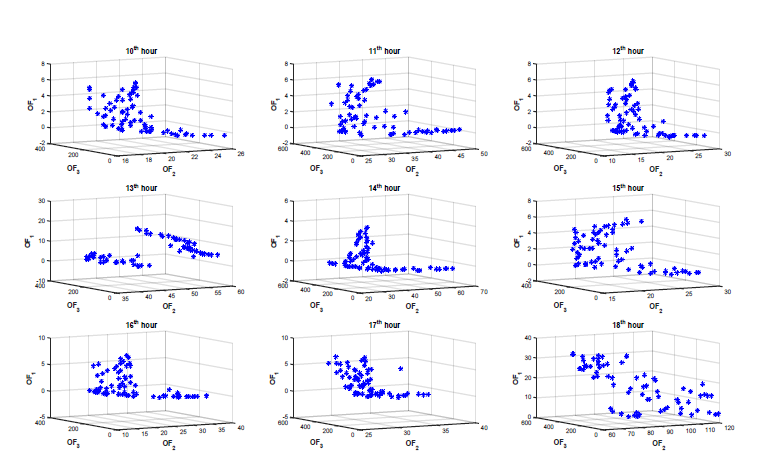 Figure 5: Hourly Pareto optimization curve for the optimized objective functions
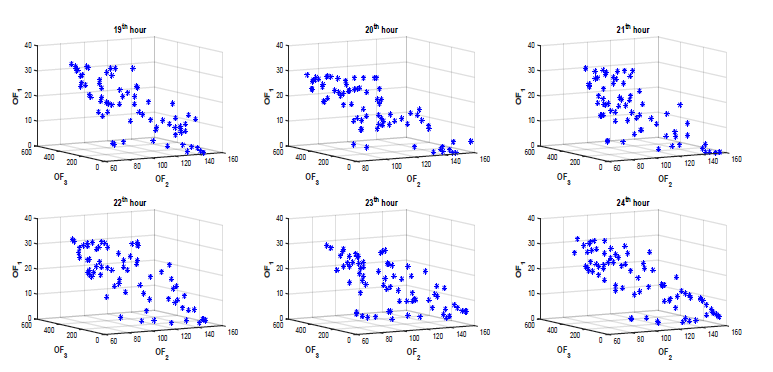 Figure 6: Hourly Pareto optimization curve for the optimized objective functions
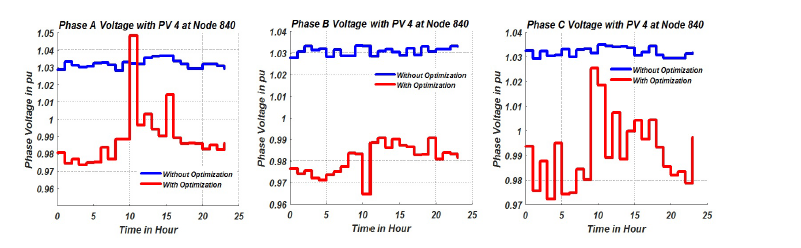 Figure 7: Voltage Profile of Node 840
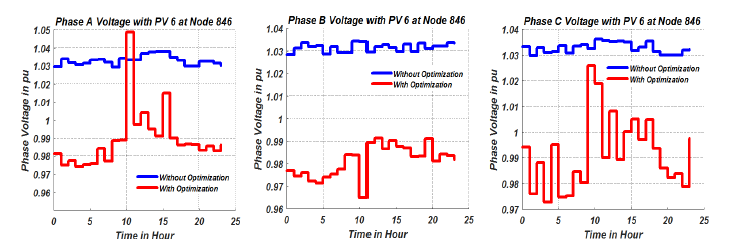 Figure 8: Voltage Profile of Node 846
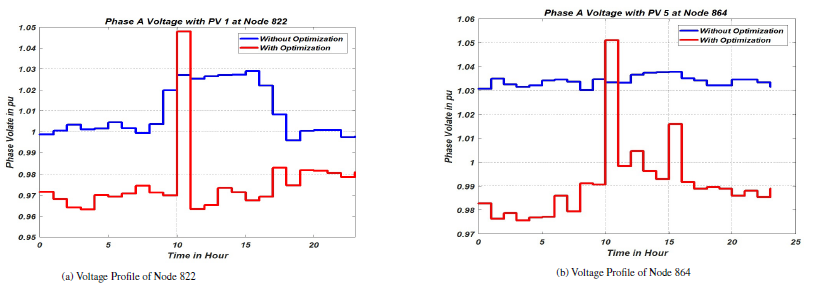 Figure 9: Voltage profiles of Nodes 822 and 864
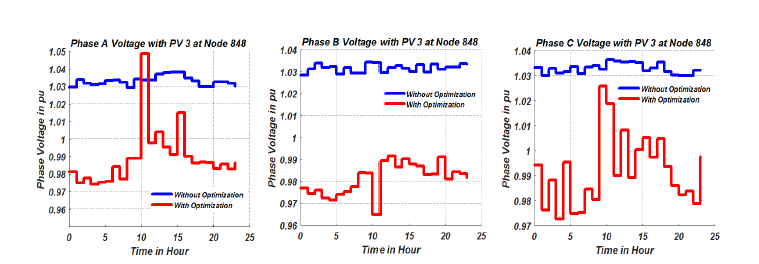 Figure 10: Voltage Profile of Node 848
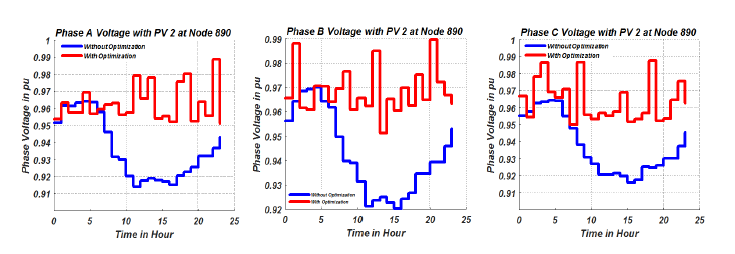 Figure 11: Voltage Profile of Node 890
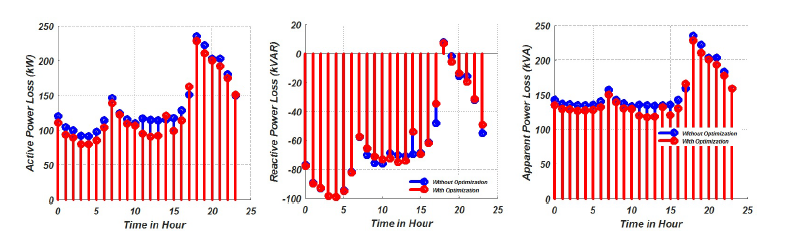 Figure 12: Hourly losses in the system
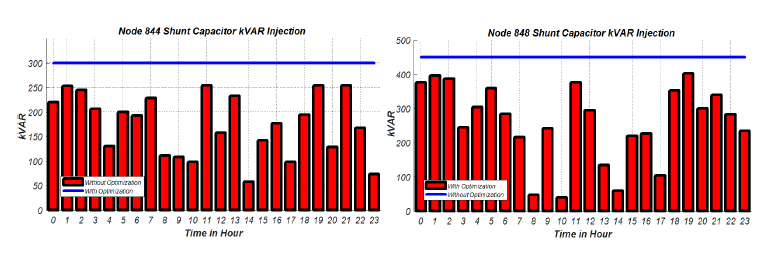 Figure 13: kVAR injection on nodes 844 and 848 by shunt capacitors
Table 2: Hourly Pareto optimal values with minimum system looses
| Hour | OF1 | OF2 (kW) | OF3 (kVAR) | VR1(pu) | VR2(pu) | ||||
| PhA | PhB | PhC | PhA | PhB | PhC | ||||
| 1 | 29.2225 | 77.8766 | 483.3489 | 0.9250 | 0.9500 | 0.9563 | 0.9028 | 0.9083 | 0.9093 |
| 2 | 29.2225 | 77.8766 | 483.3489 | 0.9250 | 0.9500 | 0.9563 | 0.9028 | 0.9083 | 0.9093 |
| 3 | 29.2225 | 77.8766 | 483.3489 | 0.9250 | 0.9500 | 0.9563 | 0.9028 | 0.9083 | 0.9093 |
| 4 | 30.5524 | 76.6284 | 458.7750 | 0.9250 | 0.9563 | 0.9563 | 0.9043 | 0.9162 | 0.9114 |
| 5 | 2.6370 | 42.8064 | 26.2413 | 1.0063 | 0.9625 | 1.000 | 0.9913 | 0.9903 | 0.9771 |
| 6 | 32.0493 | 75.6853 | 560.9548 | 0.9000 | 0.9438 | 0.9063 | 0.9406 | 0.9186 | 0.9094 |
| 7 | 30.4924 | 78.3439 | 540.5442 | 0.9125 | 0.9125 | 0.9250 | 0.9487 | 0.9086 | 0.9580 |
| 8 | 31.9572 | 46.2742 | 424.1565 | 0.9125 | 0.9188 | 0.9000 | 0.9081 | 0.9156 | 0.9031 |
| 9 | 6.9547 | 23.7373 | 341.3215 | 0.9938 | 1.0063 | 0.9625 | 0.9567 | 0.9528 | 0.9406 |
| 10 | 5.5729 | 17.0715 | 282.4728 | 0.9875 | 0.975 | 0.9813 | 1.0312 | 0.9834 | 0.9344 |
| 11 | 6.2144 | 26.3293 | 291.0744 | 0.9750 | 0.9938 | 0.9750 | 0.9900 | 0.9558 | 0.9468 |
| 12 | 5.5438 | 14.4402 | 208.2059 | 1.0500 | 1.0000 | 0.9750 | 1.0365 | 0.9530 | 0.9344 |
| 13 | 5.9157 | 38.151 | 275.5213 | 0.9813 | 0.9938 | 1.0125 | 0.9844 | 0.9778 | 0.9341 |
| 14 | 3.6769 | 23.0707 | 109.9043 | 1.0188 | 0.9563 | 0.9938 | 1.0098 | 0.9844 | 0.9509 |
| 15 | 5.1211 | 15.9318 | 245.9954 | 1.0000 | 1.0063 | 1.0063 | 1.0099 | 0.9411 | 0.9156 |
| 16 | 5.797 | 12.5233 | 228.1546 | 1.0688 | 0.9688 | 0.9500 | 1.0213 | 0.9782 | 0.9541 |
| 17 | 6.4897 | 25.0358 | 299.8558 | 0.9813 | 1.0250 | 1.0188 | 0.9703 | 0.9342 | 0.9021 |
| 18 | 33.58 | 66.7876 | 466.7909 | 0.9000 | 0.9000 | 0.9000 | 0.9342 | 0.9468 | 0.9233 |
| 19 | 33.5301 | 75.1029 | 562.8816 | 0.9000 | 0.9063 | 0.9063 | 0.9594 | 0.9022 | 0.9405 |
| 21 | 32.9089 | 74.7385 | 494.4018 | 0.9063 | 0.9250 | 0.9188 | 0.9460 | 0.9031 | 0.9085 |
| 22 | 32.3954 | 77.4375 | 566.4084 | 0.9188 | 0.9063 | 0.9 | 0.9578 | 0.9219 | 0.9280 |
| 23 | 29.8817 | 79.9226 | 576.6802 | 0.9063 | 0.9438 | 0.925 | 0.915 | 0.9562 | 0.9154 |
| 24 | 33.4353 | 73.2124 | 496.9962 | 0.9000 | 0.9188 | 0.9313 | 0.9275 | 0.9086 | 0.9094 |
Table 3: Hourly Pareto optimal values with minimum system looses
| Hour | Cap1 | Cap2 | PV1 | PV2 | PV3 | PV4 | PV5 | PV6 |
| (kVAR) | (kVAR) | (pu) | (pu) | (pu) | (pu) | (pu) | (pu) | |
| 1 | 224.9997 | 258.3492 | 0.7473 | 0.6684 | 0.7505 | 0.8664 | 0.7011 | 0.7987 |
| 2 | 224.9997 | 258.3492 | 0.7473 | 0.6684 | 0.7505 | 0.8664 | 0.7011 | 0.7987 |
| 3 | 224.9997 | 258.3492 | 0.7473 | 0.6684 | 0.7505 | 0.8664 | 0.7011 | 0.7987 |
| 4 | 251.9337 | 206.8413 | 0.7418 | 0.8002 | 0.7258 | 0.8058 | 0.7102 | 0.8987 |
| 5 | 14.2472 | 11.9942 | 0.9885 | 0.8909 | 0.9125 | 0.9063 | 0.9232 | 1.0000 |
| 6 | 245.1979 | 315.7568 | 0.8264 | 0.8950 | 0.6728 | 0.9998 | 0.6260 | 0.9511 |
| 7 | 214.3476 | 326.1966 | 0.7864 | 0.7001 | 0.6404 | 0.8971 | 0.7616 | 0.9258 |
| 8 | 274.3781 | 149.7784 | 0.7423 | 0.6425 | 0.9912 | 0.6334 | 0.8202 | 1.000 |
| 9 | 186.6092 | 154.7122 | 0.9425 | 0.6218 | 0.9984 | 0.9275 | 0.9818 | 1.0000 |
| 10 | 156.2404 | 126.2324 | 0.9636 | 0.7052 | 0.9941 | 0.917 | 0.9563 | 1.0000 |
| 11 | 162.369 | 128.7054 | 0.9503 | 0.6230 | 0.9753 | 0.8125 | 0.97 | 1.0000 |
| 12 | 109.2072 | 98.9987 | 0.9600 | 0.7317 | 0.9335 | 0.8969 | 0.9441 | 1.0000 |
| 13 | 122.0062 | 153.5151 | 0.9180 | 0.6195 | 0.8228 | 0.8295 | 0.9041 | 0.9102 |
| 14 | 26.4984 | 83.406 | 0.9811 | 0.8656 | 0.9427 | 0.9261 | 0.9378 | 1.0000 |
| 15 | 158.5989 | 87.3964 | 0.9625 | 0.7206 | 0.982 | 0.8842 | 0.9549 | 1.0000 |
| 16 | 141.6355 | 86.5191 | 0.9626 | 0.7743 | 0.9764 | 0.907 | 0.9592 | 1.0000 |
| 17 | 248.5619 | 51.2939 | 0.9468 | 0.6161 | 0.9694 | 0.8809 | 0.9735 | 1.0000 |
| 18 | 258.3798 | 208.411 | 0.7905 | 0.7331 | 0.9245 | 0.9227 | 0.6792 | 0.9354 |
| 19 | 239.9177 | 322.9638 | 0.9139 | 0.9348 | 0.8009 | 0.6829 | 0.9638 | 0.9188 |
| 20 | 273.3147 | 292.659 | 0.9998 | 0.9995 | 0.9999 | 0.9953 | 0.9777 | 0.9625 |
| 21 | 66.8531 | 427.5486 | 1.0000 | 0.9572 | 0.9994 | 0.7732 | 0.8599 | 0.9279 |
| 22 | 279.084 | 287.3244 | 0.9844 | 0.8301 | 0.9429 | 0.9452 | 0.898 | 0.9918 |
| 23 | 259.5105 | 317.1697 | 0.8380 | 0.8885 | 0.7520 | 0.6924 | 0.9566 | 0.7904 |
| 24 | 231.0427 | 265.9535 | 0.8280 | 0.7944 | 0.9795 | 0.9783 | 0.8495 | 0.9990 |
capacitor banks, voltage regulators and LTCs) and respective power injection from smart inverters. The proposed algorithm minimizes the voltage fluctuation (by implementing conservative voltage reduction), the total system losses, and the amount of reactive power injection by the switched capacitor banks. The Pareto optimization results showed that by selecting the objective of highest priority, the values of the voltage regulators’ tap position, reactive power injection from the capacitor banks and the power factor value of the smart inverters can be effectively selected. Using one of the Pareto optimal solutions, the bus voltage profiles, system power loss and the capacitor bank reactive power injection were simulated. The results showed the effectiveness of the proposed multi-objective algorithm.
Acknowledgment
The work is a outcome of the research supported by the U.S. National Science Foundation under the grant Numbers 1553494 and 1441223.
- International Renewable Energy Agency. Data and Statistics – IRENA Resource. [Online]. Available: https://www.irena.org/en/solar
- T. Olowu, H. Jafari, S. Dharmasena, and A. I. Sarwat, “Photovoltaic fleet aggregation and high penetration: A feeder test case,” in SoutheastCon 2019, April 2019, pp. 1–6.
- T. O. Olowu, A. Sundararajan, M. Moghaddami, and A. I. Sarwat, “Fleet aggregation of photovoltaic systems: A survey and case study,” in 2019 IEEE Power Energy Society Innovative Smart Grid Technologies Conference (ISGT), Feb 2019, pp. 1–5.
- A. Sundararajan, T. O. Olowu, L. Wei, S. Rahman, and A. I. Sarwat, “Case study on the effects of partial solar eclipse on distributed pv systems and management areas,” IET Smart Grid, vol. 2, no. 3, pp. 477–490, 2019.
- F. Ariyo, B. Famutimi, T. Olowu, S. Akintade, and A. Abbas, “Web-based application for the sizing of a photovolatic (pv) solar power system,” American J. Eng. Res.(AJER), vol. 5, pp. 219–222, 2016.
- S. Rahman, M. Moghaddami, A. I. Sarwat, T. Olowu, and M. Jafaritalarposhti, “Flicker estimation associated with pv integrated distribution network,” in SoutheastCon 2018, April 2018, pp. 1–6.
- A. Sundararajan, T. O. Olowu, L. Wei, S. Rahman, and A. I. Sarwat, “Case study on the effects of partial solar eclipse on distributed pv systems and management areas,” IET Smart Grid, May 2019. [Online]. Available: https://digital-library.theiet.org/content/journals/10.1049/iet-stg.2019.0002
- M. Jafari, T. O. Olowu, A. I. Sarwat, and M. A. Rahman, “Study of smart grid protection challenges with high photovoltaic penetration,” in 2019 North American Power Symposium (NAPS), Oct. 2019, pp. 1–6.
- A. I. Sarwat, A. Sundararajan, I. Parvez, M. Moghaddami, and A. Moghadasi, “Toward a smart city of interdependent critical infrastructure networks,” in Sustainable Interdependent Networks. Springer, 2018, pp. 21–45.
- T. Olowu, A. Sundararajan, M. Moghaddami, and A. Sarwat, “Future chal- lenges and mitigation methods for high photovoltaic penetration: A survey,” Energies, vol. 11, no. 7, p. 1782, 2018.
- M. Chamana, B. H. Chowdhury, and F. Jahanbakhsh, “Distributed control of voltage regulating devices in the presence of high pv penetration to miti- gate ramp-rate issues,” IEEE Transactions on Smart Grid, vol. 9, no. 2, pp. 1086–1095, March 2018.
- A. Anzalchi, A. Sundararajan, A. Moghadasi, and A. Sarwat, “High-penetration grid-tied photovoltaics: Analysis of power quality and feeder voltage profile,”IEEE Industry Applications Magazine, vol. 25, no. 5, pp. 83–94, 2019.
- M. Jafari, T. O. Olowu, and A. I. Sarwat, “Optimal smart inverters volt-var curve selection with a multi-objective volt-var optimization using evolutionary algorithm approach,” in 2018 North American Power Symposium (NAPS), Sep. 2018, pp. 1–6.
- T. Olowu, H. Hassan, M. Moghaddami, and A. I. Sarwat, “Physics-based de- sign optimization of high frequency transformers for solid state transformer applications,” in 2019 IEEE Industry Applications Society Annual Meeting (IAS). IEEE, 2019, pp. 1–6.
- IEEE Standards Coordinating Committee 21, “IEEE standard for intercon- nection and interoperability of distributed energy resources with associated electric power systems interfaces,” IEEE Std 1547-2018 (Revision of IEEE Std 1547-2003), pp. 1–138, April 2018.
- T. Olowu, S. Dharmasena, and A. I. Sarwat, “Bidirectional ac/dc converter topologies: A review,” in SoutheastCon 2019, April 2019, pp. 1–6.
- F. Ding, A. Pratt, T. Bialek, F. Bell, M. McCarty, K. Atef, A. Nagarajan, and
P. Gotseff, “Voltage support study of smart pv inverters on a high-photovoltaic penetration utility distribution feeder,” in 2016 IEEE 43rd Photovoltaic Spe- cialists Conference (PVSC), June 2016, pp. 1375–1380. - A. Aghazadeh, M. Jafari, N. Khodabakhshi-Javinani, H. Nafisi, and H. Jabbari Namvar, “Introduction and advantage of space opposite vectors modulation utilized in dual two-level inverters with isolated dc sources,” IEEE Transactions on Industrial Electronics, vol. 66, no. 10, pp. 7581–7592, Oct 2019.
- T. O. Olowu, M. Jafari, and A. I. Sarwat, “A multi-objective optimization technique for volt-var control with high pv penetration using genetic algorithm,” in 2018 North American Power Symposium (NAPS), Sep. 2018, pp. 1–6.
- A. Ulinuha, M. A. S. Masoum, S. Member, S. M. Islam, and S. Member, “Op- timal Scheduling of LTC and Shunt Capacitors in Large Distorted Distribution Systems Using Evolutionary-Based Algorithms,” vol. 23, no. 1, pp. 434–441, 2008.
- F. Ding, A. Nagarajan, S. Chakraborty, A. Nguyen, S. Walinga, M. Mccarty,
• Ding, A. Nagarajan, and S. Chakraborty, “Photovoltaic Impact Assessment of Smart Inverter Volt-VAR Control on Distribution System Conservation Voltage Reduction and Power Quality Photovoltaic Impact Assessment of Smart Inverter Volt-VAR Control on Distribution System Conservation Voltage Reduction and Power Quality,” no. December, 2016. - F. Ding, A. Nagarajan, M. Baggu, A. Nguyen, S. Walinga, M. Mccarty, and
• Bell, “Application of Autonomous Smart Inverter Volt-VAR Function for Voltage Reduction Energy Savings and Power Quality in Electric Distribution Systems Preprint,” no. April, 2017. - M. Abdelkhalek Azzouz, H. E. Farag, and E. F. El-Saadany, “Real-time fuzzy voltage regulation for distribution networks incorporating high penetration of renewable sources,” IEEE Systems Journal, vol. 11, no. 3, pp. 1702–1711, Sep. 2017.
- M. Chamana and B. H. Chowdhury, “Optimal voltage regulation of distribution networks with cascaded voltage regulators in the presence of high pv penetra- tion,” IEEE Transactions on Sustainable Energy, vol. 9, no. 3, pp. 1427–1436,
July 2018.