Experimental Analysis in Alternate Current and Direct Current of the Operating Parameters of a Universal Single-Phase Engine
Volume 4, Issue 6, Page No 360-370, 2019
Author’s Name: Omar Freddy Chamorro Atalayaa), Nel Yuri Huaita Ccallo, Luis Enrique Rojas Vicuña, Rudy Jesús Capa Ilizarbe, José Arturo Pillco Torres, José Jean Franco Ramos Rupay
View Affiliations
Faculty of Engineering and Management, Universidad Nacional Tecnológica de Lima Sur, Perú
a)Author to whom correspondence should be addressed. E-mail: omar_chamorro1@hotmail.com
Adv. Sci. Technol. Eng. Syst. J. 4(6), 360-370 (2019); ![]() DOI: 10.25046/aj040646
DOI: 10.25046/aj040646
Keywords: Engine, Direct current, Alternate Current, Variac, Par motor, Efficiency, Torque, Power Factor

Export Citations
This article presents the experimental analysis of a rotary machine, Universal Motor Analysis; analysis that obeys the purpose of obtaining the almost perfect understanding of the electromechanical behavior of said unit of analysis; It should be noted that the variables to be analyzed were: voltage, current, power, torque, rpm, and power factor; specifically said data will lead to determine the regression model for each of the parameters measured, through the modification of its determination factor. Thus, an analysis of the correlational type was also performed among the variables collected above; finally, through a comparative analysis between engine efficiency during the alternative and continuous signal admission, the fuel efficiency of 91.03% will be determined in the first case, while in the second case, an efficiency of 96.66% was found; being able in this way to determine that the efficiency is greater in 5.63%, in Direct current (DC) compared to the application of Alternating current (AC).
Received: 08 October 2019, Accepted: 01 December 2019, Published Online: 16 December 2019
1. Introduction
In recent decades, electric motors have increasingly become an element widely used in various applications. They are presented in a wide variety of use, going from the use generally in the industry to find them in homes, in addition to remote applications of research on land, in the air, in the water and, finally, in space, each with its own characteristics and specific protections. [1]
It is estimated that worldwide energy consumption in the industry due to the use of electric machines is in the range of 50 to 80% of the total. However, the operating conditions are increasingly demanding, therefore it is necessary to develop new proposals for operation, control and protection. [2] Electric motors are one of the main applications of Electric Power. Motors are the heart of machines and devices in general. [3]
Electric motors powered by direct current (DC: Continuous Current) have multiple applications and although they are already 125 years old, they have adapted very well to the demands of the market. [4] The electric motor operates through electromagnetic interactions, given its electromechanical characteristics. [5]
The DC motor in certain applications require a large turning force at the start of the motor; In that sense DC motors due to their high starting torque are more suitable; Since their torque is high, they break the inertia that the load to displace during start-up can exert. [6]
The universal single-phase motor, specifically, is a very useful rotary electric machine in the industry and in daily life, for applications where more torque is required per amp and a speed control by voltage as it occurs in machining machines, drills, among others. [7]
In their small power design they are widely used in household appliances, with more powerful powers are used in electric traction at a frequency ranging from 50Hz to 60Hz. [8]
When an electromechanical system requires high revolutions, power and, above all, a high starting torque, the universal motor is usually selected. [9]
There are criteria in the motors in direct current and others in alternating current, which handle in different aspects both in the design of the structure, the variations in operating speeds, maintenance periods, among others. [10]
The appeal of this type of electric motor lies in the type of power available, be it VAC (alternating current voltage) or VDC (direct current voltage); reason for what is generally referred to as “Universal Motor”. The constitution of this motor is of similar provisions that the DC series motor (direct current) with an armature (rotor or armature) and an inductor (stator), being able to control its speed using rheostats or any device that manages to control the voltage supplied as It comes in the DC motor. [10]
There are several analysis criteria involved in the operation of the universal motor that operate when operating this type of electric machine, this paper presents the experimental analysis of the internal behavior that this particular motor presents; by means of a raised electrical circuit that contains certain measurement and control devices, given a source of electrical network, part of the experimentation is carried out evaluating independent electrical parameters based on the modified supply voltage, considering the forms of motor operations in VDC and VAC. in a vacuum, identifying the expression of the function with respect to another study variable and the comparative analysis of efficiencies in both feeding systems.
2. Methodology
2.1. Data collection and analysis process
This research contains a series ofguidelines the same that is based on three concrete stages for the process of collecting and analyzing data.
These stages are: previous considerations, alternating current experimentation and direct current experimentation.
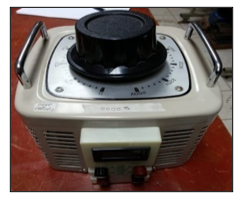 Figure 1: Stages of the data collection and analysis process.
The instrument used in the investigation was the technical data sheet, where the characteristics of the variables are detailed: voltage, current, power, torque, rpm, and power factor; of a rotary machine, called Universal Motor.
Table 1: Technical Characteristics of the Drill (Universal Engine in Analysis)
| Percussion drill | |||
| Nominal voltage | r.m.s | 230 | |
| Nominal intensity | A | 3,4 | |
| Nominal absorbed power | W | 750 | |
| Useful power | W | 380 | |
| Revolutions in vacuum | min-1 | 0-2800 | |
| Nominal revolutions | min-1 | 1750 | |
| Nominal frequency | Hz | 50 | |
| Nominal turn torque | Nm | 2,3 | |
| Efficiency or performance | % | 51 | |
2.2. Stage of previous considerations
It was considered a conventional hammer drill to which a VARIAC variable potential difference of alternating current (VAC) was applied, which was referred to throughout our analysis as an independent variable.
During this stage, relationships were established between independent variables vs dependent variables for the recording of electrical values by evaluating the degree of dependency ratio during the full period until establishing nominal electrical parameters, recommended in the data sheet of such a drill.
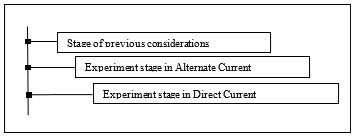 Figure 2: VARIAC voltage regulator.
For the connection it is considered an alternate power supply provided to us by the local network 220 VAC 60 Hz, however, for experimentation it is required to vary the voltage (r.m.s) gradually to extract samples from electrical parameters such as: voltage, intensity, power, power factor, rpm, between others; given this requirement, a VARIAC illustrated in Figure 2 was used, which is determined by a transformer.
At the output of this VARIAC is connected the load that would come to be the drill that in diagram is represented by: a resistance, an inductance and a rotor. Where the first two represent the stator fields representing and the last to the winding rotor. The instrumentation regarding data collection was considered a DT2235A digital tachometer, an oscilloscope, two measuring modules multifunctional, which allows permanent monitoring of parameters such as: voltage, intensity, power and factor.
Instrumentation respect to the connection of the measuring module are considered the typical connections of an Ammeter, Voltmeter, Wattmeter, Cosfimeter; where these readings are taken at the INPUT of the VARIAC and the second module is connected at the pre-load point.
2.3. Experiment stage in Alternate Current
A typical electrical circuit was developed, outlined in Figure 3.
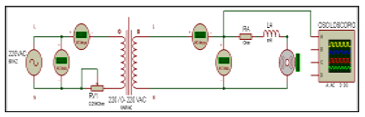 Figure 3: Universal motor diagram powered by AC.
Also, the connection of the oscilloscope is considered a typical connection where the channel is phased and the neutral is considered ground point of the instrument.
Exerting control on the universal motor of the drill by voltage variation; permanent control is obtained at all times of extraction of samples represented in Figure 4, it should be noted that the measured dependent parameters were: torque, power, rpm (revolutions per minute); correspondence tables are established after this to possess an order during the experimentation stage.
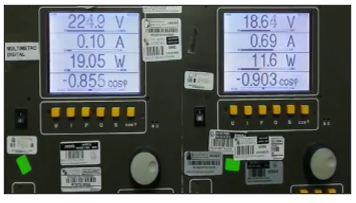 Figure 4: Electrical parameters per digital measurement module.
Regarding the values obtained from the rotational revolutions (rpm) of the drill, the digital tachometer was used to extract rotation data from the rotor, as depicted in the Figure 5.
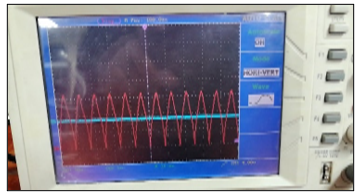 Figure 5: Parameter of the revolutions obtained by tachometer.
The behavior of the sine wave in Figure 6, which represents the voltage whenbeing altered by alternating current in the oscilloscope, was even contrasted.
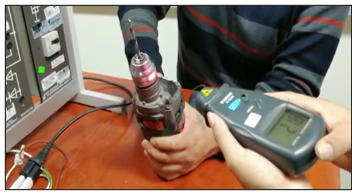 Figure 6: Analysis of the motor with the application of an Alternate Voltage.
2.4. Experiment stage in Direct Current
A new source of variable potential difference was applied, but this time of continuous order (VDC) performing the same detailed analysis lines above.
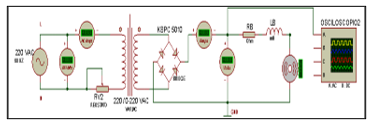 Figure 7: Universal motor diagram powered by DC.
In the VDC diagram in Figure 7, it is considered the same connections detailed above with the proviso that at the output of the VARIAC is connected a solid state component called bridge diode KBPC5010 rectifier and at the output of this polarities are set since you get a VDC voltage called pulsating continuous corrient, and the latter goes straight to load, that is the drill, however, between this section of bridge diode is connected the measuring instruments as detailed in the instrumentation point. [7]
With regard to the tachometer as detailed in instrumentation point, however, the oscilloscope, shown in Figure 8, is connected between channel to the positive rectifier diode and the negative to GND.
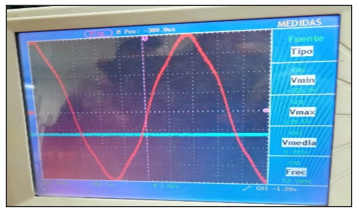 Figure 8: Engine analysis with the application of a pulsating Voltage.
3. Results
All electrical measurements, developed in both types of power supply, were established in the relevant modules and typical instruments; such results are exposed in tables using the Excel computing tool and the graph of the regression models obtained with the SPSS statistical software, for each parameter experienced electrical laboratory.
3.1. Electric parameters of the universal engine test
Before data representation, specific criteria presented by the firing hole are considered, as required in Table 1; the technical data of this percussion drill, presents a nominal torque of 2.3 N.m. and the useful power of 380 W. It should be noted that during the start-up of the universal engine in order to obtain its operating parameters, it was worked on the upper and lower margins of the torque and utility power; thus not to expose to possible damage to the drill in study.
In addition, the calculation of the torque of the “Tm” engine was performed, using the expression of mechanical power of the shaft, whose units expressed in the international system (N.m):
 Where:
- : Engine output power.
- : Induced rotation speed.
The calculation of the power absorbed by the power grid in alternating current and direct current, if the case of pulsating VDC, its analysis is somewhat extended; therefore, it is considered quasi-alternative behavior.
 3.2. Universal Motor in alternate current
The register was detailed by the independent variable of the voltage regulated by the VARIAC with values from 10V to the rated voltage of the motor, the voltage data shown is the modified in full engine start.
Table 2: Electrical parameters obtained by modified voltage in AC
| Drill electrical tests in AC. | ||||||
| Item | Inpur (Supply) – AC | Axis | Value | |||
| Voltage (r.m.s) | Current (A) | Power (W) | F.P.
(cos) |
Rpm | Torque (N.m) | |
| 1 | 10.19 | 0.11 | 0.3 | 0.28 | 0 | 0.000 |
| 2 | 20.19 | 0.30 | 2.3 | 0.38 | 0 | 0.000 |
| 3 | 29.50 | 0.48 | 5.2 | 0.37 | 0 | 0.000 |
| 4 | 32.10 | 0.48 | 5.6 | 0.36 | 29 | 1.844 |
| 5 | 34.50 | 0.52 | 7.3 | 0.41 | 86 | 0.811 |
| 6 | 36.90 | 0.53 | 10.2 | 0.52 | 200 | 0.487 |
| 7 | 37.80 | 0.54 | 10.9 | 0.53 | 225 | 0.463 |
| 8 | 39.10 | 0.55 | 12.6 | 0.58 | 313 | 0.384 |
| 9 | 44.20 | 0.59 | 17.8 | 0.68 | 390 | 0.436 |
| 10 | 50.10 | 0.61 | 22.4 | 0.74 | 445 | 0.481 |
| 11 | 53.80 | 0.63 | 26.5 | 0.79 | 630 | 0.402 |
| 12 | 58.60 | 0.65 | 30.9 | 0.81 | 700 | 0.422 |
| 13 | 63.10 | 0.66 | 35.2 | 0.84 | 800 | 0.420 |
| 14 | 69.00 | 0.69 | 41.1 | 0.86 | 890 | 0.441 |
| 15 | 72.70 | 0.71 | 45.1 | 0.87 | 950 | 0.453 |
| 16 | 77.90 | 0.72 | 50.0 | 0.89 | 1000 | 0.478 |
| 17 | 82.70 | 0.73 | 54.4 | 0.90 | 1130 | 0.460 |
| 18 | 88.10 | 0.74 | 59.4 | 0.91 | 1210 | 0.469 |
| 19 | 93.30 | 0.77 | 66.4 | 0.92 | 1270 | 0.499 |
| 20 | 98.50 | 0.78 | 71.0 | 0.93 | 1380 | 0.491 |
| 21 | 107.70 | 0.81 | 81.3 | 0.93 | 1490 | 0.521 |
| 22 | 117.80 | 0.84 | 94.0 | 0.95 | 1630 | 0.551 |
| 23 | 126.90 | 0.89 | 107.5 | 0.95 | 1750 | 0.587 |
| 24 | 138.10 | 0.95 | 124.6 | 0.95 | 1850 | 0.643 |
| 25 | 146.60 | 0.99 | 138.2 | 0.96 | 1944 | 0.679 |
| 26 | 157.40 | 1.02 | 154.1 | 0.96 | 2060 | 0.714 |
| 27 | 168.50 | 1.05 | 170.7 | 0.96 | 2180 | 0.748 |
| 28 | 177.90 | 1.10 | 187.4 | 0.96 | 2265 | 0.790 |
| 29 | 187.00 | 1.14 | 204.8 | 0.96 | 2361 | 0.828 |
| 30 | 197.70 | 1.17 | 223.6 | 0.97 | 2439 | 0.876 |
3.3. Universal motor in direct current
The value register was similarly detailed by the voltage-independent variable regulated by the VARIAC applying the same voltage regulation criterion, the voltage data have also the modified voltage in engine operation.
Table 3: Electrical parameters obtained by modified voltage in DC
| Drill Electrical Tests In DC | ||||||
| Item | Input (Supply) – Dc | Axis | Value | |||
| Voltage (r.m.s) | Current (A) | Power (W) | F.P. (cos) | Rpm | Torque (N.m) | |
| 1 | 13.61 | 0.59 | 7.2 | 0.90 | 0 | 0.000 |
| 2 | 13.68 | 0.57 | 7.0 | 0.90 | 115 | 0.581 |
| 3 | 18.66 | 0.59 | 9.9 | 0.91 | 207 | 0.457 |
| 4 | 22.95 | 0.61 | 12.8 | 0.92 | 280 | 0.437 |
| 5 | 29.00 | 0.63 | 17.0 | 0.93 | 355 | 0.457 |
| 6 | 33.60 | 0.66 | 20.5 | 0.93 | 435 | 0.450 |
| 7 | 39.00 | 0.69 | 25.0 | 0.94 | 517 | 0.462 |
| 8 | 44.20 | 0.72 | 30.1 | 0.94 | 575 | 0.500 |
| 9 | 48.10 | 0.73 | 33.3 | 0.94 | 635 | 0.501 |
| 10 | 53.30 | 0.77 | 39.0 | 0.95 | 702 | 0.531 |
| 11 | 58.40 | 0.78 | 43.1 | 0.95 | 770 | 0.535 |
| 12 | 62.50 | 0.80 | 47.5 | 0.95 | 822 | 0.552 |
| 13 | 68.10 | 0.81 | 52.8 | 0.95 | 912 | 0.553 |
| 14 | 73.80 | 0.83 | 58.3 | 0.96 | 974 | 0.572 |
| 15 | 77.50 | 0.84 | 62.4 | 0.96 | 1040 | 0.573 |
| 16 | 82.10 | 0.85 | 66.8 | 0.96 | 1111 | 0.574 |
| 17 | 88.00 | 0.87 | 73.7 | 0.96 | 1190 | 0.591 |
| 18 | 92.20 | 0.88 | 77.8 | 0.96 | 1260 | 0.590 |
| 19 | 96.80 | 0.83 | 77.6 | 0.97 | 1370 | 0.541 |
| 20 | 107.00 | 0.87 | 90.7 | 0.97 | 1510 | 0.574 |
| 21 | 117.30 | 0.94 | 107.5 | 0.97 | 1630 | 0.630 |
| 22 | 126.80 | 0.99 | 122.1 | 0.97 | 1700 | 0.686 |
| 23 | 137.10 | 1.05 | 140.8 | 0.97 | 1800 | 0.747 |
| 24 | 145.70 | 1.08 | 153.7 | 0.97 | 1900 | 0.773 |
| 25 | 156.40 | 1.10 | 167.6 | 0.98 | 2040 | 0.785 |
| 26 | 166.00 | 1.13 | 183.4 | 0.98 | 2145 | 0.817 |
| 27 | 175.40 | 1.17 | 200.2 | 0.98 | 2230 | 0.857 |
| 28 | 186.70 | 1.23 | 224.4 | 0.98 | 2300 | 0.932 |
| 29 | 195.00 | 1.27 | 242.0 | 0.97 | 2380 | 0.971 |
| 30 | 204.70 | 1.32 | 264.0 | 0.97 | 2460 | 1.025 |
3.4. Regression trend lines using calculated electrical parameters
The values expressed in the Excel tables mentioned above allow you to perform adjustment charts of a regression type using the coefficient method of determination as a statistical instrument.
3.5. Regression Graphs in AC Behavior
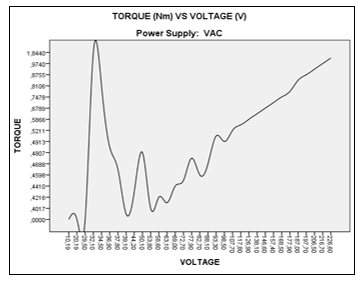 Figure 9: Analysis of Torque (N.m) and Voltage (r.m.s).
Table 4: Analysis of Torque (N.m) and Voltage (r.m.s).
| Model Summary | ||||
| Model | R | R Square | Adjusted
R Square |
Std. Error of the Estimate |
| 1 | ,496a | ,246 | ,221 | ,2976087 |
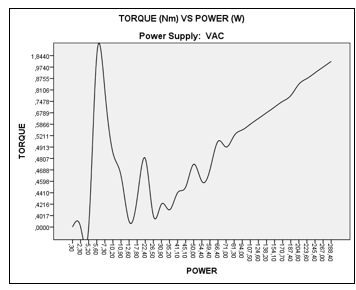 Figure 10: Analysis of Torque (N.m) and Power (W).
Table 5: Analysis of Torque (N.m) and Power (W).
| Model Summary | ||||
| Model | R | R Square | Adjusted
R Square |
Std. Error of the Estimate |
| 2 | ,499a | ,249 | ,224 | ,2970596 |
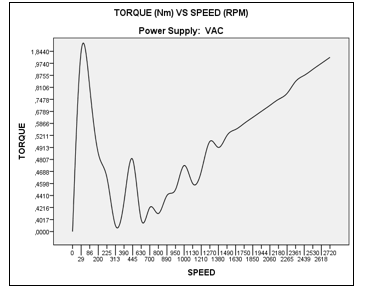 Figure 11: Analysis of Torque (N.m) and Rotation Revolution (RPM).
Table 6: Analysis of Torque (N.m) and Rotation Revolution (RPM).
| Model Summary | ||||
| Model | R | R Square | Adjusted
R Square |
Std. Error of the Estimate |
| 3 | ,436a | ,190 | ,164 | ,3084654 |
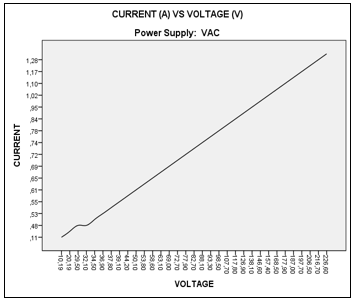 Figure 12: Analysis of Intensity (A) and Voltage (r.m.s).
Table 7: Analysis of Intensity (A) and Voltage (r.m.s).
| Model Summary | ||||
| Model | R | R Square | Adjusted
R Square |
Std. Error of the Estimate |
| 4 | ,976a | ,953 | ,952 | ,06255 |
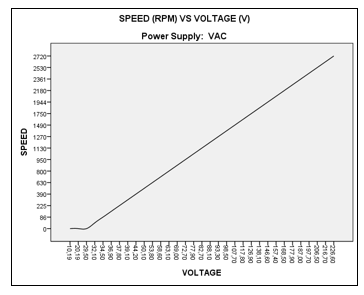 Figure 13: Analysis of Rotation Revolution (RPM) and Voltage (r.m.s).
Table 8: Analysis of Rotation Revolution (RPM) and Voltage (r.m.s)
| Model Summary | ||||
| Model | R | R Square | Adjusted R Square | Std. Error of the Estimate |
| 5 | ,987a | ,975 | ,974 | 143,388 |
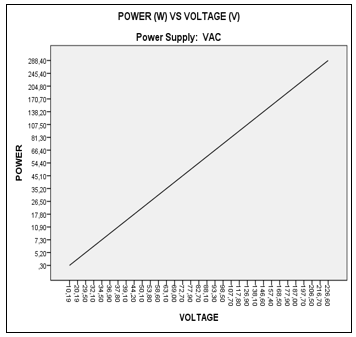 Figure 14: Analysis of Power (W) and Voltage (r.m.s).
Table 9: Analysis of Power (W) and Voltage (r.m.s)
| Model Summary | ||||
| Model | R | R Square | Adjusted R Square | Std. Error of the Estimate |
| 6 | ,987a | ,975 | ,974 | 13,74904 |
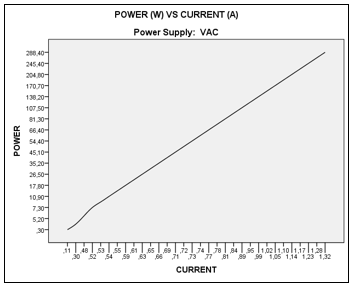 Figure 15: Analysis of Power (W) and Intensity (A).
Table 10: Analysis of Power (W) and Intensity (A)
| Model Summary | ||||
| Model | R | R Square | Adjusted R Square | Std. Error of the Estimate |
| 7 | ,948a | ,898 | ,895 | 27,76831 |
3.6. Regression Graphs in DC Behavior
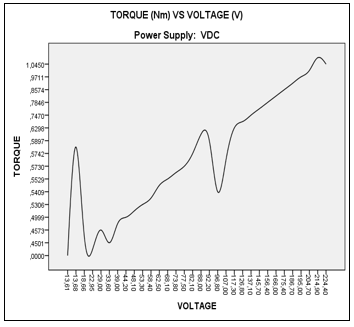 Figure 16: Analysis of Torque (N.m) and Voltage (r.m.s).
Table 11: Analysis of Torque (N.m) and Voltage (r.m.s)
| Model Summary | ||||
| Model | R | R Square | Adjusted
R Square |
Std. Error of the Estimate |
| 1 | ,922a | ,849 | ,844 | ,0870090 |
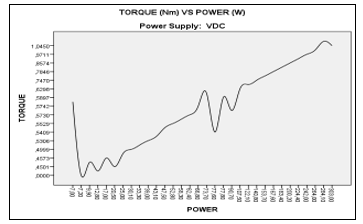 Figure 17: Analysis of Torque (N.m) and Power (W).
Table 12: Analysis of Torque (N.m) and Power (W).
| Model Summary | ||||
| Model | R | R Square | Adjusted R Square | Std. Error of the Estimate |
| 2 | ,924a | ,854 | ,849 | ,0856509 |
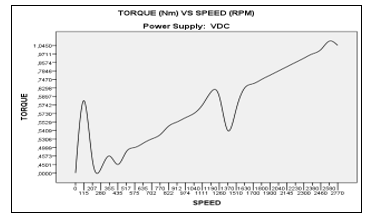 Figure 18: Analysis of Torque (N.m) and Rotation Revolution (RPM).
Table 13: Analysis of Torque (N.m) and Rotation Revolution (RPM).
| Model Summary | ||||
| Model | R | R Square | Adjusted R Square | Std. Error of the Estimate |
| 3 | ,915a | ,837 | ,831 | ,0905099 |
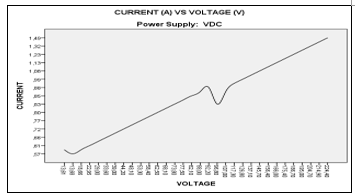 Figure 19: Analysis of Intensity (A) and Voltage (r.m.s).
Table 14: Analysis of Intensity (A) and Voltage (r.m.s).
| Model Summary | ||||
| Model | R | R Square | Adjusted
R Square |
Std. Error of the Estimate |
| 4 | ,992a | ,984 | ,983 | ,03201 |
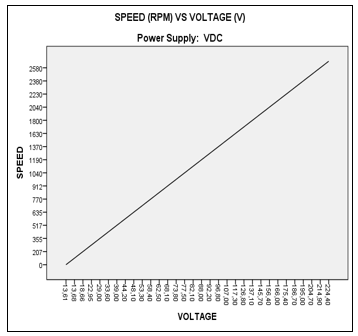 Figure 20: Analysis of Rotation Revolution (RPM) and Voltage (r.m.s).
Table 15: Analysis of Rotation Revolution (RPM) and Voltage (r.m.s).
| Model Summary | ||||
| Model | R | R Square | Adjusted R Square | Std. Error of the Estimate |
| 5 | ,995a | ,990 | ,990 | 80,165 |
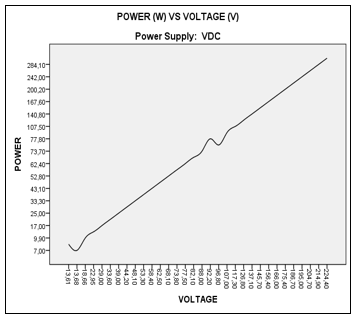 Figure 21: Analysis of Power (W) and Voltage (r.m.s).
Table 16: Analysis of Power (W) and Voltage (r.m.s).
| Model Summary | ||||
| Model | R | R Square | Adjusted
R Square |
Std. Error of the Estimate |
| 6 | ,986a | ,973 | ,972 | 14,81830 |
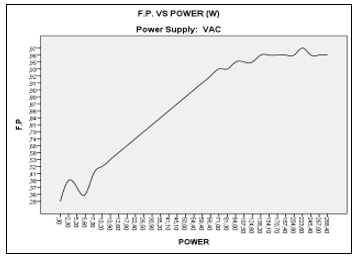 Figure 22: Analysis of Power (W) and Intensity (A).
Table 17: Analysis of Power (W) and Intensity (A).
| Model Summary | ||||
| Model | R | R Square | Adjusted
R Square |
Std. Error of the Estimate |
| 7 | ,989a | ,978 | ,978 | 13,23232 |
4. Analysis of results
The regression graphs for both Direct Current Voltage and Alternating Current Voltage behavior types presented above are analyzed.
Given the representations in AC behavior as shown in Figures 9, 10 and 11; as well as in DC behavior representations, in Figures 16, 17 and 18, one of its best virtues of this class of engines can be seen, which is a high starting torque, typical of this quality at the start moment requires greater resources and it is shown that during start-up this machine requires greater power and indirectly higher voltage or intensity; but since the first is an independent variable in addition to controlled, the second is the one that covers the requirement, until the inertia of the rotor expires, in the case of being empty and beating even the load that is subjected.
Given Figure 13 and Figure 20, the rpm is directly matched according to the electrical voltage. At the intrinsic increase of electrical voltage, the motor torque characteristics are dramatically increased and with this the intensity, until stabilized in time, expressed in Figure 12 and Figure 19.
The power is conditioned by very relevant electrical parameters in terms of electrical machines, such as voltage; this understanding is presented in Figure 14 and Figure 21.
Given the curve in Figure 10 and Figure 17, the inference can be performed on this type of rotating machines, the torque has a direct ratio of increment to the power. According to the curve of Figure 11 and Figure 18, it can be inferred that these engines can reach high speeds and with these also reach high torque values.
According to Figure 23 and Figure 24, F.P. column can be inferred that these class of motors have better optimization of electrical energy in terms of active and reactive power; that is, when you are having a power supply in VDC.
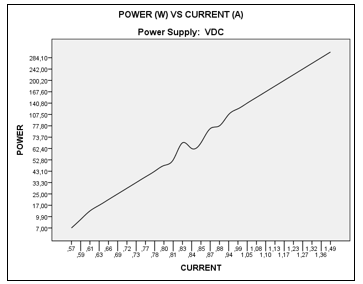 Figure 23: Analysis of F.P (cos φ) and Power (W).
Table 18: Analysis of F.P (cos φ) and Power (W).
| Model Summary | ||||
| Model | R | R Square | Adjusted
R Square |
Std. Error of the Estimate |
| AC | ,685a | ,469 | ,452 | ,16518 |
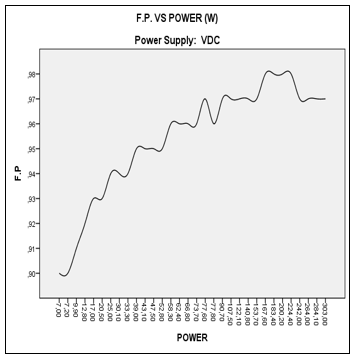 Figure 24: Analysis of F.P (cos)and Power (W).
Table 19: Analysis of F.P (cos)and Power (W).
| Model Summary | ||||
| Model | R | R Square | Adjusted
R Square |
Std. Error of the Estimate |
| DC | ,734a | ,539 | ,524 | ,01576 |
Remember that alinear load can be inductive, the closer its F.P. is closer to the unit, it has a more efficient power consumption.
In addition, through theoretical concepts we can establish that efficiency is expressed:
![]() Given the data sheet shown in Table 1, the efficiency value is obtained by Equation 3, this nominal factor is obtained when the drill is subjected to load:
Given the data sheet shown in Table 1, the efficiency value is obtained by Equation 3, this nominal factor is obtained when the drill is subjected to load:
![]() By the first interpretation, efficiency is obtained, by applying a data relationship used by intuitive criterion, that result maintains a margin medium-reliability.
By the first interpretation, efficiency is obtained, by applying a data relationship used by intuitive criterion, that result maintains a margin medium-reliability.
For analysis of the efficiency we resort to Table 2 and Table 3, where a section of items is used; segmenting the measurement in which the universal motor has the same RPM value, for the same voltage:
Table 20: Efficiency analysis in AC tests.
| Drill Electrical Tests In AC. | |||||||
| Item | Input (Supply) – AC | Axis | motor | ||||
| Tension
(V) |
Current
(A) |
Power
(W) |
Rpm | Torque
(N.m.) |
η
(%) |
||
| 22 | 98.50 | 0.78 | 71.0 | 1380 | 0.491 | 47.78 | |
| 23 | 117.80 | 0.84 | 94.0 | 1630 | 0.551 | 46.65 | |
| 24 | 157.40 | 1.02 | 154.1 | 2060 | 0.714 | 47.90 | |
Table 21: Efficiency analysis in DC tests
| Drill electrical tests in DC | ||||||
| Item | Input (Supply) – AC | Axis | motor | |||
| Tension
(V) |
Current
(A) |
Power
(W) |
Rpm | Torque
(N.m.) |
η
(%) |
|
| 20 | 96.80 | 0.83 | 77.6 | 1370 | 0.541 | 52.22 |
| 21 | 117.30 | 0.94 | 107.5 | 1630 | 0.630 | 53.35 |
| 22 | 156.40 | 1.10 | 167.6 | 2040 | 0.785 | 52.10 |
It is then derived from Equation 3, the expression:
![]() Given the case of 1630 RPM and 117 Volts, the calculation is proceeded.
Given the case of 1630 RPM and 117 Volts, the calculation is proceeded.
Efficiency with VDC power:
Efficiency with VAC power:
By the second interpretation, you get the actual efficiency, which is obtained when the percussion drill is in operation, without considering applied load.
Table 22: Real efficiency in AC tests
| Application – VAC | |||
| Item | P. Useful (W) | P. Absorved (W) | η |
| P. Mechanical | P. Electric | % | |
| 1 | 0.00 | 0.31 | 0.00 |
| 2 | 0.00 | 2.27 | 0.00 |
| 3 | 0.00 | 5.18 | 0.00 |
| 4 | 5.60 | 5.55 | 1.01 |
| 5 | 7.30 | 7.32 | 0.99 |
| 6 | 10.20 | 10.17 | 1.003 |
| 7 | 10.90 | 10.82 | 1.008 |
| 8 | 12.60 | 12.47 | 1.010 |
| 9 | 17.80 | 17.73 | 1.004 |
| 10 | 22.40 | 22.62 | 0.991 |
| 11 | 26.50 | 26.78 | 0.990 |
| 12 | 30.90 | 30.85 | 1.002 |
| 13 | 35.20 | 34.98 | 1.006 |
| 14 | 41.10 | 40.94 | 1.004 |
| 15 | 45.10 | 44.91 | 1.004 |
| 16 | 50.00 | 49.92 | 1.002 |
| 17 | 54.40 | 54.33 | 1.001 |
| 18 | 59.40 | 59.33 | 1.001 |
| 19 | 66.40 | 66.09 | 1.005 |
| 20 | 71.01 | 71.45 | 0.994 |
| 21 | 81.31 | 81.13 | 1.002 |
| 22 | 94.01 | 94.00 | 1.000 |
| 23 | 107.51 | 107.29 | 1.002 |
| 24 | 124.61 | 124.64 | 1.000 |
| 25 | 138.21 | 139.33 | 0.992 |
| 26 | 154.11 | 154.13 | 1.000 |
| 27 | 170.71 | 169.85 | 1.005 |
| 28 | 187.41 | 187.86 | 0.998 |
| 29 | 204.82 | 204.65 | 1.001 |
| 30 | 223.62 | 224.37 | 0.997 |
| 31 | 245.42 | 243.84 | 1.006 |
| 32 | 267.02 | 266.28 | 1.003 |
| 33 | 288.42 | 287.15 | 1.004 |
| Average total performance | 91. 03% | ||
According to the experimental analysis these machines operate more efficiently when a VDC source is available, usually represented in Figure 25, with a variation of 5.63% from the AC power system; consequently motors working with VDC increase the life cycle of dynamic parts such as bearings, gears, collectors and their brushes; remember that an electrical disturbance can encourage the formation of harmonics and these instead trigger in mechanical vibrations, generating as a result of efforts in dynamic and statisticparts.
According to the above mentioned in addition to this last analysis you can be certain that under similar conditions such as rpm, voltage, power, and so on. This machine increases its performance when energized by VDC.
Table 23: Real efficiency in DC tests
| Application – VDC | |||
| Item | P. Useful (W) | P. Absorved (W) | η |
| P. Mechanical | P. Electric | % | |
| 1 | 0.00 | 7.23 | 0.000 |
| 2 | 7.00 | 7.02 | 0.998 |
| 3 | 9.90 | 10.02 | 0.988 |
| 4 | 12.80 | 12.88 | 0.994 |
| 5 | 17.00 | 16.99 | 1.001 |
| 6 | 20.50 | 20.62 | 0.994 |
| 7 | 25.00 | 25.30 | 0.988 |
| 8 | 30.10 | 29.91 | 1.006 |
| 9 | 33.30 | 33.01 | 1.009 |
| 10 | 39.00 | 38.99 | 1.000 |
| 11 | 43.10 | 43.27 | 0.996 |
| 12 | 47.50 | 47.50 | 1.000 |
| 13 | 52.80 | 52.40 | 1.008 |
| 14 | 58.30 | 58.80 | 0.992 |
| 15 | 62.40 | 62.50 | 0.999 |
| 16 | 66.80 | 66.99 | 0.997 |
| 17 | 73.71 | 73.50 | 1.003 |
| 18 | 77.81 | 77.89 | 0.999 |
| 19 | 77.61 | 77.93 | 0.996 |
| 20 | 90.71 | 90.30 | 1.005 |
| 21 | 107.51 | 106.95 | 1.005 |
| 22 | 122.11 | 121.77 | 1.003 |
| 23 | 140.81 | 139.64 | 1.008 |
| 24 | 153.71 | 152.64 | 1.007 |
| 25 | 167.61 | 168.60 | 0.994 |
| 26 | 183.41 | 183.83 | 0.998 |
| 27 | 200.21 | 201.11 | 0.996 |
| 28 | 224.42 | 225.05 | 0.997 |
| 29 | 242.02 | 240.22 | 1.007 |
| 30 | 264.02 | 262.10 | 1.007 |
| 31 | 284.12 | 283.50 | 1.002 |
| 32 | 303.02 | 324.33 | 0.934 |
| Average total performance | 96.66% | ||
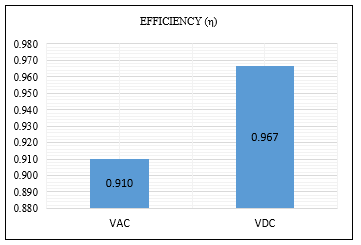 Figure 25: Representation of efficiencies in AC and DC tests.
5. Discussion
Given a sourceof energy to a reason of constant increase, it presents less electrical disturbance; however, if this increase doesn’t obey any constant reason, this machine has radical torque increments coupled with the disturbances generated and include less efficiency in yourlife. [8]
Reaffirming Rosenberg’s assertion, evidence throughout the experimentation a recesion in what corresponds to the natural sizzle generated by the engines that have collectors; since it is properto the rapid transition between delga and delga causes an electric arco small magnitude, however, this characteristic it is diminished how much it works with VDC which does not happen with VAC. This post-verification statement was made of the good condition of the brushes in addition to the correct adhesion between the dega and brush.
Remenber that the proportion of the electric arco generated in the collector may also be caused by poor adhesion between brush and delga or also because of the speed. [5]
Universal motors are deficient in temperature, it is a cough to increase this variable of the maticte very quickly, however, to relatively short periods of use. Given the constitution of winding rotor with dolphins; In addition, the maintenance of these is very high. [5]
6. Conclusions
We will find that the good interpretation of the oscilloscope gives us greater reliability; in addition to the possibility of showing the complete shape of the wave, leading to the best analysis, as well as better accuracy in what the analysis is, in this instrument we can calculate the maximum effective voltage, frequency and period; in addition to so-called valley ridges and so on. Through this view of the function generator, we show the representative model of the VDC and VAC Power Supply; and the first called pulsating voltage and the second alternating voltage.
According to the figure of the oscilloscope is shown the representation of different wave qualities one complete sinusoidal and the other only half cycle, however, using measuring instruments it is shown that in both cases we observe the similar measurements of tension this in a similar revolution (rpm), this being that at all times a positive semicycle is always preserved throughout the period in VDC and a positive semicycle or a negative one in the case of VAC, however, they will always possess in both cases at similar effective tension.
The efficiency of this class of motors is directly related to the type of power supply by which it is used, in addition when we consider the reduction of network disturbances, the high starting torque, high rpm, longer service life given to a decrease in electrical distortions caused by its own induced winding rotor constitution; are all virtues of this type of motor during VDC operation.
Conflict of Interest
The authors declare no conflict of interest.
Acknowledgment
The authors wish to recognize and thank the National Technological University of Lima South Lima for their support of this investigation.
- Álvarez, J., Araque, O., & Merino, Y. (2017). Electronic device to control the frequency in a single-phase motor of alternating current. Scientia et Technica, 308-314X. Li, Principles of Fuel Cells, Taylor and Francis Group, 2006.
- Dhinakaran, P., & Manamalli, D. (2016). Novel strategies in the Model-based Optimization and Control of Permanent Magnet DC motors. Computers & Electrical Engineering, 34-41.
- Lechappé, V., Salas, O., De León, J., Plestan, F., Moulay, E., & Glumineau, A. (2016). Predictive control of disturbed systems with imput delay: expermimental validation on a DC. IFAC, 292-297.
- Monroy, E., Garcia, A., Espinoza, E., Garcia, L., & Tapia, R. (2016). n Unmanned Ground Vehicles Experimental Setup for Image-Based Object Tracking. IEEE Latin America Transactions, 1-6.
- Aguilar, O., Tapia, R., Valdarramo, A., & Rivas, I. (2016). Adaptive neural network control of chaos in permanent magnet synchronous motor. Intelligent Automation & Soft Computing, 2845-2850.
- Bai, R. (2016). Neural network control-based adaptive design for a class of DC motor Systems with the full state constraints. Computers & Electrical Engineering, 34-41.
- Chapman, S. (2016). Electric machines (6ta ed.). D.F. Mexico: Mc Graw Hill.
- Dionisio, O., Martín, D., & Díaz, A. (2016). Single-phase motor of shaded poles. Quantitative and comparative study. Ciencia y Tecnología, 25-41.
- Wildi, T. (2015). Electrical Machines and Power Systems. Mexico D.F: Pearson Educacion.
- Davidson, E., Lamola, J., Xia, X., & Gitau, M. (2015). Desing and permformance analysis of a universal motor for industrial alarm systems. Mexico D.F: Research Gate.
Citations by Dimensions
Citations by PlumX
Google Scholar
Scopus
Crossref Citations
- Yineth Lorena Correa, Iván Felipe Muñoz, Francisco Franco Obando, Maximiliano Bueno Lopez, "Computational Comparison of AC and DC Motors to Hydrodynamic Changes in Marine Fishing Vessels." TecnoLógicas, vol. 26, no. 56, pp. e2442, 2023.
No. of Downloads Per Month
No. of Downloads Per Country