
Fire System for an Automated Electrical Substation via Programmable Logic Controller
Volume 4, Issue 6, Page No 353-359, 2019
Author’s Name: Omar Freddy Chamorro Atalayaa), Dora Yvonne Arce Santillan, Martin Diaz Choque
View Affiliations
Faculty of Engineering and Management, Universidad Nacional Tecnológica de Lima Sur, Perú
a)Author to whom correspondence should be addressed. E-mail: omar_chamorro1@hotmail.com
Adv. Sci. Technol. Eng. Syst. J. 4(6), 353-359 (2019); ![]() DOI: 10.25046/aj040645
DOI: 10.25046/aj040645
Keywords: Programmable Logic Controller, Fire System, Electrical Substation

Export Citations
This article presents the development of an automatism by means of a Programmable Logic Controller (PLC), for the Fire System of an Electric Substation; For this, the areas belonging to the electrical substation are initially described, where the automatism is developed, these being three; Patio area (Transformer location), Distribution board area and Control room. Then the components to be used in the automatism are identified, which are; 16 sensors (input elements), as well as 5 solenoid valves, 3 electro-pumps and 3 frequency inverters (output elements). Then the programming of the S71200 PLC is developed, through the contact scheme language, the automatic control guarantees the optimal operation of the system components. Once the system has been developed, the Cronbach Alpha test is carried out in the statistical program SPSS (Startical Product and Service Solutions), which determines that the reliability is 0.794. Finally, the normality of the data was verified through the Shapiro Wilk test, obtaining as a result a significance of 0.60 for the pressure and 0.166 for the flow rate; being these data greater than the level of significance ? = 0.05, we can conclude that the variable pressure and flow follow a normal distribution, which is reflected in the normal QQ graph, in this way the correct operation of the fire system would be guaranteed. of the Electrical Substation..
Received: 06 September 2019, Accepted: 01 December 2019, Published Online: 16 December 2019
1. Introduction
As is known, electrical energy implies risks for both entities and people, either directly due to the effect of an electric shock or indirectly, as a source of heat capable of generating a fire or explosion in certain environments of an installation. [1]
In the case of power transformers, when using highly flammable liquid insulation, such as mineral oil, the risk of fire is high, because it contains a large number of combustible elements that are in contact with live elements. Although the fire rate is not so high; Currently the surveys carried out indicate that the number of fires is growing significantly, generating very high economic consequences, and affecting the supply of consumers [2]
For this reason, in the industry fire systems are being considered using water spray, since, according to the studies carried out, it is the most beneficial, to extinguish electrical fires, due to the lack of continuity between water particles, which prevents Electricity can be conducted through them. That is why these systems are used effectively to extinguish, control, protect and / or prevent a fire. [3]
Considering the risk and the probability of occurrence of an accident in the different equipments of the substations, measures must be taken that meet the requirements effectively and safely; for this reason, the implementation of automatic control systems has emerged; that mitigate damage to facilities, personnel in charge or consumers.
Therefore, fire systems are currently operating through the use of technological innovations, one of them is the Programmable Logic Controller (PLC), with which multiple benefits are achieved, such as precise control of the entire system, reduction of accidents of work, reduction of equipment and material costs to replace and / or use, and use of man-machine times. [4]
In this sense, this article seeks to develop an automatism that optimally controls the Fire System of an Electric Substation.
2. Methodology
2.1. Kind of investigation
The research is level is descriptive; through which the development of the fire system automation of an electrical substation is described; In addition, the results of the pressure and flow of the sprinklers will be analyzed, which should be according to the design based on the NFPA standard.
2.2. Population and Sample
For our study, the 24 sprinklers of the fire system of the electrical substation are considered as population.
Likewise, the sample will be the same as the population; since, according to Hernández cited in Castro (2003), he says that “if the population is less than fifty (50), the population is equal to the sample” (p.69). [5] The number of sprinklers contained in the design area, as well as the coverage area of the sprinklers, was determined by means of the NFPA-13 standard. Once these indicators were calculated, the number of sensors to be used could be determined.
It should be noted that in the present investigation our unit of analysis is made up of the measurements made in the fire system in relation to its pressure and flow parameters.
2.3. Instrument used in Data Colecction
The instrument used is the data record data sheet, in which the measurement results of the pressure and flow parameters of the fire system have been collected.
3. Results
The electrical substation is divided into three areas; these are:
- Patio area (Transformer location)
- Distribution board area
- Control room
Likewise, the fire system will be of the type of water spray, these systems have spray nozzles, which allows the discharge to be in fine mist-type drops, these systems are the most appropriate for class C fire, in which they intervene fuels, in addition the discharge of this system does not conduct electricity. The water spray is used to extinguish fires caused by electrical equipment, since due to the lack of continuity of the water particles, which is why they prevent electricity from being conducted through each drop.
In addition, one of the advantages is that its components do not contain chemicals that affect the airways of the operators, it is also not a conductor of electricity, nor produces thermal or static shocks.
Described the areas of the substation and the type of fire system used, we will describe the sequence of the system to be automated. It should be noted that one factor is the scope to which we wish to reach and in turn the limitations that may arise. Thus, the use of the PLC is justified, since it will optimize especially the economic resources; It also controls an entire process, managing multiple devices simultaneously.
The control system will be activated when the smoke sensor detects the presence of visible and invisible combustion particles; The fire system has 16 smoke sensors, and 24 sprinklers the distribution of sensors and sprinklers is observed below:
Table 1: Sensor Distribution
| Area | Spray Smoke | Sprinklers |
| Main playground | 8 | 12 |
| Boards | 5 | 8 |
| Control room | 3 | 4 |
Source: Self made
The electric pump will then be activated and at the same time the solenoid valves will open; The solenoid pump has the function of boosting the water in the storage tank, while the solenoid valves will pass the water to the spray nozzles.
Also, there are 24 sprinklers, these will be activated independently, only in the area where the fire is taking place, that is, only the sprinklers will be activated, in the area where the sensor detects any anomaly; There are also three electric pumps, each of which will cover 8 sprinklers.
The following Table shows the characteristics of the components that are part of the automatic control of the fire system.
Table 2: Components of the System to Automate
| Components | Features | Quantity |
| Sprinklers |
K=5,6 gpm/psi T=79°C |
24 |
| Smoke sensors |
9 VCC Brand FIKE 20mA 85db/3m 433,92 MHz |
16 |
| Solenoid valves |
220 V 300PSI UL/FM |
24 |
| Electric pumps |
4HP Elevation: 92m Suction Height: 8m Pumping capacity: 110 l / min |
3 |
Source: Self made
Once the design of the automatism has been described, then the input and output elements of the control system are established:
Input Elements:
- Sensor a1, a2, a3, a4, a5, a6
- Sensor b1, b2
- Sensor c1, c2,
- Sensor d1, d2, d3
- Sensor e1, e2, e3
Output Items:
- Solenoid valve A, B, C, D, E.
- Electric pump 1, 2, 3.
- Drive 1, 2, 3.
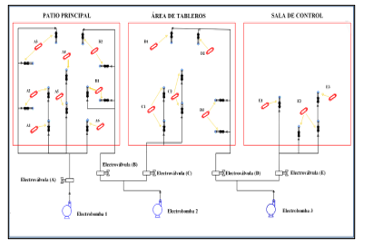 Figure 1: Automated fire system (Source: Own elaboration)
Once the input and output elements have been determined in the automatic control, the Programmable Logic Controller to be used in the Fire System is sized, which is the PLC-S71200, this controller will also be connected with 3 inverters, for every 8 sprinklers that are connected to a bomb.
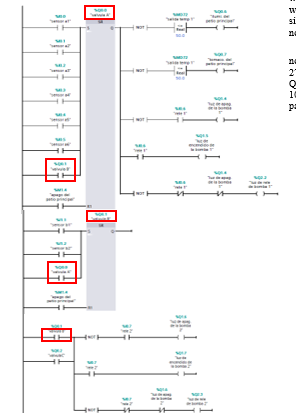 Figure 2: Segment 1 of the programming (Source: Own elaboration)
The automated fire system connection is shown below.
Next, the S71200 PLC programming is developed; in order to improve the pressure and flow regulation of the fire system.
In the main courtyard there are valves A (which has six sensors a1 to a6), B (which has two sensors b1 and b2, which send a signal to activate the solenoid valve A) with a switch and the temperature sensor; Valve B if it detects any active fire at solenoid valve A and is at the same time with another temperature sensor in which if it reaches 50 ° C it deactivates the lighting and outlet circuit.
Solenoid valve A and B activate pump1 and pump 2, respectively, these at the same time will operate at a maximum speed of 1700 rpm. It should be noted that the drive power system must be turned on in order for the drive to automatically start. It is possible to maintain a constant pressure, for this the use of a Honeywell frequency inverter; also the 3 drives to be used are connected to the PLC. The H2O level sensor for the pump has been considered, with an analog input (IW64 of integer type).
Next, the following figure shows segment 1: Valve, lighting, outlet and pump system plus the drive with segments 3 + 4 + 5 (1.1 / 2.1).
Likewise, its respective scaling is carried out for the pump1 with the Siemens commands (an int to real converter is used which is a MW15 that is connected in the MOVE, this sends the signal to the input of the conv., to later be an MD020 in the normalized (norm_X).
In the normalized parameters 0-1700 is placed; This normalized output enters the scaling input with parameters 0-27648 (PLC scanning) and its actual output is converted to a QW80 integer which is at the output of the SB120 module (is 0-10v) and is connect to the input of the drive that works with parameters 0-10v; This is the same for pump 2.
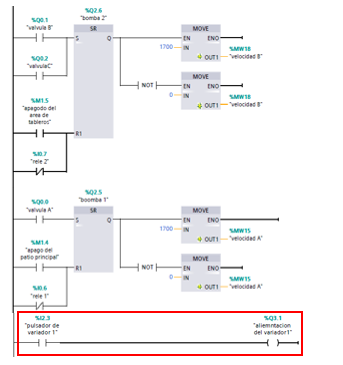 Figure 3: Segment 2 of the programming (Source: Own elaboration)
In the scaling of the temperature sensor 1, in the normalized one it sets parameters of 0-27648 and the output of the normalized one is connected to the entrance of the scaling with parameters of 0-100 ° C to be able to restrict its operation for the lighting system power outlet There is no relationship with the temperature level and the water pressure; as noted; The function of the temperature sensor is to deactivate the lighting system and outlet; when the heat parameters are outside the established range.
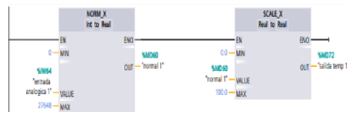 Figure 4: Segment 3 of the programming (Source: Own elaboration)
In the dashboard area there are the valves C (which has two sensors c1 and c2), D with a switch (which has three sensors d1, d2 and d3, which sends a signal to activate the solenoid valve C) and the temperature sensor; valve D, if it detects an active fire at solenoid valve C and is at the same time with another temperature sensor in which if it reaches 50 ° C it deactivates the lighting and outlet circuit.
Solenoid valve C and D, activate pump 2 and pump 3, respectively; You will march at a maximum speed of 1700 rpm.
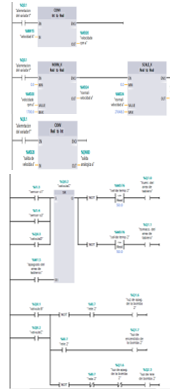 Figure 5: Segment 4 of the programming (Source: Own elaboration)
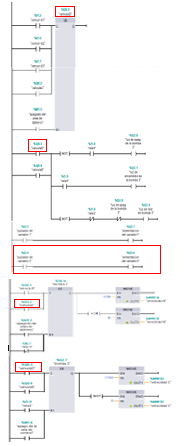 Figure 6: Segment 5 of the programming (Source: Own elaboration)
For this case, its respective scaling is also carried out for pump 2 with the Siemens commands (MW18 converter), when sending the signal to the input of the conv., It will become an MD034. The actual output is converted to an integer QW96, which is at the output of the SB-120 module and is connected to the input of the drive; this is the same for pump 3.
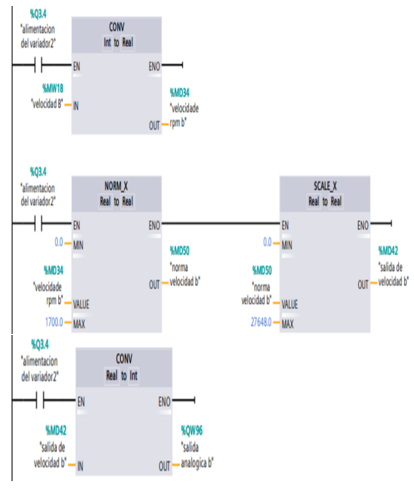 Figure 7: Segment 6 of the programming (Source: Own elaboration)
In the scaling of the temperature sensor 2, in its normalization the parameters of 0-27648 are set and the output of the normalized is connected to the input of the scaling with parameter of 0-100° C to be able to restrict its operation for lighting system and outlet.
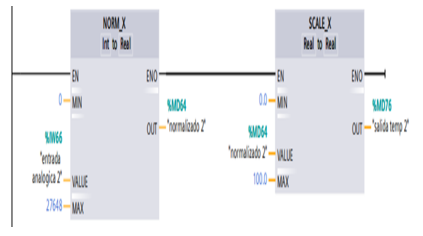 Figure 8: Segment 7 of the programming (Source: Own elaboration)
In control room is the E valves (which has three sensors e1, e2 e3), and the temperature sensor. The solenoid valve E activates the pump3, you are at the same time running at its maximum speed of 1700 rpm.
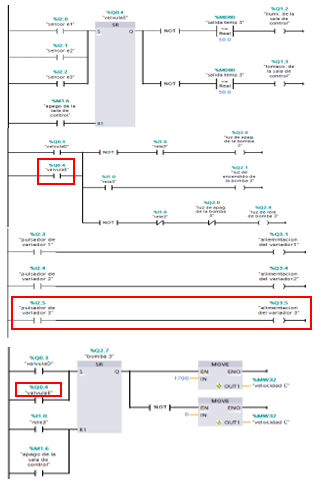 Figure 9: Segment 8 of the programming (Source: Own elaboration)
Its respective scaling is performed for pump 3 (when MW32 will be converted to MD038), the actual output is converted to an integer QW98.
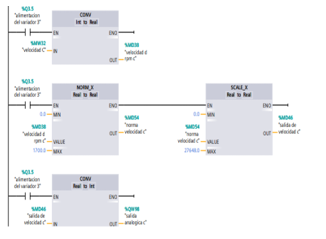 Figure 10: Segment 9 of the programming (Source: Own elaboration)
Finally, in the scaling of the temperature sensor 3, its normalized parameters are set to 0-27648 and the normalized output is connected to the scaling input with a parameter of 0-100 ° C in order to restrict its operation for lighting system and outlet.
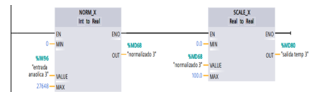 Figure 11: Segment 10 of the programming (Source: Own elaboration)
4. Statistical Analysis
Initially the Cronbach’s alpha will be analyzed in order to determine the validity of my instrument, through this test the reliability of the flow and pressure measurements of the sprinklers will be established; To do this I will use the statistical program SPSS.
Table 3: Cronbach Alfa
| Reliability statistics | |
| Alfa Cronbach | N of elements |
| ,794 | 2 |
Source: SPSS
As seen in the previous table, the result of Cronbach’s alpha is equal to 0.794; This means that the instrument is valid; since, according to Celina and Campo (2005) the minimum acceptable value must be greater than 0.7. [6]
The normality of the data will then be analyzed using the Shapiro Wilk test, this test is recommended for samples below 50.
Tabla 4: Normality Test
| Shapiro-Wilk | |||
| Statistical | Gl | Sig. | |
| Pressure_psi | ,912 | 24 | ,060 |
| Flow_gpm | ,940 | 24 | ,166 |
Fuente: SPSS
As can be seen in both cases, the level of significance is greater than α = 0.05, so it would be demonstrated that the variables present a normal distribution of their data.
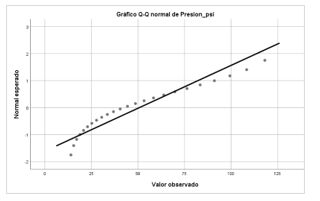 Figure 12: Normal Q-Q graph of each sprinkler pressure (Source: SPSS)
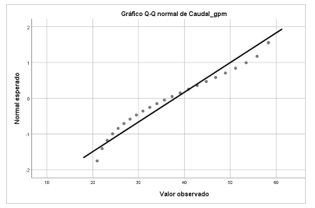 Figure 13: Normal Q-Q flow chart of each sprinkler (Source: SPSS)
The normal Q-Q chart ratifies the previous conclusion, since the observed values are placed on the diagonal, indicating the normality of the data.
Finally, we will observe the behavior of the pressure and flow parameters, obtained after performing the automation; which must comply with the NFPA standard, since, the greater the distance, the greater the pressure must be.
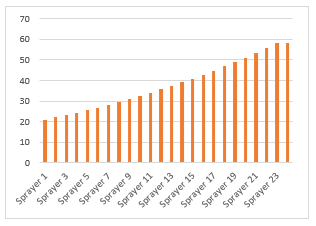 Figure. 14: Result of the flow rate of each sprinkler (Source: Own elaboration)
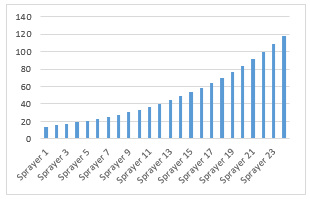 Figure 15: Result of the pressure of each sprinkler (Source: Own elaboration)
As it is observed, the results of pressure and flow, follow a correct behavior, this guarantees the optimal operation of the automation of the fire system of an electrical substation.
5. Discussion
Regarding the results obtained, these agree with those of Blum & Salazar, 2011; that in their investigation they conclude that: For the development initially the areas of greatest risk were identified, then the design was carried out and the analysis of the operability of the variables was carried out. Obtaining as a result that the system presents a quick and safe response to any incident, in addition the implementation of this system generates a profitability for the company of 14%. [7]
Regarding the results obtained, these agree with those of Ángeles & Vega, 2007; which in their investigation conclude that: To make the appropriate selection of the devices, the type of work area was initially analyzed, in order to design an effective and high quality control guaranteeing the required safety standards. With the use of technology such as that offered by a programmable logic controller, security is guaranteed, raising the degree of protection in terms of personnel integrity, as well as that of the devices that make up the system. [8]
Regarding the results obtained, these agree with that of Pachacama, 2012; which in his investigation concludes that: The development of automatism is based on the use of smoke or heat sensors mainly in cabinets, battery room and transformers; The design will prevent the spread of potential fires and minimize damage to transformers. [9]
6. Conclusions
It is concluded that it was possible to identify the programming of the S71200 PLC, using the contact scheme language; The automatic control guarantees the optimal operation of the system components.
It is concluded that it was possible to identify the components to be used in automatism, which are; 16 sensors (input elements), as well as 5 solenoid valves, 3 electro-pumps and 3 frequency inverters (output elements).
It is concluded that the project is reliable, since by means of the Cronbach Alpha test in the statistical program SPSS (Startical Product and Service Solutions), a 0.794 reliability is determined. Likewise, the normality of the data was verified through the Shapiro Wilk test, obtaining as a result a significance of 0.60 for the pressure and 0.166 for the flow rate; these data being greater than the level of significance α = 0.05, we can conclude that the variable pressure and flow follow a normal distribution, which is reflected in the normal Q-Q graph.
Conflict of Interest
The authors declare no conflict of interest.
Acknowledgment
The authors wish to recognize and thank the National Technological University of Lima South Lima for their support of this investigation.
- Correa, M., & Licursi, R. (2010). Systems for fire protection in substations. CIER, 36-42.
- Martín, V. (2009). Fire risk assessment of a transformer. (Undergraduate thesis). UNIVERSIDAD CARLOS III DE MADRID, Léganes.
- Ybirma, L. (June 20, 2017). Counterfire. Obtained from http://www.contraincendio.com.ve/sistemas-agua-pulverizada-proteccion-incendio/
- Quispe, D. (2011). Design and implementation of an automated system for the control and monitoring of the fire system for the process of extraction, storage and measurement of crude oil at the Paraíso station of ENAP Sipetrol Ecuador. (Undergraduate thesis). National Polytechnic School, Quito
- Castro, M. (2003). The research project and its elaboration scheme. (2nd ed.). Caracas: Uyapal.
- Celina, H., & Campo, A. (2005). Approach to the use of Cronbach’s alpha coefficient. Colombian Journal of Psychiatry, 572-580.
- Blum, J. C., & Salazar, G. (2011). Redesign of the fire prevention and protection system for a food processing factory. (Thesis). Higher Polytechnic School of the Coast, Guayaquil.
- Ángeles, G., Barbosa, L., & Vega, C. (2007). Control of the fire protection system of a mobile gas turbine. (Undergraduate thesis). National Polytechnic Institute, Mexico.
- Pachacama, Á. (2010). Design and proposal for the construction of an automatic fire detection, alarm and control system in the Cristianía N ° 18 substation of the E.E.Q.S.A. (Pregrao thesis). National Polytechnic School, Quito.