A Comparative Study of Safety Leading and Lagging Indicators Measuring Project Safety Performance

Adv. Sci. Technol. Eng. Syst. J. 4(6), 306–312 (2019);
 DOI: 10.25046/aj040639
The safety management system is recognized by safety leading and lagging indicators, and their correlation with injury rates. The background on this specific subject is vague in definition, labelling, and indicators measurement. The comparativeness between leading and lagging indicators have been introduced in the constructing safety performance projects evaluation. Safety performance leading indicators are the metrics of the safety method in constructing work. While the lagging indicators associated with safety results. Many suggestions have been considered during the usage and selection of the effective leading indicators. Also, the research results outlined that the leading indicators can be used to discriminate the variances in the safety performance of projects. In this specified research, leading and lagging indicators have been reviewed and investigated. Eighteen papers have been investigated from the period of 2010 to 2019 in order to recognize the common leading and lagging indicators. In addition, this review will recognize the gaps in leading and lagging research in order to concentrate on extra studies in that field. Four papers mentioned the correlation between lagging and leading indicators. A scoping review is focusing on the points and the significant ideas associated with the research area in accordance with the history time.
1. Introduction
In construction projects, fatality and disable injuries are larger than industry average by three times (Center for Construction Research and Training 2008). According to [1]–[3] the proactive safety management system have an effective and positive influence on the performance. In the past research many effective and proposed cause have been investigated. An examples of designing for safety management [3]–[5] and schedule-based safety management are mentioned [6], [7]. Nevertheless, during the construction work the safety proactive strategies should occur in order to catch the world-class performance. For example, pre-task preparation, stop work authority, and hazard acknowledgement programs used to control and recognize possible hazards which previously resulted in injuries [1], [2], [8]–[10].
To recognize the main reasons around site results of incidents and injuries, the leading indicators are identified. In addition, they have unrestrained hazards and administrative policies together with practices, agendas, and applies that monitor, control, and remove these hazards. The leading indicators are obtainable in daily work of construction organization and have a better role in measuring the safety performance in the workplace.
In this study, a wide range of various leading indicators been investigated, including Alcohol / Drug Testing, Attitudes and Safety Climate, Fall Protection… until, Training and Job Safety Talks Worker.
The introduction of the comparison between using leading indicators of the safety performance correlatively with lagging indicators been proposed. Within the constructing projects the term of leading indicators used to assess the safety process, meanwhile lagging indicators describe the safety outcomes. This study investigates the most common list of leading and lagging factors associated with the selected articles. An example of lagging indicators, Behavior first aid and Reported Incidents. The research contains detailed overview of safety leading and lagging indicators and suggests a dissimilarity between leading indicators and lagging indicators of safety expectation. Researchers can use the results to explain and mark resource expenditures by means of universal scientific indication. Some other studies such as [10]–[14] used different technologies and others used web technology tools as in [15]–[20] to perform investigations.
These positive approaches are seldom officially dignified or checked to recruit positive replies when results are not seen. Investigation was wanted to improved apprehend the strategies that might help as forecasters of safety performance and how they can monitor, and control safety risk. This study aims in determining what relationships are found when contractor administrative data is used to measure safety performance.
18 recent articles had been reviewed and analyzed to make a confident conclusion about the leading and lagging indicators to distinguish the positive and negative impacts between them and how they correlate to each other’s. Only four paper discuss the interrelation between leading and lagging indicators. Ten leading indicators and two lagging indicators had been resulted after the analyzing of the 19 indicator to be further investigated in the future works.
2. Methodology of the Literature Review
In the beginning, it is a compulsion to cultivate a list of factors in order to choose which administrative data must be selected. To develop a widespread list of leading with lagging safety indicators that have been used in construction projects, a scoping review was accomplished. Additionally, to add a wide-ranging list of indicators, this study sums up the relationship between leading and lagging indicators in previous researches. In order to choose the suitable indicators for the review study, the contents of the earlier studies have been depended. Appropriate less1ons were chosen using the electronic database such as PubMed, Scopus and Web of Science. The information coverage is from both medical and engineering research fields, very crucial in safety construction subjects.
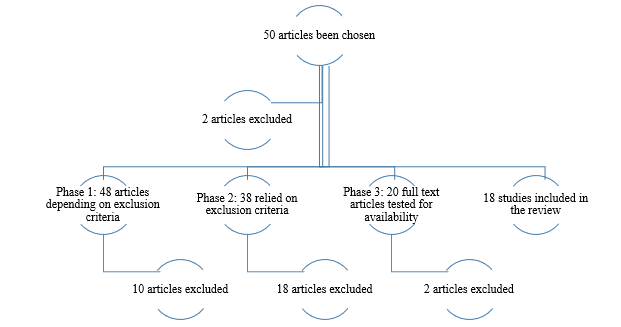 Figure. 1. The searching steps.
Fifty papers were chosen by means of the search plan. Afterward the duplicate articles were omitted, 48 researches were reread for enclosure depended on the following criteria: 1) Construction fields association; 2) safety factors; 3) recognizing leading and lagging indicators; and 4) academic journals studies.
After that, 38 of the 48 articles remained with 10 exclusions due to duplications and not related to the desirable subject. Later on, 20 articles underwent further examination. Only articles that assessed the safety indicators at a construction project class were included. A total of 2 papers were unenclosed. Finally, the articles that have a direct relation to construction and safety indicators were involved. The remaining articles that have been depended in this study were 18 articles. We prepared some excel sheets to track the researchers, publication years, research types, and the goals together with the indicators that have been used with leading and lagging group. The steps for searching process are in shown figure 1.
Largely, the papers embrace case studies, pilot studies, and literature reviews. Additionally, only a few researchers participated in the research. Table 1 summarizes the type and goal of the reviewed researches.
As it can clearly be seen from the Table 1, the research goals of the final eighteen articles are wide-ranging. Leading indicators used in constructing work should firstly been developed. Secondly, tested in a construction project setting [1]. Numerous of these papers were focused on the first step – development of indicators. This includes defining [21], [22], developing [23]–[25], or measuring the indicators [26], [29].
The followed articles focused on progressing the indicators such as [21]–[27]. Only a few articles concentrated on the second step which is the testing on construction projects through completion of validation testing of the leading on the lagging indicators [1], [28].
The articles in this review paper were depended on the classified collection of safety indicators. The study categorized the indicators to either leading or lagging indicators. So, fifteen leading and four lagging indicators were comprised. By taking in consideration that not all authors used the same vocabularies for the similar indicators were grouped together for the purpose of this
Table 1: Summery of Research Types and its Goals
| Research | Year | Research Type and Goal |
| [26][27] | 2010 | Case Study: to measure the impact of a 5-S assessment tool and safety leading indicators on project safety |
| [23][24] | 2011 | Case Study: a once-a-month weighted safety key score and safety climate review were used to assess the safety performance on a construction project |
| [27][28] | 2012 | Case Study: analysis of use of a 5-S assessment tool on one construction project to observe how safety leading indicators were reported over the course of the project |
| [29][30] | 2012 | Academic framework for using safety performance pointers in safety–critical societies had been presented. It combines 3 sorts of safety performance indicators – outcome, monitor and drive indicators |
| [30][31] | 2013 | Review Article: Discusses the difference between passive and active leading indicators within construction safety performance |
| [31][32] | 2013 | Case Study: Analysis of leading and lagging indicators of one project to estimate leading indicators below real project circumstances |
| [32][33] | 2014 | Review Article: The paper emerged several articles, models utilized in designing of meters, object of study, objectives of interpretation, terms of implementation and revision, actors impacted by the product, and expressions to certify the scientific application and working feasibility |
| [33][34] | 2015 | Pilot Study: This research developed a leading indicator-based incentive program for construction projects |
| [24][25] | 2015 | Theoretical Article: This article works to create a conceptual framework for developing safety leading indicators for use within the construction industry |
| [22][23] | 2016 | Review Article: Discusses the literature on the leading indicator, safety climate, including on a project level. |
| [28][29] | 2017 | Case Study: Analysis of the temporal relationships of leading indicators within one five-year construction project. |
| [25][26] | 2017 | Focus Groups: This research works to develop indicators that influence site safety that can be measured using safety climate tools |
| [34][35] | 2018 | The paper displays a ML method in improving leading indicators that categorize places in accordance to their safety risk in construction projects. |
| [35][36] | 2018 | It would be necessary to improve compound key connecting the main features of safety containing the cultural and climatic issues to add a further illustrative picture of platforms’ safety performance |
| [36][37] | 2018 | Quasi-experimental longitudinal investigation design will be used within 2 Ontario critical clinics. The first stage of the investigation will be based on evaluating the existing OHSMSs consuming the leading indicators. 2nd will pilot test and assess the tailored intervention |
| [37][38] | 2019 | In a cross-sectional analysis of CSAP (Contractor safety assessment program) database, several organizational leading safety indicators have been identified, that are associated with safety performance in the construction industry |
| [38][39] | 2019 | This research symbolizes safety prequalification reviews presently in usage in the construction industry to recognize methods that contain leading indicators of employee safety performance |
| [39][40] | 2019 | This study contains a comprehensive review of safety leading pointer research, suggests a dissimilarity between leading indicators and other approaches of safety prediction, and describes a clear method for distinctive between active and passive indicators. |
scoping review. The furthermost communal pointers that were classified as leading indicators were, attitudes and safety climate, site inspections/audits, training and safety talks, and worker safety behavior.
The most popular factors among lagging groups were first aid injuries and lost time injuries. More information can be noticed in Table 2.
Only the indicators that been used in two or more than two studies have been selected in the results. Some indicators were only used by [26], [27]. Though, these writers did not express their indicators or categorize what was measured, beyond a wide classification, such as fall protection. Consequently, some usable indicators by these researches were not further explained. Including, fall protection, ladders and stairs, Personal Protection Equipment (PPE), and railings and covers.
2.1. Results of Comprehensive Literature Review
Ten leading indicators and four lagging indicators were identified over a scoping review. Also, they have been used in researches that concentrated on contractor project data. The lagging and leading indicators will be more clarified below.
2.1.1. Summary of Leading Indicators
In this section, the leading indicators are widely discussed and proposed than lagging indicators. These studies appeared to be concentrated more on the attitude and behavior of the leading indicators such as safety climate, in comparison to avoidance indicators such as site inspections. The familiar leading indicators are proposed below:
Attitudes and Safety Climate: Numerous articles largely premeditated the attitude of employees or managers in the place of work. One specific measure is safety climate. Safety climate is largely well-defined as the employee insights of safety in the job site, specifically as it related to manager opinions [22], [40].
Housekeeping: Housekeeping is considered a physical hazard indicator in the workplace [25]. Housekeeping is a comprehensive phrase restricting the cleanliness of a site. It comprises features such as waste removal, and material and equipment storage (Construction Projects, 1991).
Near Miss: Is deliberated a close call incident. It may cause injuries or totally damaged, but no damage was caused [1] as the navigation of how to manage and control the hazards and avoid it is occurrence in the workplace. Through using PPE, change in the task sequence and controlling of guards [49].
Safety Corrections: In the [26], [27] Safety Corrections are measured as safety correction frequencies prepared by workers on an ad hoc basis. Conversely, [23], measured non-compliance measurements during the site inspections.
Site Inspections: Site inspections, and their similar coordinate, site examining, are tests that evaluate the hazards number on the workplace. In [1] used a scoring system where opinions were subtracted depended on the number of safety violations that happened on the site. Site checks are checklists prepared by some familiar individuals such as a supervisor or safety representative [28].
Subcontractor Safety: Subcontractor safety can be noticed at various levels. [24] Focused on the subcontractor managing of safety as an indicator in the advance safety condition. Also, in project construction until now they did not offer a measurement methodology. In [33] the calculated subcontractor safety performance system depended on the subjective calculation which investigates safe and unsafe work comments to add a single score. [30] Added examples on how subcontractor safety system can be worked and restrained subcontractor safety score not from job work actions Prior to subcontractor award relied on subcontractor safety history, safety policy and their site-specific safety program and pre-task safety plan [24].
Table 2: Leading and Lagging Indicators
| Research | Year | Leading Indicators | Lagging Indicators | |||||||||||||||||
| Alcohol / Drug Testing | Attitudes and Safety Climate | Fall Protection | Housekeeping | Ladders and Stairs | Near Miss | Pre-Task Safety Plans | Personal Protection Equipment | Railings and Covers | Safety Corrections | Safety Positive Reinforcement | Site Inspections / Audits | Subcontractor Safety | Training / Job Safety Talks | Worker Safety Behavior | First Aid Injuries | Lost Time Injuries | Members of the Public Injured | Reported Incidents | ||
| [26][27] | 2010 | |||||||||||||||||||
| [23][24] | 2011 | |||||||||||||||||||
| [41][42] | 2012 | |||||||||||||||||||
| [29][30] | 2012 | |||||||||||||||||||
| [30][31] | 2013 | |||||||||||||||||||
| [1] | 2013 | |||||||||||||||||||
| [32][33] | 2014 | |||||||||||||||||||
| [24][25] | 2015 | |||||||||||||||||||
| [33][34] | 2015 | |||||||||||||||||||
| [22][23] | 2016 | |||||||||||||||||||
| [28][29] | 2017 | |||||||||||||||||||
| [25][26] | 2017 | |||||||||||||||||||
| [34][35] | 2018 | |||||||||||||||||||
| [36][37] | 2018 | |||||||||||||||||||
| [35][36] | 2018 | |||||||||||||||||||
| [37][38] | 2019 | |||||||||||||||||||
| [38][39] | 2019 | |||||||||||||||||||
| [39][40] | 2019 | ü | ü | ü | ü | ü | ü | |||||||||||||
Training/Job Safety Talks: [24] point out safety discussions, safety instruction, and safety training for supervisors to edit safety conditions considered as safety practices. Training has often measured a side of safety climate [22], [25]. Toolbox talks, or job safety talks, used to change the conversation between the management and workers on a steady base and can be seen as a type of safety communication [28].
Worker Safety Behavior: Worker safety behavior was dignified in lots of studies. It includes measures such as worker participation in safety [22], employee safety inspiration, and worker safety capability [24]. [1] depended on using checklists instead of safety professional evaluation to evaluate workers’ safety behavior.
As shown by the leading indicators explained above, the leading indicators focused on hazard identification or correction such as site inspections or training, as well as attitudes and behaviors such as safety climate. All indicators were related to behaviors or attitudes that promote accident prevention rather than negative safety outcome.
2.1.2. Summary of Lagging Indicators
Lagging indicators, have been researched within a longer time than leading, are typically easily accessible and well documented. Yet, lagging indicators were less commonly used in the studies of this specified review. Lagging indicators are generally accessible as they are reporting measures that are required by various health and safety authorities. It used to track company performance and to monitor injury trends (OHSA, 1990). It makes the research on lagging indicators convenient. Yet, despite the convenience, there seems to be a shift towards leading indicators in the current research. This shift leaves common lagging indicators such as first aid injuries and lost time injuries, less used in research.
There are many reasons as to why lagging indicators are less commonly researched. One is the focus on injury prevention in research and in occupational health and safety practice. Researchers and practitioners have chosen to focus on indicators that can lead to injury prevention, such as site inspections, instead of indicators that document safety outcomes, such as injuries. The thought is that leading indicators allow for research to be more proactive, rather than retroactive with lagging indicators
First Aid Injuries: First aid injuries include any injury that can be treated with minimal first aid and require no further medical treatment [1]. First aid injuries are recorded on site as part of the reporting requirements in the OHSA (1990). This reporting requirement is similar across many jurisdictions. This measure was included by [23] as well.
Lost Time Injuries: Lost Time Injuries or Total Recordable Injury Rate is the ratio used by the United States Occupational Safety and Health Administration (OSHA) including any injuries that require medical treatment beyond first aid [1].
A subset of the Total Recordable Injury Rate is the Lost Time Injuries, where workers miss work leading to loss of earnings (Ontario Health and Safety Act, 1990). The documentation of lagging indicators is related to safety authority documentation requirements. The type of indicators used, whether total recordable injury rate or lost time injuries, is often based on the safety authority in the research area. Lost time injury is the more commonly used metric, as it is used by the Workplace Safety and Insurance Board (WSIB) under the reporting requirements of the OHSA (Ontario Health and Safety Act, 1990).
As it can be seen through the factors recognized in this study, the lagging indicators were correlated to undesirable safety results and precisely varying levels of injuries. Lagging indicators are willingly obtainable depended on government recording requirements, but are not widely used in the investigation in favors of leading indicators.
2.1.3. Interaction of Leading and Lagging Indicators
The scoping review concentrated on how leading and lagging indicators are correlated to one another during construction projects. To the best of our knowledge, only four studies were found investigating such studies. Therefore, this interaction became the main part of the project discussion. Unfortunately, although these four studies added some research into leading and lagging indicators in construction projects, the existence of limited articles being obtainable, presented the necessity for more research in this field.
Research [28] had been accomplished the analyses of leading indicators temporally. The researchers are not insured if the leading indicators are really leading, and how time-consuming until the implementation of leading indicators resulted in the improvements of the lagging indicators. They planned 11 leading indicators counting safety talks, hazards testified and safety inspections. These academics used frequency data gathered by sub-contractors and workers on a huge, five-year construction project in Australia.
This incidence data experienced numerous stages of pre-processing such as modification for man hours previous to being involved in results. This research found that the ‘leading’ feature of leading indicators is really energetic in nature. Leading indicators did not develop the lagging indicator, precisely the full recordable injury rate is estimated in the foreseeable technique.
This led the researchers to consider that the safety leading indicators is complicated. Additionally, they suggest that there is a two-directional correlation between leading and lagging meters. Similar, this paper was not supporting the considerable temporal feature of leading indicators. They resulted through the searching that leading indicators both led and lagged. For instance, toolbox talks caused to minimize in injuries for the first 4 months then damages led toolbox talks for the next 2 months. Herein matter, toolbox talks and injuries considered as a leading and lagging indicator, and were consequently bidirectional. This demonstrates that theory that forms the basis leading and lagging indicators is very simple in relation to the nature of construction complexity. These writers recommend concentrating fewer on leading and lagging categories, and somewhat tag indicators as positive and negative. Whereas the research almost provided the research on leading and lagging indicators, they are unsuccessful in verifying in what way the importance of their research effects management and construction companies. In spite of that, they pay attention to the significance of this paper on other research. Such that, if the use of leading and lagging expressions possibly will outcome with struggles in the research setting, would it not also cause complications in management interference? This specific question and many still in vague.
The authors of [49] evaluated the active and passive leading indicators relationship in the safety construction projects by using meta-analysis technique. Depending on [42] and [43] , the analyzing been prepared. The meta-analysis process consisted of four stages, literature reviewing, coding studies, normalizing effect sizes, computing the combined effect size. The researchers used the followed search engines to collect the papers ASCE, Web of Science, Scopus, Engineering Village, and Google Scholar. Moreover, many different keywords been used to search such as, safety management system, safety program, construction safety practices, safety performance, safety strategies, safety leading indicators, and proactive indicators. 114 papers had been selected to take apart in the study. Some conditions must be present in the studies that participate in the meta-analysis procedure, if they: 1) examined the association between either active or passive safety leading indicators and accidents or injury; 2) re-counted the effect size (e.g., correlation values) or sufficient info to compute the effect size; 3) tested data from the construction industry; and 4) were peer studied.
As a result, the analyzing software found that the effect sizes of correlation of leading and lagging are extensively different, nine construction safety leading indicators participated in this analysis. The effect sizes of the relationships among safety inspection and observation and injury (r = 0.51; 95%CI = 0.30–0.67) and between pre-task safety meeting and injury were very large (r = 0.45; 95%CI = 0.32–0.57). For the nine passive leading indicators, eight were significant (p < 0.05), the relationship between injury rate and safety record (r =0.56; 95%CI = 0.20–0.79) and safety resources (r =0.48; 95% CI = 0.28 to 0.65) had large effect sizes. Staffing for safety (r = 0.44; 95%CI =0.12–0.68), owner involvement (r =0.45; 95%CI =0.16–0.67), training and orientation (r = 0.42; 95%CI = 0.10–0.66), personal protective equipment (r = 0.40; 95%CI =0.17–0.58), and incentives programs (r = 0.30; 95%CI =0.15–0.43) were all moderate. Finally, the effect size of safety inspections and observation was low (r = 0.27; 95%CI = 0.12–0.41), and that of pre-task meetings was not significant (p = 0.103). Finally, the results ensured that the pre-task safety meetings considered an important forecaster for future performance measurement. If dignified and preserved as an active leading indicator. However, considering pre-task safety meetings as a passive pointer is not prognostic.
In [34], the research demonstrates a method in order to improve the leading indicators that categorize the location according to construction work safety risk. The key forms of statistics involved is the safety examination accounts, accident cases and project-related data. The data achieved from a big contractor company in Singapore and collected from 2010 till 2016. From 33 independent variables, 13 input variables had been chosen by a connection of Boruta feature collection technique and decision tree. Six of 13 input variables are project-related (type of project, project possession, contract amount, percent finished, level of postponement and plan manpower) and 7 of them are matters in the contractor’s safety inspection checklists (crane/lifting operations, scaffold, mechanical-elevated working platform, falling hazards/openings, environmental management, good practices and weighted safety inspection score). The author used 5 common machine learning algorithms to run models for the forecast of accident existence and harshness. Throughout predicting the validity, random forest (RF) added the greatest forecast performance with an accurateness of 0.78 and has attained a considerable power of arrangement with Weighted-Kappa Statistics of 0.70. Associating with parallel studies, this outcome is talented. The forecast (i.e. the output variable) added by the RF model can be used as a safety leading pointer of the risk level of a place. It is suggested that the prognostic RF model be organized in construction administrations, particularly large public and private creators, contractors and industry relations, to offer a monthly prediction of project safety performance so that preventive examinations and involvements can be fulfilled in a further directed manner.
In [1] the author gathered both leading and lagging indicators for a single constructing project in order to reveal any relation between the indicators of leading and lagging. The three leading indicators recycled were pre-task plan review, worker safe behavior remark mark, and site safety audit score. After that, they have been investigated to show a correlation between the four lagging indicators: first aid or emergency treatment, near-miss incidents, OSHA recordable incidents, and all project incidents. This info was gathered for 37 weeks by safety professionals. The researchers found the associations between pre-task plan review and total incidents (r =-0.507), pre-task plan review and first aid (emergency treatment) (r =-0.573), worker safe behavior observations and whole incidents (r =-0.588), worker safe behavior observations and first aid (r =-0.635). Although the relationships observed were talented, the statistical significance for the correlation coefficients were not added. Additionally, the research based on optimistic results to clarify that out of 12 only 4 only correlations sustained the research hypothesis. The writer added little dialogue of the undesirable results or afford results that did not support their 19 hypotheses. Meanwhile, this research paper started the conversation on leading and lagging indicators on construction projects, an additional vigorous investigation should be done.
The four studied that discussed above added the information in leading and lagging during a construction job. The pilot/case study type of study delivered the vision into the actual relations of these indicators, but superior examples want to be recycled in extra research. Moreover, the results showed that the leading and lagging are not easily correlated and are complex in construction work. While there is a lack of info on the correlation between leading and lagging, some decisions must be done depending on the articles examined. Lagging indicators based on injuries and incidents. All lagging pointers had negative results, corresponding the description of lagging indicators. Further hand, leading indicators can be classified into categories: attitudes and avoidance actions. Instances of leading indicators that evaluate outlooks contain the safety climate and manager attitude towards safety. Illustrations of leading indicators concentrated on the protective measures such as, employee safe behaviors, site safety inspections and pre-task safety plans. Leading indicators depended on the popular attitudes, this result is because the avoidance leading indicators measurement not always negatively related to lagging indicators such as pre-task plan review and site inspections, shown by researches [1] and [23].
3. Conclusion
In conclusion, the sample size of 18 recent articles have been reviewed and analyzed to make a confident conclusion about the leading and lagging indicators in construction. The research is made in order to distinguish the positive and negative impacts between leading and lagging indicators and how they correlate to each other’s. Only four papers discuss the interrelation between leading and lagging indicators. Ten leading indicators and two lagging indicators have been resulted after analyzing 19 indicators to be further investigated in the future works, which focused on contractor project data. This review paper will be very benefit to be a start point in the deeply future research.
- J. Wanberg, C. Harper, M. R. Hallowell, and S. Rajendran, “Relationship between construction safety and quality performance,” J. Constr. Eng. Manag., vol. 139, no. 10, p. 04013003, 2013.
- M. R. Hallowell and J. A. Gambatese, “Construction safety risk mitigation,” J. Constr. Eng. Manag., vol. 135, no. 12, pp. 1316–1323, 2009.
- S. Neamat, “Factors Affecting Project Performance in Kurdistan Region of Iraq,” Int. J. Adv. Eng. Res. Sci., vol. 4, no. 5.
- J. A. Gambatese, J. W. Hinze, and C. T. Haas, “Tool to design for construction worker safety,” J. Archit. Eng., vol. 3, no. 1, pp. 32–41, 1997.
- T. M. Toole, “Construction site safety roles,” J. Constr. Eng. Manag., vol. 128, no. 3, pp. 203–210, 2002.
- N. A. Kartam, “Integrating safety and health performance into construction CPM,” J. Constr. Eng. Manag., vol. 123, no. 2, pp. 121–126, 1997.
- J. Hinze, J. Nelson, and R. Evans, “Software integration of safety in construction schedules,” presented at the Proceedings of the 4th Triennial International Conference, Rethinking and Revitalizing Construction Safety, Health, Environment and Quality, Port Elizabeth, South, Africa, 2005, pp. 16–17.
- P. X. Zou, “Fostering a strong construction safety culture,” Leadersh. Manag. Eng., vol. 11, no. 1, pp. 11–22, 2010.
- K. Jacksi, “Database Teaching in Different Universities: A Phenomenographic Research,” Int. J. Emerg. Technol. Comput. Appl. Sci., vol. 2, no. 12, pp. 96–100, May 2015.
- S. Neamat and I. Yitmen, “Factors Affecting the Innovation and Competitiveness in Kurdistan Region of Iraq Construction Industry,” Int. J. Adv. Eng. Res. Sci. IJAERS, vol. 4, no. 2, pp. 157–162, 2017.
- S. Neamat, “The Development Of Management Control Systems Framework In Public-Private Partnerships,” Int. J. Sci. Technol. Res., vol. 8, no. 10, pp. 299–305, 2019.
- S. Neamat, “A Developed Framework for Energy Technology Sustainability Assessment,” Int. J. Innov. Technol. Explor. Eng. IJITEE, vol. 9, no. 1, pp. 832–838, 2019.
- S. Neamat, “Models Developed for Creep of High Strength Concrete,” Infogain Publ, vol. 3, no. 3, pp. 174–80, 2017.
- S. D. Salahaddin, “Factors Affecting the Competitiveness and Innovation in Northern Iraq Construction Industry,” 2016.
- K. Jacksi and S. M. Abass, “Development History of the World Wide Web.”
- K. Jacksi, “Design and Implementation of E-Campus Ontology with a Hybrid Software Engineering Methodology.”
- K. Jacksi, S. R. M. Zeebaree, and N. Dimililer, “LOD Explorer: Presenting the Web of Data,” Int. J. Adv. Comput. Sci. Appl. IJACSA, vol. 9, no. 1, 2018.
- M. A. Sadeeq, S. R. Zeebaree, R. Qashi, S. H. Ahmed, and K. Jacksi, “Internet of Things Security: A Survey,” presented at the 2018 International Conference on Advanced Science and Engineering (ICOASE), 2018, pp. 162–166.
- K. Jacksi, N. Dimililer, and S. R. M. Zeebaree, “A Survey of Exploratory Search Systems Based on LOD Resources,” in PROCEEDINGS OF THE 5TH INTERNATIONAL CONFERENCE ON COMPUTING & INFORMATICS, COLL ARTS & SCI, INFOR TECHNOL BLDG, SINTOK, KEDAH 06010, MALAYSIA, 2015, pp. 501–509.
- K. Jacksi, N. Dimililer, and S. R. Zeebaree, “State of the Art Exploration Systems for Linked Data: A Review,” Int. J. Adv. Comput. Sci. Appl. IJACSA, vol. 7, no. 11, pp. 155–164, 2016.
- J. Hinze, S. Thurman, and A. Wehle, “Leading indicators of construction safety performance,” Saf. Sci., vol. 51, no. 1, pp. 23–28, 2013.
- N. V. Schwatka, S. Hecker, and L. M. Goldenhar, “Defining and measuring safety climate: a review of the construction industry literature,” Ann. Occup. Hyg., vol. 60, no. 5, pp. 537–550, 2016.
- H. Lingard, R. Wakefield, and P. Cashin, “The development and testing of a hierarchical measure of project OHS performance,” Eng. Constr. Archit. Manag., vol. 18, no. 1, pp. 30–49, 2011.
- B. H. Guo and T. W. Yiu, “Developing leading indicators to monitor the safety conditions of construction projects,” J. Manag. Eng., vol. 32, no. 1, p. 04015016, 2015.
- M. Niu, R. M. Leicht, and S. Rowlinson, “Developing safety climate indicators in a construction working environment,” Pract. Period. Struct. Des. Constr., vol. 22, no. 4, p. 04017019, 2017.
- K. Ng, A. Laurlund, G. Howell, and G. Lancos, “An experiment with leading indicators for safety,” presented at the Proceedings Annual International Group for Lean Construction Conference, 2010, pp. 253–262.
- K. Ng, A. Laurlund, G. Howell, and G. Lancos, “lean safety: using leading indicators of safety Incidents to improve construction safety,” presented at the Proceedings for the 20th Annual Conference of the International Group for Lean Construction: are We Near a Tipping Point, 2012, p. 173.
- H. Lingard, M. Hallowell, R. Salas, and P. Pirzadeh, “Leading or lagging? Temporal analysis of safety indicators on a large infrastructure construction project,” Saf. Sci., vol. 91, pp. 206–220, 2017.
- T. Reiman and E. Pietikäinen, “Leading indicators of system safety–monitoring and driving the organizational safety potential,” Saf. Sci., vol. 50, no. 10, pp. 1993–2000, 2012.
- J. Hinze, S. Thurman, and A. Wehle, “Leading indicators of construction safety performance,” Saf. Sci., vol. 51, no. 1, pp. 23–28, 2013.
- S. Rajendran, “Enhancing construction worker safety performance using leading indicators,” Pract. Period. Struct. Des. Constr., vol. 18, no. 1, pp. 45–51, 2012.
- G. Delatour, P. Laclémence, D. Calcei, and C. Mazri, “Safety performance indicators: a questioning diversity,” presented at the 6. International Conference on Safety & Environment in Process & Power Industry (CISAP-6), 2014, vol. 36, pp. 55–60.
- E. H. Sparer, R. F. Herrick, and J. T. Dennerlein, “Development of a safety communication and recognition program for construction,” New Solut. J. Environ. Occup. Health Policy, vol. 25, no. 1, pp. 42–58, 2015.
- C. Q. Poh, C. U. Ubeynarayana, and Y. M. Goh, “Safety leading indicators for construction sites: A machine learning approach,” Autom. Constr., vol. 93, pp. 375–386, 2018.
- K. H. D. Tang, S. Z. M. Dawal, and E. U. Olugu, “A review of the offshore oil and gas safety indices,” Saf. Sci., vol. 109, pp. 344–352, 2018.
- J. M. Almost et al., “A study of leading indicators for occupational health and safety management systems in healthcare,” BMC Health Serv. Res., vol. 18, no. 1, p. 296, 2018.
- J. Manjourides and J. T. Dennerlein, “Testing the associations between leading and lagging indicators in a contractor safety pre-qualification database,” Am. J. Ind. Med., vol. 62, no. 4, pp. 317–324, 2019.
- K.-H. Liu, J. Tessler, L. A. Murphy, C.-C. Chang, and J. T. Dennerlein, “The gap between tools and best practice: an analysis of safety prequalification surveys in the construction industry,” NEW Solut. J. Environ. Occup. Health Policy, vol. 28, no. 4, pp. 683–703, 2019.
- W. M. Alruqi and M. R. Hallowell, “Critical Success Factors for Construction Safety: Review and Meta-Analysis of Safety Leading Indicators,” J. Constr. Eng. Manag., vol. 145, no. 3, p. 04019005, 2019.
- S. Neamat, “Risk Assessment for Uzun Construction and Real Estate Company in TRNC,” Sch. J. Econ. Bus. Manag., vol. 5, no. 3, pp. 332–343, 2018.
- K. Ng, A. Laurlund, G. Howell, and G. Lancos, “lean safety: using leading indicators of safety Incidents to improve construction safety,” presented at the Proceedings for the 20th Annual Conference of the International Group for Lean Construction: are We Near a Tipping Point, 2012, p. 173.
- N. A. Card, “Applied meta-analysis for social science research: Methodology in the social sciences,” N. Y. Guilford, 2011.
- J. Tenboer et al., “Time-resolved serial crystallography captures high-resolution intermediates of photoactive yellow protein,” Science, vol. 346, no. 6214, pp. 1242–1246, 2014.
No related articles were found.