Multiscale Texture Analysis and Color Coherence Vector Based Feature Descriptor for Multispectral Image Retrieval

Adv. Sci. Technol. Eng. Syst. J. 4(6), 270–279 (2019);
 DOI: 10.25046/aj040634
Content Based Image Retrieval (CBIR) for remote sensing image data is a tedious process due to high resolution and complexity of image interpretation. Development of feature extraction technique is a major portion to represent the image content in an optimal way. In this paper, we propose a feature descriptor which combines the color coherent pixel information and GLCM texture features in multi scale domain. Curvelet transform is used to decompose the image into coarse and detail coefficients. Then Gabor magnitude is computed for each coefficient to improve the directional information. GLCM texture features are extracted from the Gabor magnitude response. The novel feature set by combining the CCV and GLCM using curvelet and Gabor filter is developed. Mahalanobis distance measure is used to find the similarity between query and feature database. Average Normalized Modified Retrieval Rate (ANMRR) is computed to evaluate the performance with the state of art methods.
1. Introduction
Texture represent the pattern arrangement of the pixels in the image. It is an inherent property of any image. Especially in remote sensing applications, images represent the surface reflectance of the earth. Various sensors are used to capture the earth surface like Multi/Hyperspectral, RADAR and LiDAR [1]. Texture extraction in spatial domain using Local Binary Patterns (LBP) and Gray Level Co-Occurrence Matrix has been explained in [2, 3, 4]. Other local texture pattern features like Local Derivative Patterns (LDP), Local Tetra Patterns (LTrp) are reviewed by [5, 6]. Recent advancements in texture features have been developed using multi-scale GLCM windows [7] and Local Contourlet Tetra Patterns [8]. Texture analysis in multi-scale and multi resolution analysis is very useful to extract more precise features. In proposed work, Curvelet transform has been used to analyze the input image in multi scale domain. Curvelet is directionally more efficient than other existing multi resolution transforms. It can preserve the tiny non linear edge information due to its anisotropic nature. Coarse and detail scale coefficients of curvelet are used to compute the Gabor magnitudes. Total four Gabor magnitude responses are be used to extract the GLCM properties. Applying the Gabor magnitudes on each scale of curvelet gives more directional features of the non linear edges. Texture information extracted from these coefficients can perform retrieval applications efficiently. To carry the spatial domain information, color coherent pixels are computed and merged to the texture feature descriptor. The proposed feature descriptor outperforms the state of art retrieval methods. It has been tested on the public remote sensing image retrieval dataset namely UCmerced. The paper has been organized as follows: Section 2 Related work, Section 3 Methodology,Section 4 Results & Evaluation and Section 5 Conclusion.
2. Related Work
2.1 Importance of Texture Feature in Remote Sensing
In recent years, many texture-based feature descriptors have been developed for the purpose of CBIR in remote sensing. This section explaines comprehensive review of texture feature extraction in remote sensing image data. The importance of spatial information retrieval in theoretical perspective for model fit and model selection techniques has been explained by Mihai Datcu, et.al, in (1998) [9]. Seisuke Fukuda, et.al (1999) have developed a wavelet-based texture feature set for the polarimetric SAR image data, Where Downsampling of wavelet coefficients are omitted. The energy of the wavelet coefficients is considered as texture descriptor [10]. M. ChicaOlmo, et.al (2000) have proposed univariate and multivariate texture features by using spatial variability based variogram measures [11]. It will refine the spatial and spectral structure of the image. A multiband image will be given as an output to quantify the local spatial variability of radiometric data. Jean-Luc Starck, et.al (2002) have improved the curvilinear feature extraction in multiscale domain by using curvelet transform to overcome the wavelet drawbacks [12]. Second and higher order statistical measures have been applied to get the texture information in multiscale and multi resolution domains. Andrey V. Bogdanov, et.al (2005) have applied neural network based classification on GLCM features for the classification of the sea ice in multi-sensor data [13]. F. Kayitakire (2006), et.al, have derived Forest variables from the high spatial resolution data by using GLCM [14]. Interactive retrieval system is proposed by Marin Ferecatu, et.al (2007), using relevance feedback method to improve the accuracy[15].
Feature level fusion also improves classification accuracy. Vijaya V, et.al (2009) had developed a system for texture feature classification by fusing statistical and wavelet-based texture features [16]. Changren Zhu, et.al (2010) have proposed shape and texture based feature set for detecting the ship in spaceborne optical images. Compactness, Convexness, Rectangularity, and Eccentricity are used for the shape based feature set and Mean, Standard variance and Entropy are used for analyzing the statistical features. Local Multiple Patterns are used as local texture features [17]. Shufu Xie, et.al (2010) had developed a Local Gabor Xor Patterns
(LGXP) for facial recognition [18]. Multi-resolution based feature extraction has succeeded in extracting robust features. Gholamreza Akbarizadeh, et.al (2012) have proposed Kurtosis wavelet energy feature for the texture recognition in SAR images [19]. 3D DWT is suitable for extracting structure and texture information from the Hyperspectral data. Hyperspectral image consists of continuous spectral bands that provide more accurate information. Yuntao Qian, et.al (2012) has proposed a 3D wavelet-based texture feature extraction and classified it using sparse linear regression [20]. Simple statistics, Gabor filter bank and color histogram has been used as feature descriptors for efficient image retrieval by Yi Yang, et.al (2012) [21]. Local spectral histogram features are generated by merging the local histograms. Jiangye Yuan, et.al, (2014) have computed local spectral histograms and Gabor filter based texture features to segment the image regions [22]. Morphological texture features based on structuring elements have also shown good results in CBIR techniques. Erosion, Dilation, Open, Close operations by structuring elements will improve the feature extraction efficiency. Erchan Aptoula (2014) have developed a morphological texture descriptor based on Circular Covariance Histogram (CCH) and Rotation Invariant Triplet (RIT) for Land Cover image retrieval [23].
Alaa Al-Hammami and Hisham Al-Rashdan (2010) have proposed an enhancement to the Color Coherence Vector (CCV) based on modification of the distance and angle [24]. Zhenfeng Shao, et.al have extracted Gabor filter based texture and color features for retrieval application. Unichrome feature of each channel of the image data using Gabor filter with orientation (u, v) and opponent feature with (u, v’) are used as color features respectively [25]. GLCM is the best features to extract texture information of mono channel image data. For Multichannel or Hyperspectral image, Data clustering and sparse representation based GLCM has been proposed by Xin Huang, et. al (2014) [26]. Local Binary Patterns (LBP), Local
Ternary Patterns (LTP), Local Terra Patterns (LTrP) and Local Derivative Patterns (LDP) are most popular texture extraction methods evaluated by [27, 28, 29]. Color and Texture descriptor based image retrieval system has been developed by using Block Difference Inverse Probability (BDIP) and Block Variation of Local Correlation Coefficients (BVLC) by Chandan Singh, et.al (2016) [30]. Spectral end members and texture features based on GLCM has been developed for hyperspectral image retrieval by Jing Zhang, et.al (2017) [31].
2.2 Efficiency of Curvelet Transform
The wavelet-based approach have failed to preserve nonlinear singularities due to the directional limitation. Anisotropic nature of curvelet transform helps in extracting curved singularities. It is a multiscale and multi-resolution transform which can process an image in several orientations at each scale. Curvelet-based SAR image classification has been performed by using the Histogram of Curvelet (HOC) [32]. The curvelet transform has been developed by Emmanuel J. Candes, David L. Donoho, et al. (2002) in order to overcome the drawbacks of wavelet [33]. Lindsay Semler et al. (2006) highlighted the curvelet-based texture descriptors over CT scan images. Energy, entropy, mean, standard deviation has been calculated by using the effective curvelet-based texture descriptors. The results have been compared with similar algorithms based on wavelet and ridgelet descriptors [34]. Tobias Gebacket al. (2009) have explained that when the number of coefficients that are required to represent the edge to a specified accuracy is regarded, curvelets dispense an almost ideal representation of C2 edges. Decomposition of the image f into J feature levels have been furnished by the discrete curvelet transforms, with Lj directions on each level, and Kjl,1 ×Kjl,2 spatial shifts for each of these directions. [35]. Jianwei ma and Gerlindplonka (2010) have described that the compression based on a wavelet, removal of noise or structure extraction have become computationally inefficient for geometric features with line and surface singularities. The first-generation curvelets have been used for image denoising. The first-generation curvelets are also been used to intensify image contrast, render astronomical images and integrate satellite images.After introduction of the second-generation curvelets in 2004, the applications of curvelets escalated in several fields. Hybrid methods are more popular that are pertaining to discrete curvelet transform, which is formulated by incorporating curvelets with another technique for image processing [36]. F. Gomez et al. (2011) have mapped the image to the curvelet space thus data diffusion is approached by statistical parametric model for each of the sub-bands. Their proposed descriptor (Rotation invariant texture characterization using a curvelet-based descriptor) have been calculated by using the statistical patterns of the curvelet coefficients. Kullback-Leibler distance have been used to find the distance between statistical features. Curvelet is efficient in multiscale decomposition to improve the limits in wavelets for representation of geometrical information [37]. Yungang Zhang et al. (2011) had described that the idea of Discrete Curvelet Transform (DCT) is easy to choose acceptable sampling at the range of scales, position, and orientation. The prevalence space is decomposed into dyadic rectangular coronae. These dyadic spaces are further divided into wedges. The number of wedges increases two times at each level. [38]. NourElDin Laban et al. (2012) have made use of two dissimilar types of features, viz. Color Histograms (CH) and textures in wavelet domain for every band of the multispectral image. The quantization method is use to extract the color histograms from satellite images. Daubechies wavelets are used to extract texture features. The above authors proposed a technique to improve the procedure of satellite image retrieval using two stages: Candidate selection stage and Refinement stage. The refinement stage depends on the outcomes of the candidate selection stage that comprises the adjoining regions in which non-uniform polygon shapes that cover the semantic type area are utilized. They have evaluated the potentiality of their system using a wide area of satellite images and then analyzed in terms of precision and recall rates [39]. ErkanUslu et al. (2014) have stated that the curvelet becomes finer and smaller in the spatial domain and shows more reactivity to curved edges when the resolution level increases. This allows to capture the curves in an image efficiently. As a result, a few coefficients can estimate curved singularities. The energy feature is computed in both discrete curvelet transform and wavelet transform[40]. Benoit Beguet et al. (2014) have developed a global framework of forest variable retrieval methodology by using Haralick Texture Features. The panchromatic and multispectral bands are used to create test frames which are made up of image samples. Then the texture features which have several parameterizations are computed on test frames. Using these test frames, linear regression based feature selection is performed for retrieving the best texture features pertaining to each forest variable. Both single and multiple linear regressions are processed. Multi-scale texture descriptors are formed by choosing the best image texture features through statistical modeling. Five common forest structure variables have been modeled efficiently [41]. WenChyi Lin et al. (2015) described that the curvelet transform for curved singularities in images is particularly attractive for multiscale analysis of microscopic tissue images where cellular structural information exhibits abundant curved singularities. Mean, energy, variance, and entropy vales are calculated as texture features in each sub-band. SVM classifier is used to classify the results of [42]. Wen-Chyi Lin et al. (2016) have explained that higher-order statistical moments of fine-scale curvelet coefficients are selected as critical features. To incorporate the skewness and kurtosis of curvelet coefficients at a specified scale as texture features. The above authors added the third and fourth order moments to variance, energy, and entropy, so that a better discriminative capability is provided to them. The curvelet coefficients are chosen as discriminative features because they are used to implicitly capture the nucleus and glandular boundary [43]. Sudheer Devulapalli and Rajakumar Krishnan (2019) have developed a image fusion application for multi sensor image data using curvelet coefficients and adaptive neuro fuzzy inference system [44]. Du-Ming Tsai et al. (2017) states that a structural texture is depicted in the satellite image by planting pattern of coffee trees. To extricate the structural features in the spectral domain for image segmentation, a technique based on Fourier transform is proposed. Unidirectional frequency components with high energy are produced by row planted coffee fields, whereas the frequency components are produced in different directions in the spectral domain image by naturally growing plants. The experimental outcome shows that row-planted coffee field can be sectioned in a satellite image with the conjunction of structural and density features. The yield of coffee production can be determined from the data on physical area and density, which is provided by these features. [45].
3. Methodology
Remote sensing benchmark multispectral dataset UC Merced is considered for the experiment in the proposed work. The dataset is consisting of 21 classes of land use data for research purpose [46]. The images are subsampled from USGS National Map urban area image collection. Each image consists of 256 x 256 pixels. The resolution of each pixel is 1 foot. The input image bands will be separated to apply the 2D Fast Discrete Curvelet Transform in Unequally Spaced Fast Fourier Transform (USFFT). Curvelet transform will decompose the image into three coefficients which are coarse, detail, and fine scale coefficients. The detail scale coefficients again consist of multiple orientations at each resolution [47]. Figure. 1 shows the process of retrieval system.
3.1 Feature Extraction
3.1.1 Probabilistic Principle Component Analysis (PPCA)
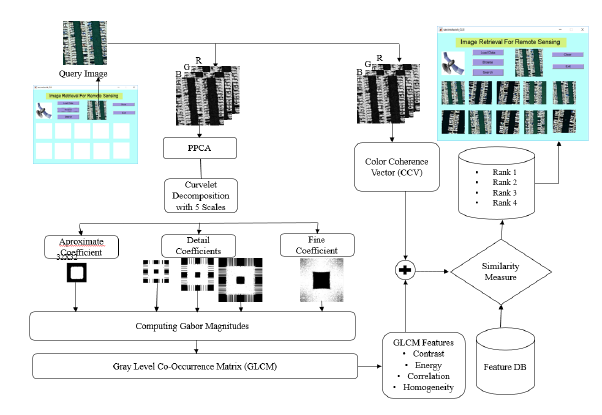 Figure 1: Architecture of the proposed system
PCA is a popular method for dimensionality reduction. It will increase the variance of the projected space. The high dimensional strongly correlated data {Dp}pP will be converted into low dimensional uncorrelated data {Dl}lL removing low variance data. This may lead to some data loss due to reducing the dimension to (P-L) Eigen subspace. PPCA is a method of finding principal axes by the probabilistic way [48]. Each variable of this model is calibrated by a specific probability density function (pdf). The uncorrelated input variable z with some additive noise e is represented by the equation form x=A.z+e. Where A is model parameter. If some probability densities are set to the generative input variable then it can be called as probabilistic model. PPCA is used to find the maximum likelihood parameter set Θ ≡ A,λ. Where AR(p×L) is the loading the matrix, z is pdf of latent variable and e is pdf
of additive noise variable. The parameter Θ can be measured by Expectation and Maximization (EM) algorithm [49]. PPCA assumes that p(z) = ℵ(z : 0,I) and p(e) = ℵ(e : 0,λ.I). Gaussian pdf is similar to linear operations so that the linear transformation of the Gaussian will produce the new Gaussian distribution.
3.1.2 Curvelet Decomposition
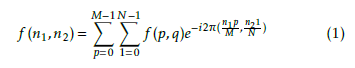
The directionality and anisotropic natures are the main features of the curvelet transform which can help to extract more information from the image data. The curvelet transform decomposes the image into three components like coarse, detail and fine scale coefficients [50]. The input image I will be decomposed with the help of low pass and bandpass filters l0,∆s respectively. ∆s = {∆1I,∆2I,∆3I…∆sI} where ∆s contains the 2−2s width. The Discrete Fourier Transform (DFT) will be applied to the input image to apply the filters at different scales. Mathematical derivation of the DFT is as follows
 The default number of scales will be log 2(n) – 3. Where n is length of the image. Curvelet coefficients are denoted as c{j}{l}{k} = f ,ϕj,l,k . Where j represents scale, l represents orientation and k represents the position (k1,k2). The curvelet coefficients can be stored in a cell matrix Cj,l. Here scale j is from coarse to finest and orientation l is starts from top left corner and rotates in clockwise[51]. The rotation angles θj,l will be equidistant and sequence can be −dj/2e
πl2 with l = 0,1,…4.2dj/2e − 1. For represented as θj,l := 2 the value of j=4 rotation angle θj,l = πl/8,l = 0,1,2,…15 and eight translations with different grids will be considered. The grid sizes will be 1/2−j ×1/2−j/2. So the anisotropic scaling principle of the curvelet will be width = length2.
Each subband is partitioned into squares of proper scales as, ∆sI → (WQ∆sI)QQs. Where WQ is smooth window. Assume that window WQ (n1, n2) is supported within the sheared rec angle pj = (n1,n2) : 0 ≤ n1 −n0 < L(j),−Lj/2 ≤ n2 < Lj/2 The localized dyadic squares Q . By multi-
plying the function with corresponding window function will give the localized result near Q. Let (TQI) denotes the operator which can transport and renormalizes I so the part of the input supported near Q will become the part of the output supported near to [0,1]2. TQI(n1,n2) = 2sI(2sn1−k1,2sn2−k2).The outcomes of dyadic squares are renormalized into single scale. gQ = (TQ)( − 1)(WQ∆sI),QQs. Each standardized dyadic square will be analyzed by ridgelet transform. It has basis element ρλ that make an orthonormal basis for l2(R2).αµ = (gQ,ρλ)whereµ = (Q,λ).
3.1.3 Color Coherence Vector
Color histograms are the most popular features to extract color descriptors for CBIR. But the spatial information will not cover by the color histogram features. To consider the color and spatial information of the image Color Coherence Vector (CCV) [53, 52] descriptor has been used. The first stage to compute the CCV is blurring the image with Gaussian filter. Then the discretization of the color space will be applied to divide into n distinct colors of the image. The input image has 3 channels, discretization function will find unique colors in each channel to form V unique values of each channel. Table. ?? shows the pseudo code for computing CCV feature vector.
3.1.4 Gabor Magnitude
Magnitude response of image will be calculated by applying Gabor transform for an input image in multiple scales and different orientations [54]. Bandlimited filters can be used to represent optimal localization in both spatial and frequency domain. If the amplitude of the frequency spectrum goes to zero which exceeds the threshold frequency value. The Gabor transform can also be defined as a Short Time Fourier Transform (STFT) with a Gaussian kernel. The 2D Gabor filter can be mathematically defined as
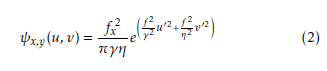 where u0 = ucosθy +vsinθy, v0 = −ucosθy +vsinθy, fx = 2f(maxx/2) , θy = yπ/8. fx and θy Parameters are the center frequency and orientation of the plane wave for the Gaussian kernel. The variables γ is the ratio of the center frequency and η is the sharpness constant. If the γ and η values are fixed then the center frequency fu will define the scale of the Gabor filter. Gabor filters are complex type, which is a combination of sine and cosine functions. Gabor filter is applied to the input gray image with wavelength 4 and 90-degree orientation. Wavelength denotes the sinusoidal carrier in pixels per cycle. Orientation defines the direction of the plane wave range in 0 to 360 degree. Convolution of the Gabor filter and input image will produce the resultant image in the time-frequency domain. It can be decomposed into real and imaginary parts [55]. The mathematical representations of the convolution and decomposition as follows
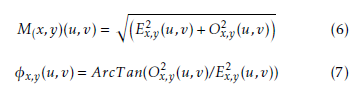
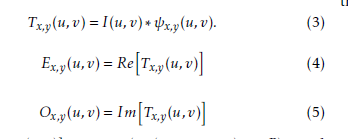 where Re[Tx,y(u,v)] = cos(2π(x0u + y0v) + P ) and Im[Tx,y(u,v)] = sin(2π(x0u + y0v) + P ). Tx,y(u,v) is the transformed image obtained after convoluting with Gabor filter ψx,y(u,v). u, v are the spatial coordinates of the image. Where I is the input image. Ex,y(u,v) and Ox,y(u,v) are the even and odd functions for the sin and cosine functions and P is the phase response of the sinusoid carrier. From the decomposed sine and cosine functions of the Gabor filter, Magnitude and Phase responses will be calculated as follows
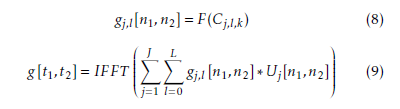
 The magnitude responses for the curvelet coefficients are considered for the extraction of Haralick texture features. The adjoint transform of the curvelet coefficients will be computed for each scale j and orientation l by applying 2D Inverse Fast Fourier Transform (IFFT).
 The adjoint transform will be computed for coarse, detail and fine scale coefficients separately. Gabor transform will be applied on the resultant image at each scale to compute the magnitude response. The surface view of the magnitude response at each scale has shown in Figure. 2.
3.1.5 Texture Analysis
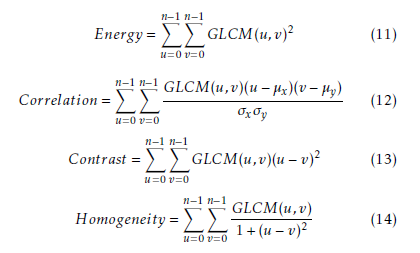
To identify local or global pixel patterns, texture features are very important. GLCM plays a vital role in texture analysis. Haralick, et.al, (1973) derived statistical texture features based on GLCM. GLCM matrix consists value i with a sum of the frequency of the pixel value at a pixel value u with a pixel value y in a specific spatial orientation at v. Mathematically it can be represented as follows
![]() The texture is an inherent property for all kind of surfaces. It can give important information about the pixel arrangement structure of each surface and spatial relationship. The smallest differences in texture for large image databases is very difficult. GLCM properties will be helpful to detect the texture features in local and global areas. Some of the GLCM properties derived by Haralick [4] are considered for the experiment.
The texture is an inherent property for all kind of surfaces. It can give important information about the pixel arrangement structure of each surface and spatial relationship. The smallest differences in texture for large image databases is very difficult. GLCM properties will be helpful to detect the texture features in local and global areas. Some of the GLCM properties derived by Haralick [4] are considered for the experiment.
 3.2 Similarity Measure
In this work, the Mahalanobis distance measure is used as a distance metric. Suppose if there are two groups G1 and G2 with some characteristics. these characteristics are considered as the feature vectors representing the objects of each group [56]. the feature vector x with dimension p have the same variation about its mean within either group. The mathematical representation of Mahalanobis distance is as follows
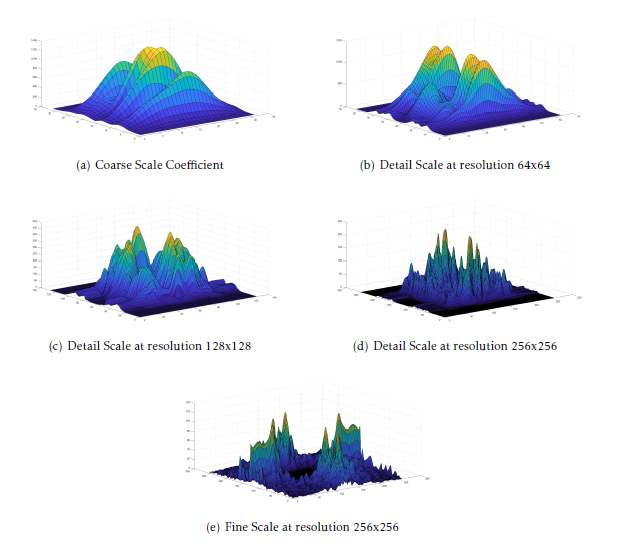 Figure 2: Gabor Magnitude Responses of the Curvelet Coefficients
![]() where µ1andµ2 are the mean of two vectors S is covariance matrix.
where µ1andµ2 are the mean of two vectors S is covariance matrix.
4. Results and Evaluation
The features have been extracted using the process explained in the section2. The experiment has been conducted on UC Merced Land use dataset which contains 21 classes with 50 samples of each class. Each image has 256×256 pixels. The spatial resolution of the data is 0.3m. The feature descriptor size for each image is 1×24. color coherence vector feature length is 1×8 because in this experiment only coherent pixel information is considered as a feature. The color coherence vector feature is computed for the multispectral image directly. Further feature extraction process the input image will be reduced to a single band by applying PPCA. The resulting of PPCA image will be decomposed into coarse and detail coefficients using curvelet transform. The coarse coefficient in one scale and detail coefficients at three different scales are used to extract the texture information. Obtained Gabor magnitude response of each coefficient to compute the GLCM properties. Contrast, Correlation, Energy and Homogeneity features have been extracted from each coefficient. The feature length of texture features is 1 × 16. The color and texture features will be combined together to form a single feature descriptor of an image. Feature descriptor of each image in the database will be computed and stored as a feature base. While the query image submitted to the retrieval system the same features will be extracted to describe the content of the image and matched with the feature base using Mahalanobis similarity metric. The feature obtained lower distance is considered as the most relevant image to the query. In this experiment, top 10 relevant images are shown as a result. Figure. 3 shows the retrieval results of four different classes in the dataset.
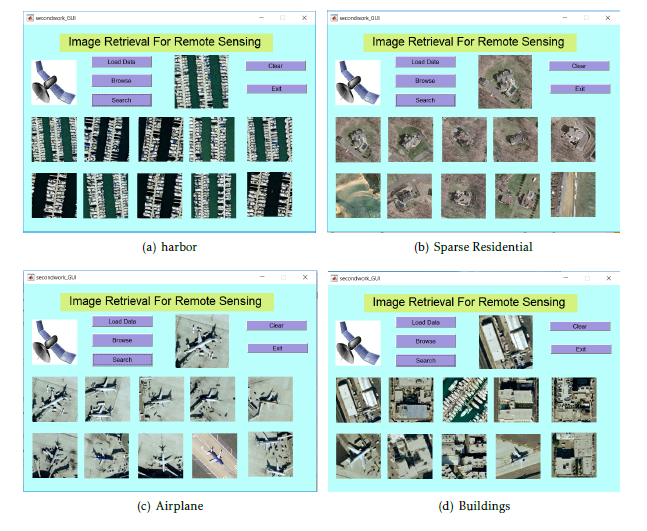 Figure 3: Retrieval Results of the System
The performance metrics are very much important to compare the system accuracy with other systems. The most important performance measures are precision and Recall. Precision can be described as a number of relevant images retrieved over a total number of images retrieved. Recall can be defined as number of relevant images retrieved over the total number of relevant images in the database. These traditional measures will not considered the position of the relevant image appears among the top retrieved results. The retrieval system performance is evaluated by using Average Normalized Modified Retrieval Rate (ANMRR) metric [57, 58]. ANMRR The performance metric ANMRR as shown below
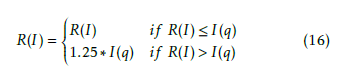 where R(I) is position of relevant image I retrieved, I(q) is retrieved images for query q. I(q) = min{4.T G(q),2.max[T G(q),∀q]} Average Rank will be calculated as follows
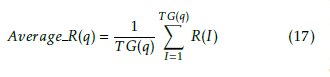 where TG(q) is the total ground truth images in the database to the query q. TG(q) is influencing the average rank in the above equation. to reduce this factor Modified Retrieval rate (MRR) is computed as Aerage R(q)−0.5.[1+T G(q)]. Normalization will be applied to make the value exist between 0 and
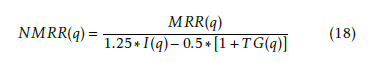 Finally the ANMRR is derived for the Total number of queries TQ is follows
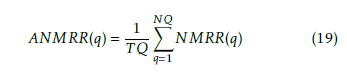 Table 2 shows the ANMRR values for the sample retrieval results with ten queries from each class. we have tested for the four classes in the database. Retrieval performance was compared with the five existing popular texture feature extraction methods. The proposed method is developed by combining the CCV and texture features using GLCM from the Gabor magnitude of the curvelet sub-bands in different scales. Extracting Gabor magnitude from the curvelet sub-bands in multiple scales will improve the directional features of the input image. Curvelet is capable of extracting anisotropic edge information in various orientations at different scales. The resultant of the curvelet decomposed image will have one coarse and three detail coefficients as explained in the section 3. The comparison of the proposed method with existing literature has been shown in Figure 4.
5. Conclusion
Table 2: ANMRR Performance Results |
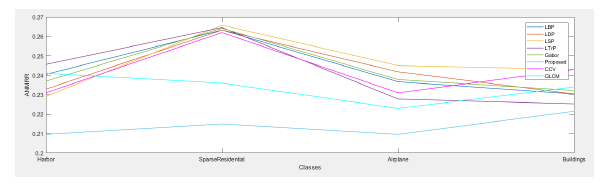 Figure 4: Performance Graph for state of art methods
This paper develops a feature extraction method which is a combination of color coherent pixel information and multi scale texture features. The proposed feature descriptor is extracted using Haralick texture features from curvelet coefficients. To extract the robust directional infornamtion, Gabor magnitude responses are computed from the curvelet coefficients. Haralick texture features extracted from the resultant gabor magnitude responses are shown best retrieval rate than other state of art feature extraction techniques. It improves the retrieval accuracy of the CBIR search engines. Retrieval system was tested on various classes of remote sensing image data. ANMRR performance metric gives the best average retrieval rate for a set of queries from various classes. Four classes have been tested in the dataset. This work will be enhance by adopting machine learning techniques for the target classification for high resolution imagery data.
- Melesse, Assefa, et al. ”Remote sensing sensors and applications in en- vironmental resources mapping and modelling.” Sensors 7.12 (2007): 3209-3241.
- He, Dong-Chen, and Li ”Texture unit, texture spectrum, and texture analysis.” IEEE transactions on Geoscience and Remote Sens- ing 28.4 (1990): 509-512. DOI:10.1109/TGRS.1990.572934.
- Guo, Zhenhua, Lei Zhang, and David Zhang. ”A completed mod- eling of local binary pattern operator for texture classification.” IEEE transactions on image processing 19.6 (2010): 1657-1663. DOI: 1109/TIP.2010.2044957.
- Haralick, Robert M., and Karthikeyan Shanmugam. ”Textural features for image ” IEEE Transactions on systems, man, and cybernetics 6 (1973): 610-621.
- Juneja, Komal, et al. ”A survey on recent image indexing and retrieval techniques for low-level feature extraction in CBIR ” 2015
- IEEE International Conference on Computational Intelligence & Com- munication Technology. IEEE, 2015. DOI:10.1109/CICT.2015.92
- Yadav, Susheel Kumar, Dhirendra Pratap Singh, and Jaytrilok Choud- ”A Survey: Comparative Analysis of Different Variants of Local Binary Pattern.” 2018 Second International Conference on Inventive Communication and Computational Technologies (ICICCT). IEEE, 2018.DOI:10.1109/ICICCT.2018.8473220.
- Lan, Zeying, and Yang ”Study on multi-scale window deter- mination for GLCM texture description in high-resolution remote sensing image geo-analysis supported by GIS and domain knowl- edge.” ISPRS International Journal of Geo-Information 7.5 (2018): 175.DOI:10.3390/ijgi7050175.
- Kumar, TG Subash, and Nagarajan. ”Local contourlet tetra pattern for image retrieval.” Signal, Image and Video Processing 12.3 (2018): 591-598.DOI:10.1007/s11760-017-1197-1.
- Datcu, Mihai, Klaus Seidel, and Marc Walessa. ”Spatial information retrieval from remote-sensing images. I. Information theoretical per- ” IEEE transactions on geoscience and remote sensing 36.5 (1998): 1431-1445.DOI:10.1109/36.718847.
- Fukuda, Seisuke, and Haruto ”A wavelet-based texture fea- ture set applied to classification of multifrequency polarimetric SAR images.” IEEE Transactions on Geoscience and Remote Sensing 37.5 (1999): 2282-2286.DOI:10.1109/36.789624.
- Chica-Olmo, , and F. Abarca-Hernandez. ”Computing geostatis- tical image texture for remotely sensed data classification.” Com- puters & Geosciences 26.4 (2000): 373-383. DOI:10.1016/S0098- 3004(99)00118-1.
- Starck, Jean-Luc, Emmanuel Cande`s, and David L. Donoho. ”The curvelet transform for image denoising.” IEEE Transactions on image processing 11.6 (2002): 670-684. DOI: 10.1109/TIP.2002.1014998.
- Bogdanov, Andrey , et al. ”Multisensor approach to auto- mated classification of sea ice image data.” IEEE Transactions on geoscience and remote sensing 43.7 (2005): 1648-1664.DOI:1201/9781420003130.ch25.
- Kayitakire, Franc¸ois, Hamel, and Pierre Defourny. ”Retrieving for- est structure variables based on image texture analysis and IKONOS-2 imagery.” Remote sensing of environment 102.3-4 (2006): 390-401. DOI:10.1016/j.rse.2006.02.022.
- Ferecatu, Marin, and Nozha Boujemaa. ”Interactive remote-sensing image retrieval using active relevance feedback.” IEEE Transac- tions on Geoscience and Remote Sensing 45.4 (2007): 818-826. DOI:10.1109/TGRS.2007.892007.
- Chamundeeswari, Vijaya , Dharmendra Singh, and Kuldip Singh. ”An analysis of texture measures in PCA-based unsupervised classifi- cation of SAR images.” IEEE Geoscience and Remote Sensing Letters 6.2 (2009): 214-218.DOI:10.1109/LGRS.2008.2009954.
- Zhu, Changren, et al. ”A novel hierarchical method of ship detection from spaceborne optical image based on shape and texture features.” IEEE Transactions on geoscience and remote sensing 9 (2010): 3446- 3456.DOI:10.1109/TGRS.2010.2046330.
- Xie, Shufu, et ”Fusing local patterns of gabor magnitude and phase for face recognition.” IEEE transactions on image processing 19.5 (2010): 1349-1361. DOI:10.1109/tip.2010.2041397.
- Akbarizadeh, Gholamreza. ”A new statistical-based kurtosis wavelet energy feature for texture recognition of SAR ” IEEE Trans- actions on Geoscience and Remote Sensing 50.11 (2012): 4358- 4368.DOI:10.1109/TGRS.2012.2194787.
- Qian, Yuntao, Minchao Ye, and Jun Zhou. ”Hyperspectral im- age classification based on structured sparse logistic regression and three-dimensional wavelet texture features.” IEEE Transac- tions on Geoscience and Remote Sensing 51.4 (2012): 2276-2291. DOI:10.1109/TGRS.2012.2209657.
- Yang, Yi, and Shawn Newsam. ”Geographic image retrieval using lo- cal invariant features.” IEEE Transactions on Geoscience and Remote Sensing 51.2 (2012): 818-832.DOI:10.1109/TGRS.2012.2205158.
- Yuan, Jiangye, DeLiang Wang, and Rongxing Li. ”Remote sensing im- age segmentation by combining spectral and texture features.” IEEE Transactions on geoscience and remote sensing 52.1 (2013): 16-24. DOI:10.1109/TGRS.2012.2234755.
- Aptoula, ”Remote sensing image retrieval with global morphological texture descriptors.” IEEE transactions on geoscience and remote sensing 52.5 (2013): 3023-3034. DOI:10.1109/TGRS.2013.2268736.
- Al-Hamami, Alaa, and Hisham Al-Rashdan. ”Improving the Effec- tiveness of the Color Coherence ” Int. Arab J. Inf. Technol. 7.3 (2010): 324-332.
- Shao, Z., Zhou, , Zhang, L., & Hou, J. ”Improved color texture descriptors for remote sensing image retrieval.” Journal of applied remote sensing 8.1 (2014): 083584. DOI:10.1117/1.
- Huang, Xin, Xiaobo Liu, and Liangpei Zhang. ”A multichan- nel gray level co-occurrence matrix for multi/hyperspectral im- age texture representation.” remote sensing 6.9 (2014): 8424-8445. DOI:10.3390/rs6098424.
- Fadaei, Sadegh, Rassoul Amirfattahi, and Mohammad Reza Ah- madzadeh. ”Local derivative radial patterns: A new texture descriptor for content-based image retrieval.” Signal Processing 137 (2017): 274- 286.DOI: 1016/j.sigpro.2017.02.013.
- Tiwari, Ashwani Kumar, Vivek Kanhangad, and Ram Bilas Pa- ”Histogram refinement for texture descriptor based image re- trieval.” Signal Processing: Image Communication 53 (2017): 73-85. DOI:10.1016/j.image.2017.01.010.
- Jenitta, , and R. Samson Ravindran. ”Content Based Geographic Im- age Retrieval using Local Vector Pattern.” Brazilian Archives of Biology and Technology 61 (2018). DOI:10.1590/1678-4324-2016160717.
- Singh, Chandan, and Kanwal Preet ”A fast and efficient image retrieval system based on color and texture features.” Journal of Vi- sual Communication and Image Representation 41 (2016): 225-238. DOI:10.1016/j.jvcir.2016.10.002.
- Zhang, Jing, et ”Hyperspectral remote sensing image retrieval sys- tem using spectral and texture features.” Applied optics 56.16 (2017): 4785-4796. DOI:10.1364/AO.56.004785.
- Uslu, Erkan, and Songul Albayrak. ”Curvelet-based synthetic aper- ture radar image classification.” IEEE Geoscience and Remote Sensing Letters 11.6 (2013):1071-1075. DOI:10.1109/LGRS.2013.2286089.
- Cande`s, Emmanuel , and David L. Donoho. ”New tight frames of curvelets and optimal representations of objects with piecewise C2 singularities.” Communications on Pure and Applied Mathematics: A Journal Issued by the Courant Institute of Mathematical Sciences 57.2 (2004): 219-266. DOI:10.1002/cpa.10116.
- Semler, Lindsay, and Lucia Dettori. ”Curvelet-based texture classification of tissues in computed ” 2006 International Conference on Image Processing. IEEE, 2006. DOI:10.1109/ICIP.2006.312873.
- Geba¨ck, Tobias, and Petros K ”Edge detection in mi- croscopy images using curvelets.” BMC bioinformatics 10.1 (2009): 75. DOI:10.1186/1471-2105-10-75.
- Ma, Jianwei, and Gerlind Plonka. ”A review of curvelets and recent applications.” IEEE Signal Processing Magazine 27.2 (2010): 118-133.
- Go´mez, F., and Romero. ”Rotation invariant texture characterization using a curvelet based descriptor.” Pattern Recognition Letters 32.16 (2011): 2178-2186. DOI:10.1016/j.patrec.2011.09.029.
- Zhang, Yungang, Wei Gao, and Jun ”Integrating Color Vector Quantization and Curvelet Transform for Image Retrieval.” Interna- tional Journal of Design, Analysis and Tools for Integrated Circuits and Systems 2.2 (2011): 99.
- Laban, NourElDin, et ”System refinement for content based satel- lite image retrieval.” The Egyptian Journal of Remote Sensing and Space Science 15.1 (2012): 91-97. DOI:10.1016/j.ejrs.2012.05.001.
- Uslu, Erkan, and Songul Albayrak. ”Curvelet-based synthetic aper- ture radar image classification.” IEEE Geoscience and Remote Sensing Letters 11.6 (2013): 1071-1075. DOI:10.1109/LGRS.2013.2286089.
- Beguet, Benoit, et al. ”Automated retrieval of forest structure variables based on multi-scale texture analysis of VHR satellite ” ISPRS journal of photogrammetry and remote sensing 96 (2014): 164-178. DOI:10.1016/j.isprsjprs.2014.07.008.
- Lin, Wen-Chyi, et ”Curvelet-based classification of prostate can- cer histological images of critical gleason scores.” 2015 IEEE 12th International Symposium on Biomedical Imaging (ISBI). IEEE, 2015. DOI:10.1109/ISBI.2015.7164044.
- Lin, Wen-Chyi, et al. ”Curvelet-based texture classification of critical Gleason patterns of prostate histological images.” 2016 IEEE 6th Inter- national Conference on Computational Advances in Bio and Medical Sciences (ICCABS). IEEE, 2016. DOI:10.1109/ICCABS.2016.7802768.
- Sudheer Devulapalli, Rajakumar Krishnan, ”Synthesized pansharp- ening using curvelet transform and adaptive neuro-fuzzy infer- ence system,” J. Appl. Remote Sens. 13(3), 034519 (2019), doi: 1117/1.JRS.13.034519.
- Tsai, Du-Ming, and Wan-Ling Chen. ”Coffee plantation area recognition in satellite images using Fourier transform.” Com- puters and electronics in agriculture 135 (2017): 115-127. DOI:10.1016/j.compag.2016.12.020.
- Yang, Yi, and Shawn Newsam. ”Bag-of-visual-words and spatial exten- sions for land-use classification.” Proceedings of the 18th SIGSPATIAL international conference on advances in geographic information sys-ACM, 2010. DOI:10.1145/1869790.1869829.
- Luo, Jing, et ”Fingerprint classification combining curvelet trans- form and gray-level cooccurrence matrix.” Mathematical Problems in Engineering 2014 (2014). DOI:10.1155/2014/592928.
- Tipping, Michael E., and Christopher M. Bishop. ”Probabilistic princi- pal component ” Journal of the Royal Statistical Society: Series B (Statistical Methodology) 61.3 (1999): 611-622. DOI:10.1111/1467- 9868.00196.
- Ju, Fujiao, et al. ”Image outlier detection and feature extraction via L1-norm-based 2D probabilistic ” IEEE Transactions on Image Processing 24.12 (2015): 4834-4846. DOI:10.1109/TIP.2015.2469136.
- Ma, Jianwei, and Gerlind Plonka. ”The curvelet transform.” IEEE signal processing magazine 27.2 (2010): 118-133.DOI:10.1109/MSP.2009.935453.
- Donoho, David L., and Mark R. Duncan. ”Digital curvelet transform: strategy, implementation, and experiments.” Wavelet applicationsVol. 4056. International Society for Optics and Photonics, 2000. DOI:10.1117/12.381679.
- Roy, Kalyan, and Joydeep Mukherjee. ”Image similarity measure using color histogram, color coherence vector, and sobel method.” Interna- tional Journal of Science and Research (IJSR) 2.1 (2013): 538-543.
- Pass, Greg, Ramin Zabih, and Justin Miller. ”Comparing Images Using Color Coherence ” ACM multimedia. Vol. 96. 1996. DOI:10.1.1.29.9596.
- Lee, Jen-Chun. ”Copy-move image forgery detection based on Gabor magnitude.” Journal of Visual Communication and Image Representa- tion 31 (2015): 320-334.
- Struc, Vitomir, and Nikola Pavesic. ”From Gabor magnitude to gabor phase features: tackling the problem of face recognition under severe illumination changes.” Face Recognition. IntechOpen,De Maesschalck, Roy, Delphine Jouan-Rimbaud, and De´sire´ Massart. ”The mahalanobis distance.” Chemometrics and intelligent laboratory systems 50.1 (2000): 1-18. DOI:10.1016/S0169-7439(99)00047-7.
- Zier, Detlef, and Jens-Rainer Ohm. ”Common datasets and queries in MPEG-7 color core experiments.” ISO/IEC JTC1/SC29/WG11 MPEG99 M 5060 (1999).
- Cieplinski, Leszek. ”MPEG-7 color descriptors and their applications.” International Conference on Computer Analysis of Images and Pat- Springer, Berlin, Heidelberg, 2001. DOI:10.1007/3-540-44692-3 3.