Optimization of the Electrical Discharge Machining of Powdered Metallurgical High-Speed Steel Alloy using Genetic Algorithms
Volume 4, Issue 6, Page No 255-262, 2019
Author’s Name: Mohd Razif Idris1, Imad Mokhtar Mosrati2,a)
View Affiliations
1Malaysia Italy Design Institute (MIDI), Universiti Kuala Lumpur, 56100, Malaysia.
2Mechanical Engineering Department, Faculty of Engineering, Azzaytuna University, 21218, Libya.
a)Author to whom correspondence should be addressed. E-mail: imadmokhtar@yahoo.com
Adv. Sci. Technol. Eng. Syst. J. 4(6), 255-262 (2019); ![]() DOI: 10.25046/aj040632
DOI: 10.25046/aj040632
Keywords: EDM machine, Genetic algorithm optimization, Tool wear rate, Micro-crack size, Silver-Tungsten electrode

Export Citations
Through the Electrical Discharge Machining, the temperature is very high, which can lead to the material phase’s transformation and affects material properties, which can lead to failure of the products in the industry. This study aims to investigate the effect of a new input parameter (pulse cycle time Tc), with other parameters on the EDM responses, prediction models are developed. 3D Laser Microscope is used to measure the surface defects. And to assess the effect of using a silver-tungsten electrode on improving EDM performance during machining of powdered metallurgical high-speed steel which is a very important material in the industry, such as aerospace, automotive, and electrical power industries, it is used in structural components and heat exchangers. An integrated approach combines Response surface design and Genetic Algorithm optimization methodology for modeling and optimizing the process responses is utilized. Two software’s Minitab software and Matlab software were used for this purpose. The experimental results demonstrated comparative findings when the silver-tungsten electrode was used, and the optimization percentage was increased when the Genetic Algorithms method was used. Optimized values of the responses were as following: Micro-crack size was 0.965 µm, the optimization percentage is 20.64%. Tool Wear Rate was 0.0020 g/min, the optimization percentage is 13.04 %.
Received: 04 October 2019, Accepted: 10 November 2019, Published Online: 05 December 2019
1. Introduction
The product quality relies on the manufacturing process, optimization tools play a key role in enhancing product quality. Therefore the interest of this study to optimize the parameters and responses during the Electrical Discharge Machining EDM process of the material Powdered metallurgical high-speed steel. EDM is a nonconventional manufacturing process, utilized for very high hardness material, which can not be machined with traditional processes like turning or milling. It is a thermoelectrical process in which there is spark generation between the electrode and the workpiece. Response surface design methodology (Box Behnken) and genetic algorithm (GA) were integrated to optimize the input parameters and process responses. Genetic Algorithm (GA) Optimization Methodology is an artificial intelligence prediction tool, it has been getting interested to solve problems that are hardly solved by the use of conventional methods.
A review of the literature undertaken found that most researches likely used the same ideas for optimization of process responses, like Taguchi, and study the same input parameters. Here is a review of the literature on the EDM process optimization based on the publishing year of the researches.In [1], the researcher improved process performance such as metal removal rate, surface roughness and overcut based on Grey Taguchi technique for EDMing of Ti-6A-4V Titanium alloy. The process parameters selected in this study are current, T-on, voltage, T-off,
and duty factor. The optimized process parameters result in a lower wear ratio of the electrode, higher MRR, and better SR, the study shows an improved TWR of 15%, the MRR of 12% and SR of 19%. In [2], the authors established an analytical study for investigating the impact of input parameters on the MRR, SR, and RLT. The copper electrode is utilized, the other inputs are current and T-on. The best selection of input parameters and EDM machining conditions is performed. Study [3] used the Taguchi design methodology and Grey Relational Analysis tool to improve the outputs like MRR, TWR, and SR of mild steel IS 2026 during the EDM process. It is found the optimal pulse current at 26A, pulse on time at 55μs and pulses off time at 5μs.
The impact of operating parameters like voltage, pulse on-time, pulse of-time and current on outputs such as MRR and SR of AISI D2 workpiece EDM, a copper electrode is investigated [4], the experiment design was made using L9 OA and using response surface methodology to improve the outputs, it was discovered that the current is the most significant parameter influencing the MRR and the SR. Another study [5], authors researched the impact of wire EDM on aerospace material fracture toughness, Grade 5 titanium (Ti6AI4V), fracture toughness is widely used for damage tolerance analysis of aerospace components in which critical crack sizes are computed for given loading conditions to arrive at safe inspection and maintenance intervals. The compact tension was used to evaluate the fracture toughness. Obtained results indicate a slight decrease in fracture toughness compared to those reported in the literature.
In [6] the authors studied electrical discharge machining (EDM) of insulating ceramic materials, such as diamond, using the assisting electrode method. This study investigated the dependence of the machining properties on amounts of additives, three types of insulating Si3N4 ceramics were machined by sinking EDM and by wire EDM. The MRR and the SR were estimated for the EDMed material. Different dependencies on the amounts of added Al2O3 were observed, and the MRR depended on the size of the electrode. In [7], the researcher “introduced a micro-EDM electrothermal system to simulate the crater forming. This model integrates machining conditions such as heat flux, temperature-dependent thermal properties, and plasma radius, the heat transfer equation and its calculations of the produced crater are used to assess the fraction of energy distribution to the electrodes, results show a good agreement with experimental results”. The parameters that affect the performance output (MRR) of the workpiece, parameters were chosen for optimization are a T-on, T-off followed by the current to examine the impact of the process inputs on the MRR. For AISI D2 die steel, brass is the used electrode material [8].
In [9], authors implemented an approach to assess the MRR in the EDM process. In this study, a finite element model was used to simulate and investigate the process parameters and their impact on outputs such as MRR of die steel. The optimal process inputs combination at the machining of alumina using the electrochemical machining process is investigated [10], the main input parameters are electrolyte concentration, voltage and feed rate, machining performance are MRR and TWR, graphite was used as electrode material”.
In [11], authors presented a study to investigate the overcut and taper angles in the machining of stainless steel 304, parameters were current, T-on and T-off. The experimentation is performed using the RSM method, the current was found to be the most significant factor affecting the overcut and the taper angle followed by T-on and T-off, as the current and T-on increase, the overcut and taper angle is increased, so as T-off increases, the two responses decrease, the optimized parameters that give the minimum overcut and taper angle response are 9 A current, 30 µs Pulse on time and 35 µs Pulse off time which gives 0.010 mm overcut and 0.244° taper angle”. Grey relational analysis for Dry Electrical Discharge Machining is used in [12], to investigate and optimize the process parameters T-on, T-off, current, and voltage on the SR using the deionized water and air as a dielectric liquid for workpiece EN-8. ANOVA was performed to find the significant parameters on responses, found that current and T-on were the most significant input parameters.
It is clear from previous studies, manufacturers and researches relied on the use of non-traditional manufacturing methods like (EDM) instead of traditional methods like turning and milling when manufacturing the metals and alloys with high hardness such as the study task material, that could not be machined in traditional ways because the hardness of the workpiece is higher than the hardness and rigidity of the machine and cutting tool.
The main contribution of this study introducing an integrated approach combines both the Box-Behnken design and modeling method and the Genetic Algorithm as an optimization methodology that can be an effective design and optimization tool. And to investigate the influence of electrode materials (Silver-Tungsten) and pulse cycle time as a new input parameter on the EDM responses during machining of powdered metallurgical high-speed steel alloy.
2. Materials, Experimental Procedure and Data Setup
This part consists of the experimental setup, selection of workpiece, equipment and tool materials, design and optimization experimental methodologies.
- Machine
All experiments were carried out on the EDM machine model (CHARMILLES Roboform 40). The machine is complete with programming. It features a PC-based CNC control with an LCD screen for faster data processing and servo control. Figure 1 shows the used EDM machine.
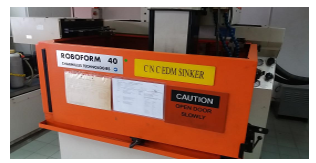 Figure 1: EDM machine
- Workpiece Material
The task material in this study is Powdered Metallurgical High-Speed Steel Alloy, the nearest equivalent material is (AISI M3-2). It is a very important material in the industry; it has not been investigated in the previous literature. Table 1 displays chemical compositions of the material [16], figure 3 shows a sample of material applications.
The chemical compositions as following:
Table 1: Chemical composition of the workpiece material
| C | Cr | Mo | W | V |
| 1.30 | 4.00 | 5.00 | 6.50 | 3.00 |
Material Properties: Hardness (187.6 HV), Density (0.008166 g/mm3). The shape of the workpiece is a plate, its width 40 mm, length of 60 mm and depth 10mm, required to machine a hole with 20mm diameter, and with 2mm depth. Figure 2 shows the shape and dimensions of the workpiece.
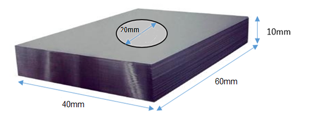 Figure 2: Dimensions of workpiece Material
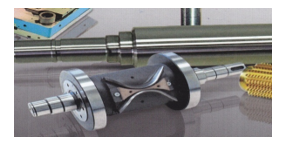 Figure 3: Sample of the workpiece material
- Electrodes
The electrode material used is silver-tungsten, had 100 mm long, diameter 20.70mm. Silver tungsten is strong, capable of penetrating the toughest materials, and machinable. Silver has great conductivity at high temperatures and pressures. Figure 4 shows the electrode shape. Table 2 shows the Physical and Mechanical Properties of Silver – Tungsten electrode [17].
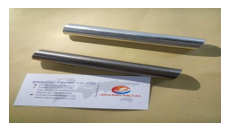 Figure 4: Shape of the electrodes
Table 2: Physical and mechanical properties of silver-tungsten electrode material
| Nominal Composition (% Weight) |
Density (g/cm3) |
Electrical Resistivity (20°C, µΩ•cm) ≤ |
Electrical Conductivity (IACS%, ≥) |
Hardness (HB, ≥) Kgf/mm2 |
Bending Strength ( MPa ) |
| 25 Silver 75Tungsten |
15.40 | 4.2 | 41 | 165 | 686 |
- The 3D Laser Microscope Instrument
The 3D Laser Scanning Microscope was utilized for measuring Micro-Cracks size and taking the topography images. The magnification used in this inspection was 1000X. Figure 5 shows the 3D Measuring Laser Microscope. Due to huge temperature in the EDM process, and rapid heating and quenching, surface defects are created on the workpiece such as cracks, recast layer, surface roughness, and craters, in this study Micro- Cracks Size will be investigated. 3D Laser Microscope was used to measure the surface response in units of a micrometer, with a magnification of 1000.
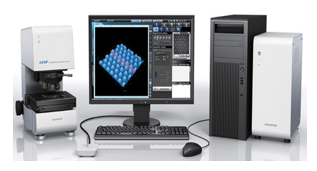 Figure 5: The 3D Laser Microscope device
- EDM Process Responses and surface responses
Industries like automotive and aerospace have used the EDM process to produce products. “The aerospace industry used the EDM process to manufacture some aircraft parts because of the intricate shapes, tough alloys, and very tight tolerances involved, but it also recognized the dangers of the damaged surfaces and product defects resulting from the process” [13]. The process responses will be investigated and optimize in this research were: Tool Wear Rate and Micro-Crack Size.
Tool Wear Rate (TWR):
The wear rate of the electrode was determined using the formula:
TWR (g /min) = ?? − ?? (g) (1)
MT (min)
Where (??) and (??) are the weights of electrode material before and after machining, respectively, and MT is the machining time.
- Experimental Setup
In this study Box-Behnken Experimental design Methodology was used to design the EDM process for Powdered Metallurgical High-Speed Steel Alloy, L30 Orthogonal Array (OA) is designed, with (3) center points. Machining parameters are three continuous factors: Pulses cycle time (Tc), also it is called (U) as shown in Figure 6 [14]. Dielectric Fluid Flushing Pressure (P), and Voltage (V), one category factor: (the type of electrode material). Table 3 displays the input parameters and their values.
Fixed parameters: current 6A, Pulse width 200 µs, the polarity of the electrode is positive. Dielectric hydrocarbon fluid with a density of 0,783 g / ml and a flashpoint of 125 ºC is used. Flushing method: the dielectric fluid was injected through side pipe novels providing adequate flushing to remove the eroded particles away from the working gap.
Table 3: Machining parameters and their levels
| Parameters | Symbol | Levels | Unit | ||
| 1 | 2 | 3 | |||
| Period of machining (Pulses cycle time) | Tc | 0.1 | 6.4 | 12.8 | Sec |
| Dielectric fluid Flushing pressure | P | 5 | 15 | 25 | Psi |
| Machining voltage | V | 120 | 160 | 200 | V |
| Electrode material | Ag-W
Silver-Tungsten |
||||
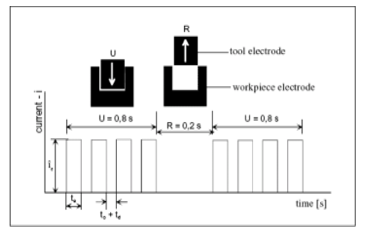 Figure 6: Series of pulses cycle time Tc, (U)
- Genetic Algorithms Optimization Tool (GA)
“Genetic Algorithms, GA contains a chromosome, set of population, fitness function, mutation and selection, it begins with a set of solutions represented by chromosomes, called population, solutions from one population are taken and used to form a new population, which is motivated by the possibility that the new population will be better than the old one, further, solutions are selected according to their fitness to form new solutions, this process is repeated until some condition is satisfied. Algorithmically, the basic of GA is contains the following actions, start, fitness, new population, replace, test, and loop ” [15].
Figure 7 shows the flowchart of the Genetic Algorithm optimization methodology.
In this research the models developed by (Box – Behnken) design methodology will be used as an objective function, the upper and lower bounds of parameters are identified in the GA optimization technique as below. The aim was to minimize the Response value.
Minimize f(x) = Response
Responses to be as minimum as better
Subjected to,
120≤ V ≤200;
0.1≤ Tc ≤12.8;
5≤P≤25.
GA Toolbox of MATLAB software is used. All the previous steps of the Genetic Algorithm will be done using Matlab software, after achieving and building the models of all the responses from the (Box – Behnken) optimization methodology to be used as objective function equations, all results obtained from the runs are presented in the following chapters.
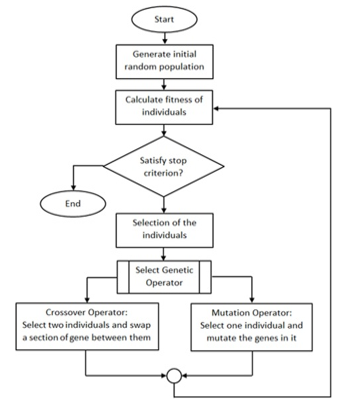 Figure 7: Flowchart diagram of Genetic Algorithm optimization methodology
- Results and Analysis
In this section, the results obtained from the running of Minitab design software and Matlab GA optimization software are discussed for each response variable, tool wear, micro crack size. Then a regression analysis was conducted to find the best-fit models. The main effects and interaction effects were discussed. Table 4 shows the Experimental results.
Table 4: Experimental Results
| Run Order | V
Volt |
Tc Sec | P | TWR
g/min |
Micro-crack size µm |
| 1 | 160 | 0.10 | 5 | 0.0059 | 1.344 |
| 2 | 120 | 6.45 | 25 | 0.0071 | 2.363 |
| 3 | 120 | 6.45 | 5 | 0.0088 | 1.688 |
| 4 | 160 | 6.45 | 15 | 0.0091 | 1.905 |
| 5 | 160 | 12.8 | 25 | 0.0142 | 2.026 |
| 6 | 160 | 12.8 | 5 | 0.0087 | 1.608 |
| 7 | 160 | 6.45 | 15 | 0.0090 | 1.817 |
| 8 | 160 | 0.10 | 25 | 0.0023 | 1.350 |
| 9 | 120 | 12.8 | 15 | 0.0093 | 1.721 |
| 10 | 200 | 6.45 | 5 | 0.0083 | 2.001 |
| 11 | 200 | 12.8 | 15 | 0.0175 | 2.157 |
| 12 | 120 | 0.10 | 15 | 0.0033 | 1.905 |
| 13 | 200 | 0.10 | 15 | 0.0047 | 1.216 |
| 14 | 160 | 6.45 | 15 | 0.0085 | 1.616 |
| 15 | 200 | 6.45 | 25 | 0.0122 | 1.794 |
The Minitab17 software package was used to estimate the models of the data obtained from the experiments. Figures 8-23 Show the 2D plots, to analyze the main effect and the mutual interactions between the input machining parameters (V, Tc, P, and electrode material) on the responses. The ANOVA analysis is shown in tables 5 – 6. In this analysis, all parameters with a p-value of less than 0.05 are significant.
Table 5: Analysis of Variance of TWR
| Source | DF | Adj SS | Adj MS | F-Value | P-Value |
| Model | 6 | 0.000208 | 0.000035 | 29.40 | 0.000 |
| Linear | 3 | 0.000168 | 0.000056 | 47.44 | 0.000 |
| V | 1 | 0.000025 | 0.000025 | 21.41 | 0.002 |
| Tc | 1 | 0.000140 | 0.000140 | 119.14 | 0.000 |
| P | 1 | 0.000002 | 0.000002 | 1.78 | 0.218 |
| 2-Way Interaction | 3 | 0.000040 | 0.000013 | 11.35 | 0.003 |
| V*Tc | 1 | 0.000012 | 0.000012 | 9.82 | 0.014 |
| V*P | 1 | 0.000008 | 0.000008 | 6.66 | 0.033 |
| Tc*P | 1 | 0.000021 | 0.000021 | 17.58 | 0.003 |
| Error | 8 | 0.000009 | 0.000001 | ||
| Lack-of-Fit | 6 | 0.000009 | 0.000002 | 14.86 | 0.064 |
| Pure Error | 2 | 0.000000 | 0.000000 | ||
| Total | 14 | 0.000217 | |||
| S R-sq R-sq(adj) R-sq(pred)
0.0010851 95.66% 92.41% 77.72% |
|||||
- Effect of Process Parameters on Tool Wear Rate TWR
Statistical inferences:
- The model is significant, as seen p-value is 0.000, that is meant the model is significant and adequate.
- Lack of Fit is 0.064, it is not significant.
- The “R-Squared” of 95.66%, “Pred R-Squared” of 77.72 %, the “Adj R-Squared” of 92.41%, indicates an adequate signal.
- Values of “Prob. less than 0.05” indicate model terms are significant. In this case, V, Tc, (Tc*P), (V*P), and (V*Tc) are significant model terms.
Equation model of TWR:
TWR = 0.01524 – 0.000051 V – 0.000949 Tc – 0.000740 P + 0.000007 V*Tc + 0.000004 V*P + 0.000036 Tc*P
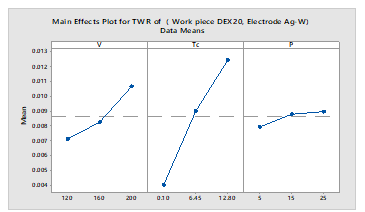 Figure 8: Main effects plot for TWR
The main effects: Figure 8 displays the main effects plot for TWR. As the voltage increased as TWR increased. Increasing pulse cycle time resulted in increasing of TWR, the minimum value in TWR was at 0.10s. Dielectric liquid pressure is increased as TWR stays almost no change, no significant effect.
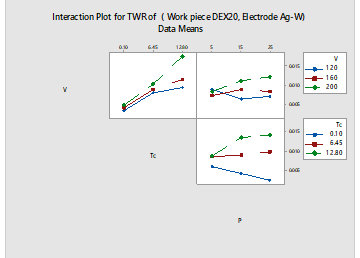 Figure 9: Interaction effects plot for TWR
The interaction effect: Figure 9 displays the interaction effects plots for TWR. Based on the ANOVA table, the p-value of all interactions (Tc*P), (V*P), (V*Tc) was less than 0.05. Therefore, the interaction effects were significant.
- Effect of process parameters on Micro-crack Size
Statistical inferences:
- P-value of the model is 0.004, so it is significant and adequate.
- The “R-Squared” of 90.22%, “Pred R-Squared” of 87.74 %, the “Adj R-Squared” of 96.51%. This model can be used to navigate the design space and indicates an adequate signal.
- Tc, P, (V*V), (Tc*Tc), (V*Tc), and (V*P) are significant terms.
Regression Equation of Micro-C racks:
M-Crack Size = 4.232 – 0.0355 V – 0.1027 Tc + 0.0867 P + 0.000109 V*V- 0.00507 Tc*Tc+ 0.000072 P*P + 0.001107 V*Tc – 0.000551 V*P + 0.001622 Tc*P
Table 6: Analysis of variance for Micro-crack size
| Source | DF | Adj SS | Adj MS | F-Value | P-Value |
| Model | 9 | 1.33501 | 0.148334 | 15.35 | 0.004 |
| Linear | 3 | 0.49182 | 0.163940 | 16.96 | 0.005 |
| V | 1 | 0.03239 | 0.032385 | 3.35 | 0.127 |
| Tc | 1 | 0.35998 | 0.359976 | 37.25 | 0.002 |
| P | 1 | 0.09946 | 0.099458 | 10.29 | 0.024 |
| Square | 3 | 0.28987 | 0.096622 | 10.00 | 0.015 |
| V*V | 1 | 0.11302 | 0.113023 | 11.70 | 0.019 |
| Tc*Tc | 1 | 0.15448 | 0.154476 | 15.99 | 0.010 |
| P*P | 1 | 0.00019 | 0.000192 | 0.02 | 0.893 |
| 2-Way Interaction | 3 | 0.55332 | 0.184441 | 19.09 | 0.004 |
| V*Tc | 1 | 0.31641 | 0.316406 | 32.74 | 0.002 |
| V*P | 1 | 0.19448 | 0.194481 | 20.13 | 0.006 |
| Tc*P | 1 | 0.04244 | 0.042436 | 4.39 | 0.090 |
| Error | 5 | 0.04832 | 0.009664 | ||
| Lack-of-Fit | 3 | 0.00443 | 0.001476 | 0.07 | 0.972 |
| Pure Error | 2 | 0.04389 | 0.021944 | ||
| Total | 14 | 1.38333 | |||
| S R-sq R-sq(adj) R-sq(pred)
0.0983035 96.51% 90.22% 87.74% |
|||||
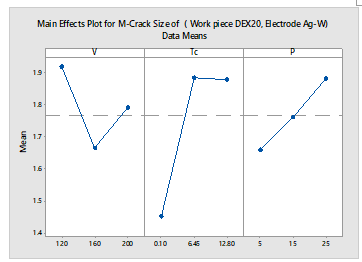 Figure 10: Main effects plot for Micro-Crack Size
The main effects: based on the plot in figure 10, the Micro-crack size decreased when the voltage increased until 160v then it increases. And at the pulse cycle time increasing resulted in increasing of Micro-crack size until 6.45s then it decreases slightly. Dielectric liquid pressure increased as the Micro-crack size increased. The minimum value was at P 5psi, Tc 12.8s, and V 160v.
The significant interaction effect was only between voltage and pulse cycle time (V*Tc), and between voltage and liquid pressure (V*P), from the analysis table, the p-value of this interaction effect was less than 0.05 Therefore, this interaction effect was significant.
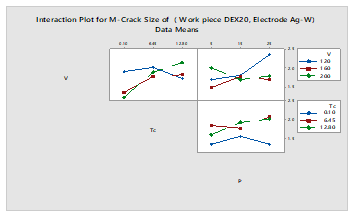 Figure 11: Interaction effects plot for Micro-Crack Size,
- Topography Images using 3D Laser Microscope
The following image depicted how surface responses changed by the process parameters and electrode types. Figure 12 shows the best results for the surface defects got from performing experiments. The micrograph of EDMed surfaces with the high magnification (1000×), for the machining parameter combination V/Tc/P of 200v/0.1s/15psi is shown in figure 12. Theses machining combinations produced minimum Micro-crack width 1.216µm.
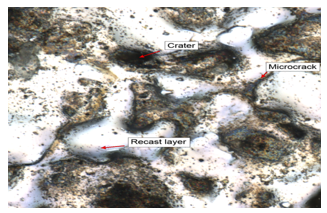 Figure 12: Minimum Micro-crack size 1.216µm, at V =200v, Tc=0.1Sec,
P= 15psi
4. Responses Optimization using Genetic Algorithm methodology
The equations developed from the Response surface design in the last section will be used as objective functions in the Genetic Algorithm optimization, the target of these responses will be minimized.
Subjected to,
120 ≤ V ≤ 200;
0.1 ≤ Tc ≤ 12.8;
5 ≤ P ≤ 25;
Tool Material = Ag-W.
The equation variables and the input parameters are changed to the coding system that accepted in the Genetic Algorithm Tool.
Response = f (x)
V= X1, Tc=X2, P=X3, Responses=f(x), Maximum and minimum boundary conditions are [120, 0.1, 5] and [200, 12.8, 25]. Tables 7-8 and Figures 13-14 show the optimization results.
- Optimization of Tool Wear Rate TWR using Genetic Algotithm
Response surface equation:
TWR = 0.01524 – 0.000051 V – 0.000949 Tc – 0.000740 P + 0.000007 V*Tc + 0.000004 V*P + 0.000036 Tc*P
Coding equation (minimization):
f(x) = 0.01524 – 0.000051*x(1) – 0.000949*x(2) – 0.000740*x(3) + 0.000007*(x(1)*x(2))+ 0.000004*(x(1)*x(3)) + 0.000036*(x(2)*x(3));
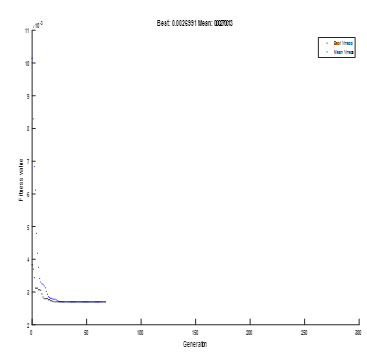 Figure 13: Plots of fitness value with the number of generations of TWR
Table 7: The optimum values of process parameters and optimized value of Tool Wear Rate
| Response | Optimize the value of input parameters | Value
g/mm |
Iteration
Number |
||
| V | Tc | P | Objective function value: 0.002699 | 67 | |
| TWR | 120 | 0.1 | 25 | ||
- Optimization of Micro-Crack Size using Genetic Algotithm
Response surface equation:
M-Crack Size = 4.232 – 0.0355 V – 0.1027 Tc + 0.0867 P + 0.000109 V*V- 0.00507 Tc*Tc+ 0.000072 P*P + 0.001107 V*Tc – 0.000551 V*P + 0.001622 Tc*P
Coding equation (minimization):
f(x) = 4.232 – 0.0355*x(1) – 0.1027*x(2) + 0.0867*x(3) + 0.000109*(x(1)^2) -0.00507*(x(2)^2)+ 0.000072*(x(3)^2) + 0.001107*(x(1)*x(2)) – 0.000551*(x(1)*x(3)) + 0.001622* (x(2)*x(3));
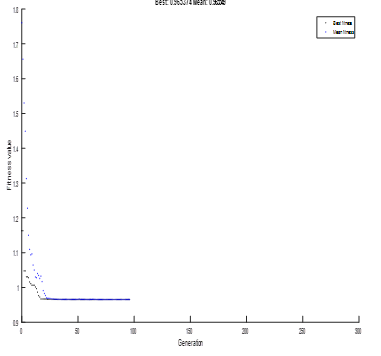 Figure 14: Plots of fitness value with the number of generations of Micro-Crack Size
Table 8: The optimum values of process parameters and the optimized value of Micro-Crack
| Response | Optimize the value of input parameters | Value
µm |
Iteration
Number |
||
| V | Tc | P | Objective function value: 0.965 | 96 | |
| M-Crack Width | 200 | 0.1 | 25 | ||
5. Conclusion
This research demonstrated very good results of the modeling and optimization of TWR, and Micro Crack size for the material Powdered Metallurgical High-Speed Steel Alloy during the EDM process using Box Behnken Design Method with Genetic Algorithm optimization methodology to increase the optimization percentage. The results of using Silver – Tungsten electrode were very good and showed that it has an important impact on the output values, this leads to thinking about not relying on the use of copper electrode only as is clear from the previous studies. This research contributed to highlighting the importance of using genetic algorithms as a method to improve the outputs of the EDM process. Also contributed to study and investigate a new input parameter called Pulses Cycles Time Tc, that it has not been studied previously, results demonstrated it has an effective effect on improving the outputs of the manufacturing process
The summary of optimal results of TWR and Micro Crack Size for EDMing of the material Powdered Metallurgical High-Speed Steel Alloy using Silver-Tungsten electrode to be as follows:
- For Tool Wear Rate TWR: Tc and V are significant parameters. P is not significant. The model is significant, where is R2, 95.66% and Lack of Fit 0.064. Minimum Value of TWR as predicted from experiments was 0.0023 g/min. Optimized value using Genetic Algorithm is 0.0020 g/min, if the applied machining conditions are: V=120v, Tc=0.1s, P= 25psi, optimization percentage using GA is 13.04 %.
- For Micro-crack size: Tc is the most significant parameter by then P. V is not significant, the model is significant where R2 51% and Lack of Fit 0.972. The minimum Value of Micro-crack size as predicted from experiments was 1.216 µm. Optimized value using Genetic Algorithms was 0.965 µm when the applied machining conditions are: V=200v, Tc=0.1s, P= 25psi, optimization percentage using GA is 20.64%.
These findings will enable EDM researchers and manufacturing engineers to select the correct parameters for Powdered Metallurgical High-Speed Steel material EDMing.
The models and the data in this work are expected to become a powerful tool in the hands of EDM researchers to extend the system understanding, and also to improve the process performance.
Conflicts of Interest
The authors declare no conflict of interest.
- J. Y. Kao, C. C. Tsao, S. S. Wang, and C. Y. Hsu. Optimization of the EDM parameters on machining Ti-6Al-4V with multiple quality characteristics. Int. J. Adv. Manuf. Technol, 2010.
- M. Gostimirovic, P. Kovac, M. Sekulic, and B. Skoric. Influence of discharge energy on machining characteristics in EDM. J. Mech. Sci. Technol, 2012.
- S. Raghuraman, K. Thiruppathi, T. Panneerselvam, and S. Santosh. Optimization of Edm Parameters Using Taguchi Method and Grey Relational Analysis for Mild Steel Is 2026. Int. J. Innov. Res. Sci. Eng. Technol, 2(7): 3095–3104, 2013.
- S. B. Chikalthankar, V. M. Nandedkar, and S. V Borde. Experimental Investigations of EDM Parameters, 7(5): 31–34, 2013.
- D. M. Madyira and E. T. Akinlabi. Effects of Wire Electrical Discharge Machining on Fracture Toughness of Grade 5 Titanium Alloy. Int. J. Mech. Prod. Engineering, 2: 1–5, 2014.
- D. Hanaoka, Y. Fukuzawa, Y. Kaneko, and T. Harada. Discharge Machining of Insulating Si3N4 Ceramics with added Al2O3. Int. J. Electr. Mach. 19: 45–50, 2014.
- B. Shao and K. P. Rajurkar. Modeling of the crater formation in micro-EDM. In Procedia CIRP, 2015.
- J. Jeykrishnan, B. Vijaya Ramnath, A. Jude Felix, C. Rupan Pernesh, and S. Kalaiyarasan. Parameter optimization of electro-discharge machining (EDM) in AISI d2 die steel using Taguchi technique. Indian J. Sci. Technol, 9(4), 2016.
- A. Gosavi and A. B. Gaikwad. Predicting Optimized EDM Machining Parameter through Thermo Mechanical Analysis. IOSR J. Mech. Civ. Eng., 13(3): 2320–334, 2016.
- M. Goud, A. K. Sharma, and S. Zafar. A Taguchi approach to optimize electrochemical discharge machining of alumina, 2016.
- E. A. H. Hanash. Investigation of the Effect of Edm Parameters on Dimensional Accuracy of Drilled Holes of 304 Stainless Steel Using Rsm Method By International Islamic University. Int. Islam. Univ. MALAYSIA, 2017.
- N. Singh Khundrakpam, G. Singh Brar, and D. Deepak. Grey-Taguchi Optimization of Near Dry EDM Process Parameters on the Surface Roughness. In Materials Today: Proceedings, 5(2): 4445–4451, 2018.
- Aerospace Manufacturing, EDM for Aerospace, Aerospace Production, Radical Departures. Retrieved from https://www.radical-departures.net/articles/advances-in-edm-for-aerospace, 2019.
- I. A. Amorim, F.L.; Schäfer, G.; Stedile, L.J.; Bassani. On the Behavior of Parameters and Copper -Tungsten Electrode Edge Radius Wear When Finishing Sinking EDM of Tool, 35, 2010.
- M. N. Ab Wahab, S. Nefti-Meziani, and A. Atyabi. A comprehensive review of swarm optimization algorithms. PLoS One, 10(5): 1–36, 2015.
- Special steel and Alliance. Retrieved from http://www.specialsteel.com.my/page.php?page=powder, (2019)
- Stanford Materials Corporation. Retrieved from
http://www.stanfordmaterials.com/Tungsten-copper.html, (2019)
Citations by Dimensions
Citations by PlumX
Google Scholar
Scopus
Crossref Citations
- Abdullatif Mehemed Gohman, Imad Mokhtar Mosrati, Abdurahim A. Sakeb, Wannes Abraheem Shabeesh, "Optimization of The Surface Roughness During The Electrical Discharge Machining of Tool Steel Alloy DIN 1.2080." مجلة الجامعة الأسمرية, vol. 6, no. 5, pp. 409, 2023.
No. of Downloads Per Month
No. of Downloads Per Country