
Data Dashboard for Decision Support Systems for Intrapreneurship in A Company
Volume 4, Issue 6, Page No 177-182, 2019
Author’s Name: Evaristus Didik Madyatmadjaa), Evaristus Didik Madyatmadja, Alvi Sasqia Putri, Siti Sabilul Hiqna, Wigna Pratita
View Affiliations
Information Systems Department, School of Information Systems, Bina Nusantara University, 11480, Indonesia
a)Author to whom correspondence should be addressed. E-mail: emadyatmadja@binus.edu
Adv. Sci. Technol. Eng. Syst. J. 4(6), 177-182 (2019); ![]() DOI: 10.25046/aj040622
DOI: 10.25046/aj040622
Keywords: Intrapreneurship, Innovation Management, Data Visualization, Dashboard

Export Citations
Nowadays, as the Information and Technology rapidly growing all across the world, Indonesia as one of many developed countries always tries to keep up relating to this trend. Regarding to this situation, the use of Information and Technology in various fields are greatly enhanced, and not to mention businesses. There are a lot of businesses using technology, building a start-up is one of the common ways to combine technology with innovation. Intrapreneurship is a media to develop new venture within an organization and to exploit new opportunities. To help the continuity of entrepreneurship, there must be an Innovation Management that serves help to develop ideas from the internal employees and always find the best solution to help the intrapreneurs grows in the best environment. To make a better decision making, management need some tools to monitor and evaluate the Intrapreneurs. Data Dashboard aims to help the decision maker to see the Intrapreneurs’ performance and at once feel their pain and gain. With those insights that can be obtained from the dashboard, hopefully, management can get enough information to make the best decision regarding the continuity status of each Intrapreneurs. This research will provide the dashboard with some algorithm to show the recommendation data about the status of Intrapreneurs.
Received: 03 October 2019, Accepted: 14 November 2019, Published Online: 25 November 2019
1. Introduction
Entrepreneurship by contrast is the act of developing a new venture outside an existing organization [1]. Intrapreneurship can be very advantageous for a company because intrapreneurs explore the concealed opportunity, use the creativity and innovate a new idea that leads to company’s better performance. In order for intrapreneurs to run and managed well, there must be an Innovation Management manages intrapreneur’s environment with the aim of making it grand and supportive of their outgrowth that intrapreneur has the best opportunity to grow fast and unleash their maximum potential, compared to other growth environment. Because of the large number of intrapreneurs that needs to be taken care of, Innovation Management has many sources of data coming from each intrapreneur, the data is mainly the representative of their performances throughout monitoring and evaluation process.
Intrapreneur is very valuable in corporate let alone, in State-Owned Enterprises in Indonesia. It’s not just making a small community to make money, but also to raise awareness about the importance of innovation and how innovation builds the culture. The impact from having intrapreneur in corporate, already proven in one of the State-Owned Enterprise in Indonesia that runs in telecommunication sector, that building innovation lab helps the corporate to find the right culture that can be implemented in the whole corporation and gain more money because they treat the intrapreneur in a right way.
Based on study in Industrial Management & Data System by Emerald about Information technology -enabled intrapreneurship culture and firm performance, they said that the results indicate that intrapreneurship culture is a valuable capability that leads to firm performance and that two types of IT resources (technological IT and managerial IT resources) lead to the development of an intrapreneurship culture. Moreover, the results indicate that the investment in both technological IT resources and managerial IT resources influences competitive performance positively by means of intrapreneurship culture. The study also shows that IT-enabled intrapreneurship culture leads to significantly better firm performance. The findings are consistent with the perspective of IT-enabled organizational capabilities that perceives IT resources as impacting positively on firm performance by means of other higher-order process capabilities [2]
They found that the development of an intrapreneurship culture leads to higher sales growth, market share growth and product and market development. It is possible that the current economic crisis, with some exacerbating factors in the Spanish entrepreneurial context, is changing the managerial perception of the business value of the innovation culture in commercial terms. Finally, this study responds to the call for empirical research on innovation-supportive culture, of which there has been little to date [2]
Another study that stated the effect of intrapreneurship on corporate performance is from Management Decision by Emerald. The study shows that intrapreneurship influences the performance of firms, contributing to a deeper understanding of the importance of intrapreneurship in the context of entrepreneurship and the resource-based view theories. The multidimensional structure of intrapreneurship is confirmed and it is influenced by the important role of proactivity and innovative action, associated with the challenge to the intrapreneurs in their propensity for risk. Within the framework of intrapreneurship, the autonomy granted to the entrepreneurs, their competitive energy and the risk of uncertainty associated with their initiative and capacity for innovation have a lower importance.This work highlights the importance of the factor growth and improvement, of a qualitative nature, to reflect the multidimensional effect of intrapreneurship. The proactivity and innovation action of entrepreneurs project the effects in the long term aiming to ensure the development of companies. [3]
Data is a material that needs to be processed in order to get complete and clear information. Data is a fact that strengthens the truth about the information. In computational systems data are the coded invariances. In human discourse data is that which is stated, for instance, by informants in an empirical study [4]. The data itself won’t provide much benefit if there’s no further action to make those data worth, one of the basic things that can be done as the starting point is setting the goal, which determine what and how the data will be processed for the management. The function of the management beside helping intrapreneur to have a supportive environment is to make an appropriate decision that can make a great impact, not just for the intrapreneur itself but also for The Company. In order to do so, management need some tools to help them to gain insights which supports on decision making.
As the information and technology has enhanced, decisions support tools have become more sophisticated. “Data management for decision support has moved through three generations, with the latest being real-time data warehousing” [5]. Today decision support system is used in various fields for a variety of purposes including real-time performance monitoring and strategic business intelligence queries. This system in its development, eventually can make the management to see the bigger picture. Managers can use the system that include historical data of Amoeba’s performance to support many decision tasks. When the tasks are performed regularly then a computerized decision support system can potentially increase access to the data and help managers gain insights regarding the continuity of Amoeba’s status in this program.
Decision support system in general have the concept of processing the data. One of many common methods to process the data is data mining. Data mining can be implemented to the data so the data can provide results based on the intentioned purpose. Data Mining is discipline that emerged at the meeting of several other disciplines, mainly driven by huge growth of databases. What triggers data mining is the essential information that lays under the piles of inessential data which makes it hidden. Data mining is the way to extract the essential data so it can be processed and provides essential information [6]. There are some kind of data mining techniques, which are classification, clustering, association rules, regression, etc[7].
Decision support system can be visualized in various kinds of presentation, one of the visualization tools that are commonly used is dashboard. The content of dashboard can help the management read the data in the best possible way. Data visualization is the representation of data in a systematic form that can be the ‘front end’ of big data [8]. The results can be useful depending on the quality and the quantity of data itself. Dashboard is one of the ways to visualize the data.
Organization Dashboard as a relatively small collection of interconnected key performance metrics and underlying performance drivers that reflects both short- and long-term interests to be viewed in common throughout the organization [9]. Dashboard typically have 3 types of purposes: a) Strategic purposes, b) Analytical purposes, c) Operational purposes.
With having a large amount of data by combining the data mining and data visualization, hopefully it can dig underneath valuable information and present it in the simplest way. The decision maker can also use the visualization to see the progress of intrapreneurs and the result from data mining processes can be used to gain more insight to help make better decisions regarding the intrapreneur’s growth. All of these purposes are become our motivation to make one dashboard to display all of the information needed so it can be more effective and efficient.
2. Definition of Intrapreneurs Dashboard
Dashboard is a representative of data which contain the visualization of many data combined resulting the summarization of interconnected key performance metrics to communicate some performances and achievements throughout the company. Dashboard are related to decision support system in a way that they can provide such an insight that can be viewed as a combination of individual decision support system [9].
There are three types of dashboard regarding to the purpose, they are: strategic purposes, analytical purposes, and operational purposes. Strategic purposes dashboard is common to be used in executive levels to monitor the long-term company strategy. It tracks the performance metrics while lining up with the company’s goals. The data behind strategic purposes dashboard is updated periodically and less frequent than operational purposes dashboard. Analytical purposes dashboard is a dashboard that contains an up to date massive amount of data to be analyzed to provide support for executives. What we can do from analytical dashboard is to make an analysis like make a prediction or discover insights. The analysis is based on the historical data. Operational dashboard is a monitoring dashboard that has a timely updated data so that progress can be tracked on time. It is commonly used to monitor and manage operations [10].
The purposes of using dashboard as a tool to visualize the data are:
- Dashboard can enforce consistency in measures and measurement procedures across departments and business units.
- Dashboard can help management to monitor and evaluate performance in order to make better product development.
- Dashboard can be used as a plan to make basic strategies and determine the goal for the future given.
- Dashboard also may be used to share and communicate with stakeholders about particular data that can make the stakeholders understand easily and make a quick decision regarding the data given in the dashboard [9].
Intrapreneur dashboard is an analytical dashboard that contains the visualization about the talent’s data and intrapreneur’s performance to help the management monitor and evaluate intrapreneur’s progress in order to make the best decision regarding the continuity status of intrapreneur.
3. Development of Intrapreneur Dashboard
As shown in Figure 1, those ar the steps to develop a Business Intelligence Systems:
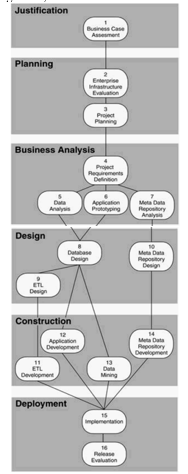 Figure 1: Business Intelligence Roadmap Lifecycle Diagram
- Business Case Assessment
Business case assessment is the step of exploring the idea from the business side. It defines the obvious business reason to develop the project. It also assesses the current system and compare it to the competitor’s BI Application. After finding the problem, the BI solution can be proposed and be considered by doing some analysis like cost benefit analysis or do a risk assessment. Then the assessment report can be produced.
- Enterprise Infrastructure Evaluation
Enterprise infrastructure evaluation is an activity of assessing the current platform, selecting the new product, write the report, and until installing and testing it.
- Project Planning
Project planning is detailing the plan to develop the BI Application. We can do it by revising the cost estimates, risk assessment, determining the condition of source files, identifying critical success factor, preparing the high-level plan until start kicking off the project.
- Project Requirement Definition
This step is generally defining requirement for many aspects like technical infrastructure enhancements, non-technical infrastructure enhancements, reporting, requirements for source data, review the project scope, expand the logical data model, define the preliminary service level agreement, and write the application requirements documents.
- Data Analysis
In this step we do a more thorough analysis of data by analyzing the external data sources, refine the logical data model, analyze the source data quality, expand the logical enterprise data model, resolve data discrepancies, and write the data cleansing specification for the further step.
- Application Prototyping
Application prototyping means planning a prototype starting from the requirement analysis, defining scope, develop it, and demonstrate the prototype.
- Metadata Repository Analysis
This step is the first step in developing the metadata repository before designing and developing metadata repository. Here, things like analyzing requirements for metadata, analyzing the interface requirements for metadata repository, analyzing the access, create the logical meta model, and create the meta-data data is conducted.
- Database Design
It starts from reviewing the data access requirements to know what are the things that the database needs. Then it continues to determining the aggregation and summarization requirements because data aggregation and summarization needs to be finalized first before committing to the final schema. The next steps are designing the BI target databases, designing the physical database structure, build the BI target databases, developing database maintenance structure, preparing to monitor and tune the database designs, preparing to monitor and tune the query designs.
- ETL Design
This step is designing for ETL Process. The steps are: create the source-to-target mapping document, test the ETL tools functions, design the ETL process flow, design the ETL programs, and set up the ETL staging area.
- Metadata Repository Design
After doing the analysis for developing a metadata repository, then process of designing is starting from design the metadata repository. It continues to install and test the metadata repository product, design the meta data migration process, and design the metadata application.
- ETL Development
After the concept has been conceptualized the ETL development can be started. First build and unit test the ETL process. Then the integration or regression to test the ETL process, do performance test for ETL process, do quality assurance test, and acceptance test of the ETL process.
- Application Development
In application development step, the application is being designed, build, until tested. Lastly, providing data access and analysis training.
- Data Mining
Data mining is the process of finding useful information from a large size of data. To do data mining, the first thing to do is stating the business problem. Then collect the data, consolidate and cleanse the data, prepare the data, Build the analytical data model, interpret the data mining result, perform external validation of data mining results, and monitor the analytical data model overtime.
- Metadata Repository Development
After being analyzed and designed, the development can be started. The steps need to be followed are: Build the metadata repository database, build and unit test the metadata migration process, build and unit test the metadata application, test the metadata repository programs or product functions, prepare the metadata repository for production, and provide metadata repository training.
- Implementation
After all been installed then the implementation can be started. Planning the implementation is the first step needed, it sets the date and make sure everything needed is available. Then setting up the environment, install all the BI applications components, set up the production schedule, load the production databases, and prepare for ongoing support after the implementation.
- Release Evaluation
After a period of time that have been agreed, release evaluation is needed to keep an eye to the implemented application so it can be tracked. Release evaluation may consist of some steps like prepare for the post implementation review, organize the post implementation review meeting, conduct the post implementation review meeting, and follow up the post implementation review [11].
4. Data Visualization
Having a massive number and complex types of data may seem very complicated for data owner, but the data is actually very profitable for the organization. The data can be analyzed by combining different variables and can give analytical views. This can be done by doing a visualization. Data visualization is the visualization of the information in graphs, charts or maps and it provides an easy way to understand the data [11]. By having the data visualized in some ways, it provides benefits such as improving decision making, better ad hoc data analysis, improve collaboration/information sharing, provide self-service capabilities to end users, increase return of investments (ROI), time savings, and reduced burden on IT [8].
Data visualization needs to pay attention on designing the visualization because the objective of visualizing the data is to make it easily understood but still give the important information. There are some ways to visualize the data:
- Line graph
Gives information about relationship between items
- Bar chart
Makes the comparison more visible
- Scatter plot
Two-dimensional plot showing variations of two items
- Pie chart
Compare parts of whole [12].
In its application, data visualization is very useful for helping the decision maker or executives to monitor the intrapreneurs regarding their progress, so the decision maker may be able to see it based on actual data that can be provided real time.
5. Data Mining
Data Mining as already mentioned, is the process of finding useful information from a large size of data. There are some techniques of data mining that can be use, classification, clustering, prediction, and association. In this research, using classification might be the best way to process the data. There are some methods like Decision Tree and Naïve Bayes that can be used to help make an insight for decision maker. Using those two methods can make a descriptive result to gain some insight. By using data mining, hopefully the decision maker makes better decisions that can make a great impact for the company.
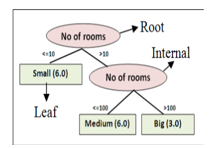 Figure 2: Decision Tree
6. Decision Tree
A decision tree is a decision support system that uses a tree-like graph decisions and their possible after-effect, including chance event results, resource costs, and utility. Decision Tree is one of the common classification methods that easy to interpret by human, and decision tree also known as a prediction method that using a tree structure or hierarchy structure. It’s easy to classify the data using this method because the data will be classified into some groups which result a prediction.
There are some benefits that can be obtained of using decision tree:
- Easy to understand
- Can process various kind of data
- Produce optimal result with less effort
- Can be used in data mining packages over many kind of platforms
Figure 2.0 depicts the example of decision tree. It containts a root node, leaf nodes (classes), and internal nodes (test conditions applied on attributes). [13]
7. Naive Bayes
The naïve Bayesian classifier is based on Bayes theorem and assumes that the effect of an attribute value on a given class is independent of the other attributes [14]. Naive Bayes is machine for probabilistic learning algorithm used to discriminate different objects by many features. It can be used for wide classification task or high dimensional data. One of Naïve Bayes characteristic is a very strong assumption (naive) of independence from each condition / event.
Naïve Bayes classification algorithm also has several advantages such as easy to use and only requires one-time training data iteration but Naïve Bayes requires initial knowledge to be able to make decisions.
The Advantage of using this method is that it only requires slight of bunch data set to determine the estimated parameters that needed in the process of classification. Naive Bayes Classifier is considered to work very well compared to other classifier models, namely Naïve Bayes Classifier has a better level of accuracy than other classifier models.
8. Rule Based Reasoning
Rule Based Reasoning or RBR is one of important and complementary reasoning methodologies in artificial intelligent (AI) beside Case Based Reasoning. Rule Based Reasoning integration can manage to problem solving, in complex and real-world situation. Instead of predicting the outcomes, rule-based reasoning is more likely analyze the pattern of the data. This can be useful if the data that we have, has many different outcomes. RBR has the rule based by two major components: first, the knowledge based that consist of “IF… THEN…” to represent the knowledge. Second, the inference engine who contain some domain independence inference mechanisms.
The mechanism has two types which the forward chaining and backward chaining. In forward chaining, starting with data then look for rules which apply and often called data driven reasoning. For the backward chaining, it starts from the goals the look for the rules until the conclusion reached and sometimes called goal driven reasoning [15].
9. Problem Identification, Learning Objectives, Learning Significances
In the start of Intrapreneurship Program, all data that was obtained from the intrapreneurs, such as data about talent, ideas, and monitoring and evaluation, was collected, stored, and processed using Microsoft Excel. Microsoft Excel might be an adequate tool at first, because the data back then was probably not as much as it is now. As the data keeps growing, the management also need to obtain insights to help them make a good decision.
Every intrapreneur needs to get through a series of steps to be able to graduate from Intrapreneurship Programs and join the subsidiaries to adapt in their new environment to be able to scale up. In that process, Innovation Management needs to be keep informed about Intrapreneur’s Performance in purposes of monitoring and evaluating the progress of Intrapreneur. At some point, in every monthly review, intrapreneurs will present their progress, and Innovation Management will make decisions regarding to Intrapreneur’s performance whether they need to pass the intrapreneur team to the next stage or fail the intrapreneur team because they are proved to be not improving.
Up until now, management doesn’t have the tool to monitor the Intrapreneur’s progress or data clarity to support the decision making. With the Intrapreneur Dashboard, all the data will be integrated and visualized in one place and the information will be easily accessed in real-time.
The implementation of Intrapreneur Dashboard for Innovation Management is expected to benefits Intrapreneurs itself. There are some problems obtained from the background:
- Management doesn’t have the tool to monitor the Intrapreneur’s progress or data clarity to support the decision making
- Management find it difficult to decide regarding the continuity status of Intrapreneur Team
Based on the identified problems, the objectives to be achieved from this learning are:
- To help the decision maker (Innovation Manager) decide regarding continuity status of Intrapreneur based on data progress and data recommendation
- To give the recommendation of which Intrapreneur that has the potential to pass the stage or not based on performance data
- To help Innovation Management in monitoring performance of each Intrapreneur
- To make visualization of information about Intrapreneur’s progress and recommendation data in anytime that needed
The benefits expected from the objectives are:
- Can monitor Intrapreneur with a dashboard that can provide information about the performance progress of each Intrapreneur Team and also recommendation data from the results of data processing using an algorithm
- Overcome the problem of decision making regarding to Intrapreneur Team’s continuity status
- Overcoming the problem of data visualization to be more easily understood and can be seen at any time.
10. Conclusion
Having lots of data coming from many different sources can give some companies a distinct advantage, depends on how those companies collect and process those data. The data can be so worthwhile and give some insights if its properly processed. These insights can be obtained by using Decision Support System that can be useful to help decision makers making decisions based on data that can be considered.
Using data mining to process the data, evidently it makes the data more useful and gain more insights, such as giving the prediction and see the pattern of the data to give some information needed. After using data mining to process the data, we can visualize our data to make it more appealing and easier to understand.
People tend to see a visualization in order for them to understand what is the actual meaning of data. Data visualization can be displayed in different form depends on the data itself. Using a dashboard to visualize the data can be applied in order to present the data in the best way possible.
The research presented in this paper aims at improving the quality of dashboard for Innovation Management and using it for innovation manager to gain more insight, so they can make a firm decision regarding the continuity of Inrapreneur Team based on data. Also, by seeing the intrapreneur dashboard, it will be easier to monitor and track the progress of intrapreneurs.
Conflict of Interest
The authors declare no conflict of interest.
- Parker, Simon C. (2009) Intrapreneurship or entrepreneurship? Journal of Business Venturing 26 (2011) 19–34. doi:10.1016/j.jbusvent.2009.07.003
- Benitez‐Amado, J., Llorens‐Montes, F. J., & Nieves Perez‐Arostegui, M. Information technology‐enabled intrapreneurship culture and firm performance. Industrial Management & Data Systems, 110(4), 550–566.
(2010) 561-562, doi:10.1108/02635571011039025 - Augusto Felício, J., Rodrigues, R., & Caldeirinha, V. R. The effect of intrapreneurship on corporate performance. Management Decision, 50(10), 1717–1738. (2012) doi:10.1108/00251741211279567
- Zins, Chaim. (2007). Conceptual approaches for defining data, information, and knowledge. JASIST. 58. 479-493. 10.1002/asi.20508.
- Power, D. J. (2008). Understanding Data-Driven Decision Support Systems. Information Systems Management, 25(2), 149–154. doi:10.1080/10580530801941124
- Hand, D. J. (2013). Data Mining
- Chen, L.-D., Sakaguchi, T., & Frolick, M. N. (2000). Data Mining Methods, Applications, and Tools. Information Systems Management, 17(1), 65–70. doi:10.1201/1078/43190.17.1.20000101/31216.9
- Wang, L., Wang, G. , & Alexander, C. A. (2015). Big Data and Visualization: Methods, Challenges and Technology Progress. Digital Technologies, 1(1), 33-38
- Pauwels, K., Ambler, T., Clark, B. H., LaPointe, P., Reibstein, D., Skiera, B.,Wiesel, T. (2009). Dashboards as a Service. Journal of Service Research, 12(2), 175–189. doi:10.1177/1094670509344213
- Smith, V. S. (2013). Data Dashboard as Evaluation and Research Communication Tool. New Directions for Evaluation, 2013(140), 21–45. doi:10.1002/ev.20072
- Business intelligence roadmap 576 pages, Publisher: Addison-Wesley Professional; 1 edition (March 7, 2003), Language: English, ISBN-10: 0201784203, ISBN-13: 978-0201784206
- Sadiku, Matthew & Shadare, Adebowale & Musa, Sarhan & Akujuobi, Cajetan & Perry, Roy. (2016). DATA VISUALIZATION. International Journal of Engineering Research and Advanced Technology (IJERAT). 12. 2454-6135.
- Mathuria, M., Bhargava, R., Sharma, G. B. N. (2013). Decision Tree Analysis on J48 Algorithm for Data Mining, 3(1). 1114-1119.
- NH Niloy, MAI Navid, Naïve Bayesian Classifier and Classification Trees for the Predictive Accuracy of Probability of Default Credit Card Clients, American Journal of Data Mining and Knowledge Discovery. Vol. 3, No. 1, 2018, pp. 1-12. doi: 10.11648/j.ajdmkd.20180301.11
- Dutta, S., & Bonissone, P. P. (1993). Integrating case- and rule-based reasoning. International Journal of Approximate Reasoning, 8(3), 163–203. doi:10.1016/0888-613x (93)90001-t