The Potential of Ocean Current as Electrical Power Sources Alternatives in Karimunjawa Islands Indonesia
 , Dwi Haryo Ismunarti 1, Denny Nugroho Sugianto 1, 2, Siti Maisyarah 1, Petrus Subardjo 1, Agus Anugroho Dwi Suryoputro 1, Hendry Siagian 1
Adv. Sci. Technol. Eng. Syst. J. 4(6), 126–133 (2019);
 DOI: 10.25046/aj040615
Electrical energy shortage and expensive basic electricity costs are one of the problems that are occurred in Karimunjawa Island, Indonesia. The purpose of this research is to identify the potential of ocean currents energy as one of the alternatives to reduce the problem related to energy needs and to predict the electrical energy that can be obtained. The physical phenomena movement of ocean currents is made by using the 2-Dimensional hydrodynamic mathematical model. ADCP Multicell Argonaut-XR type is used to measure the speed of ocean currents to validate the model result. Tidal, wind, coordinate and bathymetry data are all the variables that are in the mathematical model of ocean current movement. The potential of electrical energy is determined by the value of power density which is calculated based on the speed ocean current model. The result of this research is the map of the potential distribution of ocean currents in Karimunjawa waters.
1. Introduction
Indonesia was a maritime country which is the largest archipelago with an area of 5,193,252 km2, two-thirds of Indonesia’s territory is an ocean, which is around 3,288,683 km2 [1] and the whole island is about 17,508 islands [2]. Karimunjawa Islands situated on the Java Sea along of coordinate 5 ’40 “- 5′ 57” SL and 110 ‘4 “- 10’ 40” EL. The area is around 111,625 ha, consisting of 7,033 ha of land and 104,592 ha of water. There are 5 inhabited islands out of 27 islands in Karimunjawa namley Karimunjawa, Kemujan, Parang, Nyamuk and Genting island [3]. One of the problems in the Karimunjawa islands is electricity. The occurrence of an electricity crisis in the form of service time duration is only lights up 6 hours each day and basic electricity cost are expensive [4]. Since the enactment of Government Regulation Number of 12, 2012 concerning retail cost and consumers of specific fuel users, diesel power plants sources (PLTD) in Karimunjawa must used industrial diesel at cost of IDR 14,700 each liter. The regional government spend money IDR 12 billion each year to welshed supply electricity [5].
According to [6,7], the sea potential being a course of energy is very high. The stored energies the potential of wave energy, tidal range, ocean currents, ocean thermal & salinity gradient energy, and subsea geothermal energy. According to the Indonesian Marine Energy Association (ASELI), the total of marine resources in Indonesia reaches 727,000 MW [8].
Research related to ocean currents as a potential source of electrical energy has been conducted since 2006 in East Nusa Tenggara, i.e. in Lombok Strait, Alas Strait, Nusa Penida Strait, Flores Strait, Pantar Strait [9] and Larantuka waters, East Flores [10]. The results of research in Larantuka waters show that ocean currents have great potential to be developed as an energy source of the power plant. The characteristics of ocean currents are generated by tidal currents. The morphological condition of the waters in the presence of Gonzales strait causes an optimum current speed. Forecast that 96% of ocean currents in Larantuka waters has the potential to be developed as a power plant. The average power density generated is 6271,75 watts [11].
Some countries have managed to harness ocean current and tidal energy as the source of power plants, from a generator’s turbine prototype to the commercial-scale turbines with a capacity of 1.2 MW / turbine. Marine current energy plants have been built in Scotland, Sweden, France, Norway, England, Northern Ireland, Australia, Italy, South Korea, and the United States [12].
Ocean currents are horizontal motions of water masses so they have kinetic energy that can drive the rotor or turbine power plant as well as on wind power plants. An effort to explore a source of energy unconventional from the ocean currents begins with the mapping of the ocean currents and the potential energy. The movement of ocean currents that swept across the ocean currents in the water line data based observations and takes along time and is quite expensive in measuring data. An alternative approach mathematical models to study how the pattern of the current movement in the water line. The model is a prototype or imitation of real situation [13]. Over the past three decades the development of mathematical models has been rapidly driven by the development of numerical analysis, computer technology, and visualization techniques. The acceptance and confidence level of the mathematical model on hydrodynamics is currently very high, both in research, engineering and industry [14].
The Mathematical equation formulas that describe the physical phenomena of current movements include 2-D mathematical model in hydrodynamics. As for the force that can affect the movement of the current model is the tidal forces on the surface. Variables that will be used in the mathematical model of the movement of ocean currents conducted are tidal, wind coordinate and bathymetry data. Energy potential can be determined by the power density calculated based on the value of the current speed obtained from the ocean current model. Energgy potential was presented in the map of potential energy distribution.
The purpose of this research are carried out in developing studies of renewable energy sources of ocean current in the Karimunjawa Islands. Ocean current energy is renewable energy that can be used as potential energy in the coastal areas, especially in small islands [15]. Ocean current pattern mapping is the first step to explore non-conventional energy sources of ocean currents. Information on current movement patterns can also be used for various purposes such as consideration in the construction of harbor docks, onshore and offshore structures (drilling rig and pipes to be installed on the seafloor), aquaculture and site selection most likely for development of current power generation [13].
2. Materials and Methods
2.1. The research area
Quantitative method as the main method used in this study, the resulting data includes quantitative data as the main and supporting data. quantitative data in the form of data figures that will be analyzed according to the method [16]. there are 2 types of data used in this study, namely primary and secondary data. Data including secondary data is wind data for 10 years (2004-2014) with hourly records obtained from BMKG Semarang. Data obtained from DISHIDROS are coordinate data and bathymetry data. Secondary data is used to build 2-D mathematical model of current speed and direction of the current. Water flow data throughout the year are generated from 2-D mathematical modeling.
 Figure 1. Study area and observation station [17].
Primary data measurement are tidal elevation and the current speed & direction data. Field data obtained are used to test the accuracy of the model. The current speed was measured using an ADCP Multi-Cell Argonaut-XR type device with wave length sensor beam 0.75 MHz and autonomous multi-cell system. Water depth is about 13 meters, while the total depth is 12 meters. Current speed is observed at eight points depth (d) or layers, i.e. at a depths of 1.5 meters, 3 meters, 4.5 meters, 6 meters, 7.5 meters, 9 meters, 10.5 meters, and 12 meters. Current speed measurements were carried out for 5 x 24 hours with measuring intervals at each layer and an average layer of 600 seconds. The obtained maximum current speed in the depths between 1.5 meters – 3 meters is 1.02 m/s. The measurement station point was determined based on the maximum current speed of the simulated numerical model at the same time as the field measurement [17].
2.2. Mathematical Model on Hydrodynamics
Ocean currents are the horizontal movement of seawater mass caused by the driving force acting on seawater. The main movement of water were caused by tides or the movements of sea levels due to the gravity [18-19], The current is also generated by the wind that blows on the surface of the water that transfers momentum and energy to the surface layer of water. Wind stress creates a tangential force which then moves the water in the direction of the wind.
The processes that occur in the fluid at sea are complex. The process described in a mathematical equations is called a mathematical model. Mathematical modeling on hydrodynamics to gain an understanding of ocean hydrodynamics. The goal is to study the mechanical variables of the fluid systems at sea. Utilization of models among others for tidal prediction, water level elevation, current pattern, nutrient dispersion or pollutants, sedimentation and erosion.
The current movement patterns have vertical dimensions (depth) and horizontal dimensions. In general, the depth dimension is much smaller than the horizontal dimension so that the model that we used is a two-dimensional horizontal model (2DH). The mathematical equations that references the 2DH model is a continuity and momentum equation with simplicity: The mean value of depth is considered to represented parameters values that fluctuate along with the depth of flow. The speed and accelerationin the vertical direction are considered to be of small value, so they are ignored. the hydrostatic pressure distribution that applied together with the depth and the slope of base int both small horizontal directions.
The average value of the hydrodynamic variable at all depth is obtained by integrating it into the flow depth: . According to the study of Kowalik and Murty [20] the continuity and momentum equations for two DH current are:
 Where:
x = distance in x-direction (direction of longitudinal flow), m
u = x-directional horizontal speed, m/s
y = distance in the y-direction (lateral flow direction), m
v = horizontal speed of the y-direction, m/s
t = time, s
h = water depth, m,
r = density, kg/m3
is the basic slope of the x and y directions.
is the slope of energy lines in the x and y-direction.
is the mean shear stress to depth
g = acceleration of gravity,
The slope of the energy line is calculated by the Manning or Chezy equation:

 2.3. Ocean Current Energy as A Power Plant
Utilization of ocean currents as a source of electrical energy has same principle as wind power. Kinetic energy from ocean currents is generated from water that moves through water turbines. Compared to wind turbines, currents turbine will produce greater energy at the same speed. This occurs because the density of seawater is much higher than the density of air [21].
Current-generated power plants almost do not produce pollution. Current power generation also has no impact on current flows or sediment transfers as it affects only the pattern of ocean currents at the site. Slow turbine blade speeds are harmless to marine organisms and do not produce underwater sound pollution compared to ship propellers so it will cause into the small ecology [22]. In addition, the current has a tendency phase along with the rise and fall of the tides so that the power generated is easy to predict [23].
The energy potential is assumed in terms of power density which is proportional to its speed. The power assemblies generated by ocean currents can be calculated using the following equation: , where ρ is the density of seawater (kg/m3); A is the area of turbine cross-section used (m2), and V is the speed of ocean currents (m/s) [24]. Seawater density is assumed to be homogeneous with a value of ρ = 1.025 kg/m3 [21].
 Figure 2. Relationship of power density and current speed; (I) Current speed less than cut-in speed; (II) Current speed between cut-in speed and rated speed; (III) Current speed above rated speed [21].
The statistical approach used is the potential probability analysis [25] Turbine boundary conditions used in the normal distribution are the Helix Gorlov turbine that is 0.5 m/s, while the normal distribution equation is [26] :
![]() Turbine efficiency varies with current speed change. Cut-in speed is the minimum speed of current to be able to drive the turbine [27]. When the current speed is less than the cut-in speed, the kinetic energy to drive the turbine is insufficient and consequently, no power is produced. When the current speed is between the cut-in speed and rated speed, the power generated by the turbine can vary with the changes in current speed, which increases when the ocean current speed increases and decreases as the current speed decreases. Rated speed is the maximum speed that function as a barrier. Above that speed of the power generated by the turbine will be constant regardless of the current speed [23].
Turbine efficiency varies with current speed change. Cut-in speed is the minimum speed of current to be able to drive the turbine [27]. When the current speed is less than the cut-in speed, the kinetic energy to drive the turbine is insufficient and consequently, no power is produced. When the current speed is between the cut-in speed and rated speed, the power generated by the turbine can vary with the changes in current speed, which increases when the ocean current speed increases and decreases as the current speed decreases. Rated speed is the maximum speed that function as a barrier. Above that speed of the power generated by the turbine will be constant regardless of the current speed [23].
3. Results and Discussion
3.1. The validation of the result
The validation in this model used RMS (Root Mean Square) method [26], where RMS is a non-dimensional value to indicate a match two kinds of data. The set values of the model defined by b_1, b_2,…, b_n while the measurement define by a_1, a_2,…, a_nso we have:
![]() The results validate the model results with field results indicate that the water level modeling results are 0.06 m (Figure 3) where the tolerance is 0,1 m, which means that the model has very good criteria. Karimunjawa waters generally have a tidal type of single daily tidal waters with a Formzahl value of 4.16 (F> 3) [28]. sinusoidal which is equal to water level. High current speed occurs when tide elevations lead to low tide. The direction of the current shows the direction of the current which has 2 directions (bi-directional current). Changes in current direction occur following changes in water level, during high tide the current direction is receding dominated by the direction 270o to 315o (west-northwest). At low tide towards the tide direction that dominates the direction is 40o to 70o (northeast) [17].
The results validate the model results with field results indicate that the water level modeling results are 0.06 m (Figure 3) where the tolerance is 0,1 m, which means that the model has very good criteria. Karimunjawa waters generally have a tidal type of single daily tidal waters with a Formzahl value of 4.16 (F> 3) [28]. sinusoidal which is equal to water level. High current speed occurs when tide elevations lead to low tide. The direction of the current shows the direction of the current which has 2 directions (bi-directional current). Changes in current direction occur following changes in water level, during high tide the current direction is receding dominated by the direction 270o to 315o (west-northwest). At low tide towards the tide direction that dominates the direction is 40o to 70o (northeast) [17].
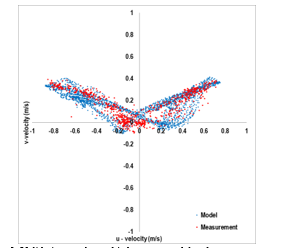 Figure 3. Validation result graphic between model and measurement vector velocity (Source: Data Processing, 2017)
Simulation of the ocean current numerical model in the depths between 1.5 meters – 3 meters was carried out in spring and neap tidal conditions. In this model tides is assumed has no influence of wind or basic friction. Full tides are formed due to the accumulation of lunar and sun attraction in a straight line. This statement is supported [29] who state that the earth’s rotation and the relative position of the earth with respect to the moon and the sun affect the tides of the sea. The numerical simulation results are simplified by several complex parameters in the waters that are made into domains to facilitate the implementation of numerical simulations. Argues that to carry out simulations a system simplification is needed by maintaining the stability of the main components [30].
The model simulation is performed on high tides and low tides conditions (Figure 4 and 5). At the hight to low tides shows that the ocean current moves from NorthEast to SouthWest, while in the low to high tides the ocean currents moves from southwest to northeast where the highest current speed is 1.2 m/s. This is consistent with the statement from [31] tidal currents have the nature of moving in opposite directions or bi-directional. The direction of current during tide is usually the opposite of the direction of current when receding.
 Figure 4. The pattern of low to high tides (left), high to low tides (right) in the spring season
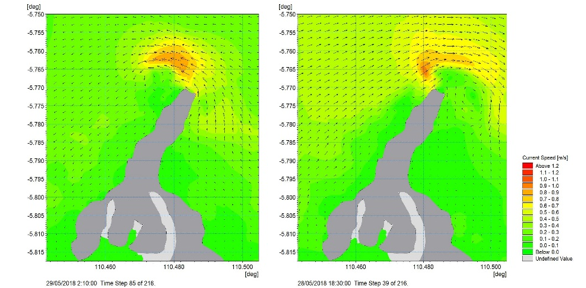 Figure 5. Tidal current pattern on low to high tides (left) and high to low tides (right) in the neap season.
According to [32], tidal currents will affect daily flow patterns. Tidal currents generally flow from the coast towards the Indian Ocean when the tide and vice versa will flow from the Ocean to the coast at low tide. This current dominates the waters of Karimunjawa.
3.2. Current speed Result
The current conditions from the numerical model simulation is shown in all season condition (west season, east season, the transition 1 and the transition 2 seasons). Presentation of current patterns spatially is the method of presentation in which data speed and current direction are displayed based on location or specific coordinates. The peak month of each season is represented by the conditions that are taken in. From this figure (Figure 6,7,8 and 9), we can see the highest speed is 1.1 m/s in the West and East Season, while the highest speed in the transition 1 and 2 Season is 0.9 m/s.
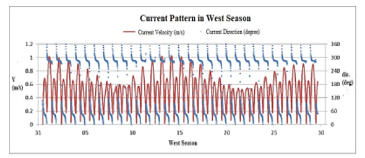 Figure 6 Current speed and direction graphic in west season
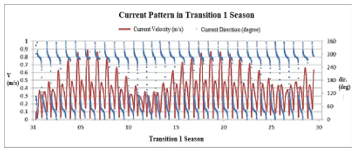 Figure 7. Current speed and direction graphic in the transition 1 season
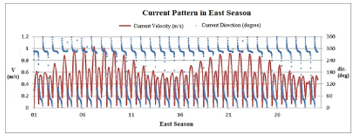 Figure 8. Current speed and direction graphic in east season
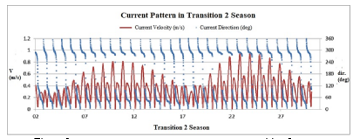 Figure 9. Current speed and direction graphic in transition 2 season
3.3. Analysis of Potential Energy
Overall current speed has a speed above the value of the turbine requirement limit (cut in speed) which is equal to 0.5 m / sec, in general, it can be seen that the current speed has the potential for ocean current energy in all seasons. The current speed from numerical model result is used to convert the estimation of electrical power calculations (watt) which is shown in all season conditions.
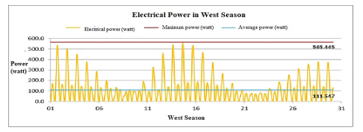 Figure 10. Potential power result (watts) in the west season
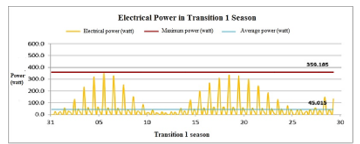 Figure 11. Potential power result (watts) in the transitional 1 season
 Figure 12. Potential power result (watts) in the east season
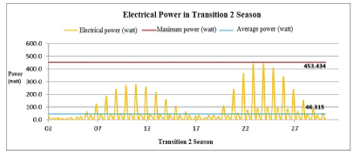 Figure 13. Potential power result (watts) in transitional 2 season
After we know the optimal potential of each season we can decide where will be the potential location of the ocean current power station. The highest potential Electrical Power in West season is 565.445 Watt, at the Transition 1 is 359.85 Watt, in the East Season is 556.76 Watt while in the transition 2 is 453.34 Watt. The analysis results are represented in Figures 10, 11, 12, and 13.
In the East Season the average of electrical power is 97.526 Watt and in the transition season is 46.315 Watt, while in the west season the highest average of electrical power obtained is 111.5 watts and the lowest average of electrical power is in the transition season 1 is 45.01 watts. We can see that the Electrical Power is really depended on the value of the ocean current speed (see Figure 10, 11, 12 and figure 13). The higher the speed value, the higher the electrical energy produced.
The current speed datum can then be calculated to show the estimated available power, where the higher the current speed, the greater the power produced. The location where the power meeting is the highest compared to other places. The area is then determined as the potential location. A high enough power density potential will occur when tide conditions lead from high to low tide and on the lowest tide condition. Whereas for the small amount of power density potential only appears when the tide is highest and when the tide is lowest.
3.4. Spatial Result of Power Density (watts) with Tidal Condition
From Figure 14 and 15 we can see the result of the current speed from the numerical simulation that has been converted into a spatial power density condition at each tidal condition. We can see that in the Northern area of the Karimun Jawa Island has the highest distribution of potential Electricity Power distributed with the average Electricity Power is 450 Watt.
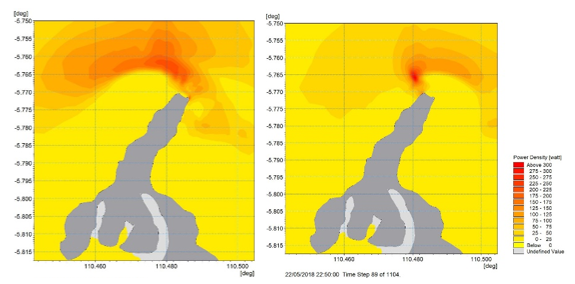 Figure 14. Spatial electrical power density result in low tides to high tides condition (left), high to low tides condition (right) in the spring season
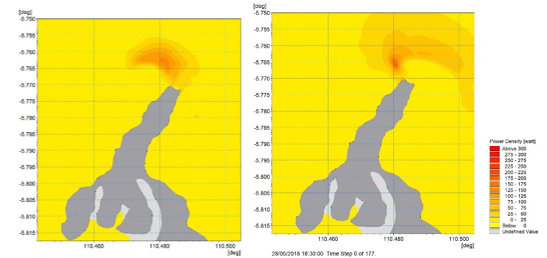 Figure 15. Spatial electrical power density result in low tides to high tides condition (left), high to low tides condition (right) in) in the neap season
4. Conclusion
Based on a cut-in speed of 0.5 m /s, throughout the Kemojan, Karimunjawa Island has the potential for renewable power with a layer depth of 1.5m to 3m. The highest Electrical Power potential in the West season is 565,445 Watt, and the lowest Electrical Power potential in Transition 1 season is 359.85 Watt. Based on the results of this study, it can be said that the Karimunjawa island which initially relied on PLTD for the fulfillment of its electricity powers, could have great potential to develop electricity from ocean currents, which is far more economical and environmentally friendly compared to fossil energy.
5. Acknowledgment
We would like to thanks to Ministry of Research, Technology and Higher Education which gave us funding from Fundamental Funding of Directorate of Research and Community Services, Directorate of General Research and Development, Ministry of Research, Technology and Higher Education as the agreement letter of Research Implementation assignment, with Research Number : 022 / SP2H / LT / DRPM / II / 2016 dated on 17th February 2016. Give thanks also to the students of the Oceanographic Department who involved in this research, i.e., Satrio Srijati, Albert Gunawan, Larosa Nurfikri, Muhammad Noerman and Radhitya Rega.
- Mulyanef, Marsal, Rizky Arman, K Sopian, “Sistem Distilasi Air Laut Tenaga Surya Menggunakan Kolektor Plat Datar Dengan Tipe Kaca Penutup Miring”, Teknik Mesin Universitas Bung Hatta; Padang, 2006.
- Nurhayati, “Distribusi Vertikal Suhu, Salinitas dan Arus di Perairan Morotai, Maluku Utara, Oseanografi dan Limnologi di Indonesia”,2006.
- Departemen Kehutanan, Balai Taman Nasional Karimunjawa, “Penataan Zonasi Taman Nasional Karimunjawa Kabupaten Jepara Provinsi Jawa Tengah”, 2004.
- Parwito, “Tiap Hari, Listrik di Pulau Karimunjawa Hanya Nyala 6 Jam”, Merdeka.com, Thursday, 20th February,
- Humas Jateng, “ Listrik Untuk Karimunjawa”, go.id, Accessed on Friday, 4th– April 2014, 3:31 pm, 2014.
- R, “Technology characterization: Ocean wave and tidal energy”, Global Marine Energy Conference, April, New York, 2008.
- Lo A, J.A. Somolinos, L.R. Nunez, and M. Santamaria, “Modeling and Simulation of Moored Devices for Ocean Currents Energy Harnessing”, Journal of Maritime Research, VIII (1): 19 – 34, 2011.
- Asosiasi Energi Laut Indonesia (ASELI), “Potensi Sumber Daya Energi Laut di Indonesia”, ASELI, Bandung, 14 pages, 2011.
- S, “Pembangkit Listrik Tenaga Arus Laut bagi Desa Pesisir Tertinggal (Second Opinion) Ministry of Energy and Mineral Resources”, 22nd April, 2014
- A, and A. Masduki, “Potensi Energi Arus Laut untuk Pembangkit Tenaga Listrik di Kawasan Pesisir Flores Timur, NTT”, Jurnal Ilmu dan Teknologi Kelautan Tropis, 3(1): 13-25, 2011.
- Siagian, Hendry Syahputra, I. B. Prasetyawan, H. Ismunarti, and R. B. Adhitya, “Study of the Potential of Ocean Current as an Energy Power Plant in the Larantuka Strait, East Flores, East Nusa Tenggara”, Buletin Oseanografi Marina Januari 2014 Vol, 3(1): 1–8, , 2014 http://ejournal.undip.ac.id/index.php/buloma
- Kementerian Energi dan Sumber Daya Mineral, “Peraturan Menteri Energi Dan Sumber Daya Mineral Republik Indonesia No. 13 Tahun 2015” Jakarta, 2015.
- Sugianto, D.N and D.S. Agus, “Studi Pola Sirkulasi Arus Laut di Perairan Pantai Provinsi Sumatera Barat”. Jurnal ILMU KELAUTAN, June 2007, Vol, 12 (2): 79 – 92, 2007.
- Istiarto, “Model Hidrodinamika di Bidang Hidraulika Saluran Terbuka”, http://istiarto.staff.ugm.ac.id. Accessed on 12 April, 2015.
- Erwandi, “Sumber Energi Arus: Alternatif Pengganti BBM, Ramah Lingkungan, dan Terbarukan”, Laboratorium Hidrodi-namika Indonesia, BPP Teknologi, 2006.
- Priyono, “Metode Penelitian Kuantitatif”, Revised Edt, Zifatama Publishing, Surabaya, ISBN : 978-602-6930-31-6. 206 pp,
- Ismunarti, Haryo, Sugianto. D.N, Ismanto. A., “Kajian Karakteristik Arus Laut Di Kepulauan Karimunjawa Jepara”, Prosiding Seminar Nasional Hasil-Hasil Penelitian Perikanan Dan Kelautan Ke-Vi Fakultas Perikanan Dan Ilmu Kelautan – Pusat Kajian Mitigasi Bencana Dan Rehabilitasi Pesisir, Undip, 254 263, 2017 .
- Pond, S. and G.L. Pickard, “Introductory Dynamic Oceanography Second Edition”, Pergamon Press, Oxford, 329 p, 1983.
- Hadi, S. dan I.M. Radjawane, “Arus Laut”, Institut Teknologi Bandung, Bandung, 88 pages,
- Kowalik and Murty, “Numerical Modeling of Ocean Dynamics”, World Scientific, Volume 282, 10 January 1995, p. 407, 1993, https://doi.org/10.1017/S0022112095240187
- Hagerman, G., B. Polagye, R. Bedard, and M. Previsic., “Methodology for Estimating Tidal Current Energy Resources and Power Production by Tidal In-Stream Energy Conversion (TISEC) Devices”, EPRI, Virginia, 52 p,
- Moreno, N., R. Sallent, A. Espi, D. Bao, and Y. Teillet., “Ocean Current’s Energy: How to Produce Electrical Energy Thanks To The Marine Currents?”, University of Gävle, Gävle, 23 p,
- Fraenkel, P.L., “Marine Current Turbines: Pioneering The Development of Marine Kinetic Energy Converters”, Proc. Instn. Mech. Engrs., 221 (Part A) :159-169, 2007.
- Fraenkel, P.L, “Power From Marine Currents”, Proc. Instn. Mech. Engrs., 216 (Part A):1-14, 2001.
- Thomson R. dan Emery J.W., Data Analysis Methods in Physical Oceanography ,1st ed. Pergamon. England, 1997.
- Gorlov, M., “Turbines with a twist”, In: Kitzinger U and Frankel EG (eds) Macro Engineering and the Earth: World Projects for the Year 2000 and Beyond, pp, 1} 36, Chichester: Horwood Publishing, 1998.
- Giorgi, S. and J.V. Ringwood, “Can Tidal Current Energy Provide Base Load?”, Journal of Energies, 6: 2840-2858, 2013.
- EVANS, G., “A Framework for Marine and Estuarine Model Specification in the UK”, Foundation for Water Research, Report No FR0374, 1993.
- Trujilo, A.P., and H.V. Thurman, “Essentials of Oceanography 10th Edition”, Prentice-Hall, Boston, 551pp, 2011.
- Cahyana, C, “Model Hidrodinamika Laut”, BATAN, Jakarta, Buletin LIMBAH 9 (2) : 17-18 pp, 2005.
- Djunarsjah, E., dan Poerbandono, “Survei Hidrografi”, PT. Refika Aditama, Bandung, 2005.
- Ongkosono, O.S.R, and Suyarso, “Pasang Surut”, Pusat Pengembangan Oseanologi Lembaga Ilmu Pengetahuan Indonesia, Jakarta, 257 pp, 1989.