Discriminant Analysis of Diminished Attentiveness State Due to Mental Fatigue by Using P300

Adv. Sci. Technol. Eng. Syst. J. 4(6), 108–114 (2019);
 DOI: 10.25046/aj040613
Fatigue is broadly divided into two types depending on the content of a task: physical fatigue and mental fatigue. Mental fatigue is associated with human error. It is thus important to search for indicators that can easily evaluate mental fatigue. The aim of this study is to construct a system that can evaluate mental fatigue in a simple manner. To achieve this, we investigated the influence of the accuracy of linear discriminant analysis in two classes before and after the application of a mental load. In addition, we investigated whether the mental fatigue state can be estimated even when the number of trials for averaging is small, by combining the electroencephalogram power spectral density component and the P300 component. As a result, this combination of the power spectral density component with the P300 component resulted in measured waveforms that exhibited an accuracy of approximately 97%, even when the number of trials for averaging was as small as five trials.
1. Introduction
The technological development of wearable devices in recent years has made it easier to measure biological information. In addition to devices that can measure heart rate or activity level, wearable electroencephalogram (EEG) devices that can measure brain waves have emerged, and their use is becoming more widespread. In the past, expensive equipment was generally used to measure brain waves and it was difficult to continually take these measurements during a person’s daily life. However, as wearable EEG devices have become more widespread, dry electrodes that do not require the application of conductive paste have emerged. This development is making it more and more feasible to collect big data in the field of neuroscience. However, the data obtained from wearable devices differ from biological information measured by medical devices. As such, these data need to be applied appropriately. This paper focuses on the use of EEG to evaluate mental fatigue as a method of applying measurement data obtained from wearable devices. This paper is an extension of work originally presented in IEEE International Conference on Systems, Man, and Cybernetics (SMC) 2018 [1].
Fatigue is broadly divided into two types depending on the content of a task: physical fatigue and mental fatigue. While the in vivo mechanisms and processes of physical fatigue have been studied, particularly in fields like exercise physiology [2], there is no consensus regarding what mechanisms induce mental fatigue or how it should be measured, and even recent studies have taken a variety of different approaches to researching the subject [3, 4]. In the fields of ergonomics and occupational health, the flicker test is widely used to evaluate mental fatigue [5, 6]. The flicker test evaluates eye fatigue by measuring the frequency or flicker interval threshold, also known as the Critical Fusion Frequency (CFF), as the frequency of a flickering light is changed. However, the CFF is self-reported by subjects and the influence of subjective factors cannot be ruled out. Other than the flicker test, attempts have also been made to evaluate mental fatigue using salivary amylase [7, 8]. A rise in salivary amylase is generally thought to indicate an increase in sympathetic nervous activity. However, sympathetic nervous activity can arise because of negative emotions or mental stimulation. As such, evaluating mental fatigue using autonomic nervous activity indicators such as sympathetic nervous activity or vagal nervous activity often leads to difficulties with interpretation. Meanwhile, EEG waveforms contain both components for evaluating autonomic nervous activity and event-related potential components, which can both be used to evaluate cognitive function. This means that it may be possible to estimate the decreased attentiveness that accompanies mental fatigue by combining these EEG components. This paper focuses on brain waves as an indicator for evaluating mental fatigue.
In previous studies, there are reports in which α-wave band power increases during mental fatigue [9, 10], there are also reports showing that it decreases as well [11, 12], and thus, there is no consistent trend. P300, an event-related potential, is the positive potential change produced 300 ms after exposure to external stimuli. Its amplitude is significant in that the amplitude is dependent on the amount of processing resources at the perceptual-central level assigned to the event that caused the positive potential change. Prolonged latency and lowered amplitude during mental fatigue have been reported [13, 14]. When calculating P300, the signal-averaging technique must be used in order to produce a clearer potential response to stimuli. Generally, it has been confirmed that about 20 trials are required for averaging to produce consistent results for P300 [15], but it is difficult to conduct 20 trials during the performance of actual tasks. As such, for the simple measurement of mental fatigue using P300, the evoked potential needs to be extracted with averaging over as few trials as possible.
This paper presents work that combined EEG frequency components and P300 components to perform linear discriminant analysis on EEG waveforms. Analysis was performed before and after a task that involved a mental load in order to study the number of trials required for averaging and the resulting discriminant accuracy. Furthermore, in order to confirm that the task had caused sufficient mental fatigue, subjective questionnaire surveys and studies of autonomic nervous activity indicators using electrocardiogram (EKG) analysis were also conducted at the same time.
2. Experimental method
The subjects were 10 young, healthy males (mean ± standard deviation: 21.7 ± 0.9 years) with no history of nervous system disorders. The experiment was thoroughly explained to subjects beforehand and their consent to participate was obtained. The experiment was approved (4/2017) by the ethics committee of Toyama Prefectural University.
With subjects seated, the experiment measured mental fatigue with EEG, electrooculogram (EOG), and EKG analyses as well as a subjective questionnaire survey using the Visual Analogue Scale (VAS). The VAS evaluation axis in this study placed “optimal sensation with no fatigue at all” (0%) at the left end and “lowest level of sensation with so much fatigue that I cannot do anything at all” (100%) at the right end [16]. The distance from the point marked by the subject on the evaluation axis to the 0% point on the left end was measured with a ruler, and the value was expressed as a percentage. Biosignals were recorded with a g.USBamp system (g.tec Medical Engineering GmbH, Austria). The time resolution was set to 1 kHz for the EKG and 512 Hz for the EEG and EOG. Based on the extended 10–20 system, electrodes were positioned at Cz and Pz with the GND at AFz and the reference electrode on the left ear lobe. Additionally, EOG electrodes were positioned above and below the left eye, while EKG measurements were taken with lead III positioned between the left leg and left hand.
The experimental protocol was as follows: after applying a mental load for 15 minutes, all signals to be measured were recorded continuously for 10 minutes. One of these trials constituted one set, and a total of 8 sets were performed (Figure 1). Below, results prior to measurements in the 1st set are labeled “Pre” and measurements in the 8th set are labeled “Post.” In this experiment, mental load was created with mental arithmetic problems. In these mental arithmetic problems, a pair of two-digit integers was shown on a display placed 0.8 m in front of the subject’s eye (Figure 2). The subject mentally calculated the sum of the first and second digit in each integer (in Figure 2, the results were 12 on the left and 8 on the right), then mentally calculated the units digit of the product of the two integers obtained in the previous step (in Figure 2, the answer was 6). The mental arithmetic problem involved the task of entering the resulting number with a keyboard, and this problem produced mental fatigue in the subject.
For bio signal recording, we conducted an oddball paradigm using visual stimuli and recorded EEG, EOG, and EKG data during that time. When the oddball paradigm in each set was complete, we also conducted a subjective questionnaire survey on fatigue using the VAS. In the oddball paradigms using visual stimuli, an “×” image was used as the infrequent stimulus and an “○” image as the frequent stimulus, with the images set to appear 30 times and 90 times, respectively. Both visual stimuli were displayed for 1 second at a time, and the display order was random. In experiments that use oddball paradigms, P300 detection accuracy is often increased by giving subjects prior instructions to calculate the number of times the infrequent stimulus appears. In this experiment, we instructed subjects to “Quickly press the Enter key when the infrequent stimulus is displayed”. To synchronize biosignals with the presentation of stimuli during the oddball paradigm, we synchronized biosignals with trigger signals by installing a photoresistor circuit in the stimulus display and sending external inputs to a biological amplifier.
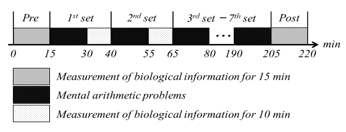 Figure 1: Experimental protocol.
 Figure 2: The typical content used in mental arithmetic problems
3. Analytical method
3.1. EKG analytical method
The R-R interval was extracted from the measured EKG time series data and an analysis was conducted using heart rate variability (HRV) [17]. With HRV, analyzing the R-R interval
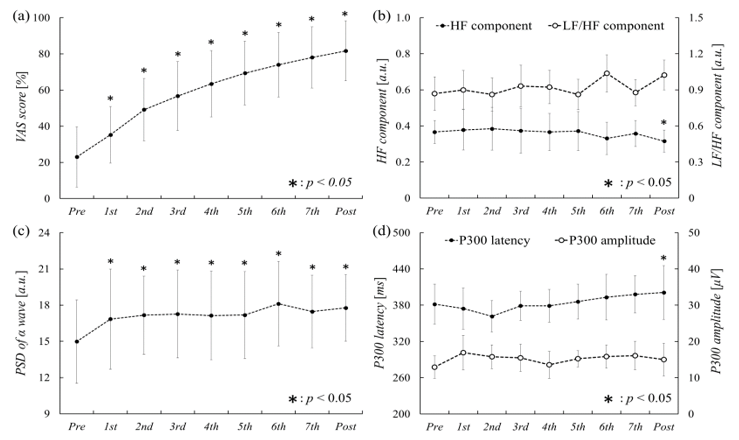 Figure 3: Results of measurement items (Average ± SD)
(a) VAS scores, (b) HF and LF/HF components, (c) PSD of the α wave, (d) The latency and amplitude of the P300 component.
(heart rate) from the time domain/frequency domain makes it possible to quantify sympathetic and parasympathetic nervous system indicators. The extracted R-R interval time series was resampled from a 256-point time series and a fast Fourier transform (FFT) was used to estimate the power spectral density (PSD). Using the PSDs of a low frequency component (LF) with a range of 0.04–0.15 Hz and a high-frequency component (HF) with a range of 0.15–0.4 Hz, this study calculated an LF/HF component and an HF component, which are considered indicators of sympathetic and vagal nervous activity, respectively.
3.2. EEG analytical method
Time series of 5 seconds before and after low-frequency stimulus presentation (a total of 10 seconds) were extracted from the measured EEG time series. After applying a 4–30 Hz bandpass filter to the extracted time series, eye blink artifacts were removed with the FastICA algorithm [18]. Then, data from 2.5 seconds before and after low-frequency stimulus presentation (a total of 5 seconds) were extracted from these time series and put through FFT processing. The PSD of the α bandwidth (8–13 Hz) in each time series and the average values from Cz and Pz were calculated to produce representative values for the sets.
Next, we will demonstrate how P300 was derived. Time series of 5 seconds before and after low-frequency stimulus presentation (a total of 10 seconds) were extracted. After applying a 1–5 Hz bandpass to the extracted time series, eye blink artifacts were removed with the FastICA algorithm. P300 was derived by first correcting the baseline using the average value from 0.25 seconds before and after low-frequency stimulus presentation in the time series and then averaging the waveforms after low-frequency stimulus presentation in each subject. Additionally, this study identified the positive peak that appeared at 280–500 ms as P300 and calculated its latency and amplitude. The average values for P300 latency and amplitude were calculated from both Cz and Pz, and the results were used as the representative values of the sets.
3.3. Linear discriminant analysis
Linear discriminant analysis was performed using the frequency component of the α bandwidth before and after a mental load task and the P300 component of the time series [19]. For the frequency component and P300 component, principal component analysis was used to perform dimensionality reduction, and feature points were extracted [20]. To prevent overfitting, we calculated all levels of accuracy when the number of components in the principal component analysis was changed in the range of 1–15, and the accuracy level in the scenario that reached the local maximum was set as the final discriminant accuracy.
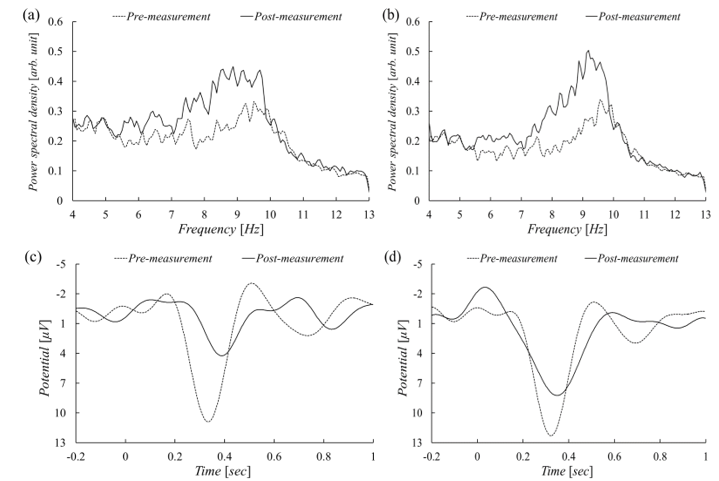 Figure 4: Typical waveform of the P300 and the power spectrum each channel.
a) Power spectrum at Cz, b) Power spectrum at Pz, c) P300 at Cz, d) P300 at Pz
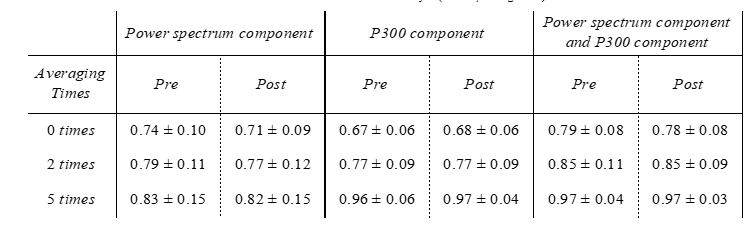
Table 1: Results of Linear Discriminant Analysis (F Value, Average ± SD)
The data used in discriminant analysis were manipulated in three different patterns: using the feature value of the frequency component alone, the feature value of the P300 component alone, and the feature value of the frequency component and P300 component combined. Then, leave-one-out cross-validation was used to calculate the accuracy before and after a mental load task [21]. In order to investigate whether mental fatigue can be estimated even when the P300 component is averaged over a small number of trials, this work used three different numbers of P300 component additions: 0 times, 2 times, and 5 times. Furthermore, the time series used in averaging were used in the order in which they were measured.
4. Results
Before performing a discriminant, analysis using EEG time series, a subjective questionnaire survey and a study of autonomic nervous analysis indicators using EKG analysis were also conducted in this experiment to confirm that enough mental fatigue had been produced. Figure 3 shows the changes over time in each measurement item. In the subjective questionnaire survey using the VAS, performing mental arithmetic increased the fatigue score (Figure 3a). As it was a subjective questionnaire survey, there was large variation in VAS scores between the subjects. While the average VAS score was about 20% in the Pre stage, it increased up to about 80% in the Post stage. The Pre results and subsequent measurement set results were compared using the Wilcoxon-signed rank sum test. The results showed that the average VAS score increased significantly in the subsequent measurement sets compared to the score in the Pre stage (p<0.05).
For the HF component, which was extracted using heart rate variability and is considered an indicator of vagal nervous activity, the average score was about 0.4 in the Pre stage and about 0.3 in the Post stage (Figure 3b). The Pre results and subsequent measurement set results were compared using the Wilcoxon-signed rank sum test. The results showed that the average HF component score decreased significantly in the Post measurement set compared to the score in the Pre stage (p < 0.05). Furthermore, for the LF/HF component, which is considered an indicator of sympathetic nervous activity, the average score was about 0.9 in the Pre stage and about 1.1 in the Post stage (Figure 3b). The Pre results and subsequent measurement set results were compared using the Wilcoxon-signed rank sum test. Results showed no significant difference in LF/HF components between the measurement sets.
For the α bandwidth PDS, the average score was about 15 in the Pre stage and about 18 in the Post stage (Figure 3c). The Pre results and subsequent measurement set results were compared using the Wilcoxon-signed rank sum test. The results showed that the average α bandwidth PDS score increased significantly in the subsequent measurement sets compared to the score in the Pre stage (p<0.05).
For P300 latency, the average score was about 380 ms in the Pre stage and about 400 ms in the Post stage (Figure 3d). The Pre results and subsequent measurement set results were compared using the Wilcoxon-signed rank sum test. The results showed that average P300 latency increased significantly in the Post stage compared to the Pre stage (p < 0.05). The average P300 amplitude was about 15 μV in both the Pre and Post stages (Figure 3d). The Pre results and subsequent measurement set results were compared using the Wilcoxon-signed rank sum test. Results showed no significant difference in P300 amplitude between any of the measurement sets.
The study presented in this paper performed linear discriminant analysis that combined the frequency component and P300 component to investigate whether mental fatigue can be estimated even when averaging is only performed over a small number of trials. Figure 4 shows a typical example of the frequency component and P300 component before and after a mental load task when averaging was performed over five trials. We observed that the frequency component on the α bandwidth tended to increase after mental fatigue compared to before mental fatigue (Figure 4a). Additionally, we observed that the P300 component latency tended to lengthen after mental fatigue compared to before mental fatigue (Figure 4b).
Linear discriminant analysis was performed using the frequency component of the α bandwidth before (Pre) and after (Post) a mental load task and the P300 component of the time series. Table 1 shows the accuracy results when averaging was performed over 0, 2, and 5 trials. With linear discriminant analysis, combining the frequency component and the P300 component increased discriminant accuracy for all numbers of trials. When averaging was performed for two trials, the discriminant accuracy was about 78% for the frequency component alone and 77% for the P300 component alone, while combining the frequency component and P300 component increased the accuracy to 85%. Additionally, when averaging was performed over five trials, the discriminant accuracy was about 83% for the frequency component alone and 96% for the P300 component alone, while combining the frequency component and P300 component increased the accuracy to 97%.
5. Discussion
The EEG frequency bands recorded when waking are categorized in theta waves (4–7 Hz), alpha waves (8–13 Hz), beta waves (14–30 Hz) [22]. In addition, frequency drops in the α-wave band occur during states of decreased alertness elicited when falling asleep [23]. However, while there are reports in which α-wave band power increases during mental fatigue [9, 10], there are also reports showing that it decreases as well [11, 12], and thus, there is no consistent trend. While evaluating mental fatigue using autonomic nervous activity alone leads to difficulties with interpretation, adding the P300 component makes it possible to evaluate fatigue based on two indicators: cognitive function and autonomic nervous activity. This study performed linear discriminant analysis that combined the EEG frequency component and the P300 component, an event-related potential, to investigate whether mental fatigue can be estimated even when averaging is only performed over a small number of trials. The results showed that, when the P300 component was averaged for five trials, discrimination with 97% accuracy was possible before and after a mental load task. Furthermore, even when averaged over two trials, combining the frequency component and the P300 component produced a discriminant accuracy of 85%. We believe that the technique proposed by this paper makes it possible to estimate mental fatigue even when an event-related potential is averaged over a small number of trials.
In order to confirm that enough mental fatigue had been produced by the mental load when estimating fatigue, subjective questionnaire surveys and studies of autonomic nervous activity indicators using EKG analysis were also conducted in the work presented here. The results showed that subjects complained of fatigue, and subjective fatigue according to the VAS score also increased significantly. Heart rate variability showed a significant decrease in the HF component after a mental load task. There are reports that fluctuation in the HF component may reflect mental load, and the results of this experiment provide more supporting evidence that this is the case. Based on this result, we believe that, in this experiment, subjects were more affected by mental load than physical load. Additionally, this paper presents results that confirmed an increase in the α bandwidth power after a mental load task, demonstrating the same patterns in changes to basic rhythms during mental fatigue caused by mental arithmetic that Trejo et al. reported [24]. In terms of P300, we confirmed prolonged latency after a mental load task, demonstrating the same trends in changes to P300 during mental fatigue caused by a driving simulation reported by Zhao et al. [25].
In this experiment, keys on the keyboard were only pressed for the low-frequency stimulus in an oddball paradigm where P300 was measured. As such, the possible influence of exercise-related potentials (for example, a decrease in the power of mu-rhythms around 10 Hz) should be investigated. Generally, C3 and C4 are considered the electrode positions most likely to detect exercise-related potentials due to hand motion. The electrode positions used in this experiment were Cz and Pz, and the key pressing was the same throughout all of the trials. Furthermore, we applied a 1–5 Hz bandpass filter during P300 signal processing, and we believe that hand motion had no effect on the results. However, P300 is a signal that tends to be drowned out by spontaneous brain waves. As spontaneous brain waves appear randomly, it has been proven that they will negate each other when averaged, allowing hidden P300 signals to appear. It has been confirmed that discriminant accuracy for P300 increases as the number of trials used for averaging is increased, meaning that the results in this paper are not accidental and can be reliably attributed to the appearance of P300. On the other hand, the linear discriminant analysis in this paper showed 97% accuracy of discriminant using only the P300 component with 5 times averaging process. This is a very high accuracy. However, in this experiment, it was a case of the accuracy where mental fatigue was given sufficiently, so in the future, we will examine the discrimination accuracy according to the degree of mental fatigue.
Lastly, the amplitude of P300 has been shown to depend on subjective probability and stimulus meaning in an additive manner, and the dimension of information transmission has a multiplicative effect on this [26]. As such, teaching data for machine learning needs to be recorded in advance, and it would take an enormous amount of time to reproduce mental fatigue in the manner discussed here. Transfer learning has been proposed as a method for shortening the process of securing the required teaching data [27]. Transfer learning is a technique in which training data from someone else is used for discriminating one’s own data. In the future, to improve discriminant accuracy, we will propose a supervised spatial filter that uses training data from others by assuming a similar spatial distribution in the EEG waveforms of different subjects during mental fatigue using transfer learning.
6. Conclusion
Cognitive deficits brought on by mental fatigue include decreased alertness, difficulty solving problems, and lowered situational awareness. There are claims that human error is related to the cognitive deficits associated with mental fatigue, and it is important to search for indicators that can evaluate the decreased cognitive function associated with mental fatigue. This paper presents a study, which performed linear discriminant analysis that combined the EEG frequency component and the P300 component, an event-related potential, to investigate whether mental fatigue can be estimated even when averaging is only performed over a small number of trials. Generally, it has been confirmed that about 20 trials are required to produce consistent results for P300, but the method proposed in this paper was able to achieve a discriminant accuracy of 97% before and after mental fatigue, even when P300 was only averaged over five trials. Moving forward, we will also investigate the detection of mental fatigue in real time during driving and actual tasks by using wearable EEG devices with dry electrodes that do not require the application of conductive paste.
- K. Fujita, F. Kinoshita, H. Touyama, “Detection of Cognitive Decline Due to Mental Fatigue Using Electroencephalogram” in 2018 IEEE SMC: Passive BCIs, Miyazaki, Japan, 2018.
- Japanese Society of Fatigue Science Clinical evaluation guidelines on designated health foods for physical fatigue in healthy people with no pathological fatigue, Journal of Clinical and Experimental Medicine, 228(6), pp.743-746, 2009.
- S. Tajima, K. Yamaguchi, H. Kuratsune, Y. Watanabe, “Measuring fatigue with physiological biomarkers” Adv. Anti. Aging. Med., 6(3), 329–334, 2010.
- Y. Tanaka, S. Wakida, “Biomarkers of stress and fatigue” J. Pharmacol. Sci., 137(4), 185–188, 2011.
- K. Hashimoto, “The physiological meaning of flicker values and issues measuring them: flicker test theory and the reality” Jpn. J. Ind. Health, 5(9), 563–578, 1963.
- K. Hashimoto, “Testing for mental fatigue” The Japanese Journal of Ergonomics, 17(3), 107–113, 1981.
- M. Yamaguchi, T. Kanemori, M. Kanemaru, Y. Mizuno, H. Yoshida, “Can salivary amylase be an indicator for estimating stress?” Japanese Journal of Medical Electronics and Biological Engineering, 39(3), 234–239, 2001.
- K. Nomura: The relationship between performance on mental arithmetic tasks and physiological stress responses, Journal of Osaka University of Economics, 68(5), p133-143, 2018.
- M. Yamazaki, M. Matsuura, “Adult and elderly electroencephalograms”, Japanese Journal of Clinical Neurophysiology, 42(6), 387–392, 2014.
- The Japanese Society of Sleep Research Computer Committee, ed.: “PSG chart for learning: Interpretation method and explanation of sleep polygraph records,” The Japanese Society of Sleep Research, 1999.
- L. J. Trejo, K. Kubitz, R. Rosipal, R. L. Kochavi, L. D. Montgomery, “EEG-based estimation and classification of mental fatigue,” Psychology, 6(5), 572–589, 2015.
- M. Ishibashi, T. Yoshida, “The relationship between brain wave fluctuation and reaction times with the decrease in arousal level,” Ergonomics, 36(5), 229–237, 2000.
- N. Okamura, “How the event-related potential P300 is affected by mental fatigue caused by calculation tasks performed for a long period of time” J. Occup. Health, 49(5), 203–208, 2007.
- T.W. Picton, S.A. Hillyard, “Human auditory evoked potentials. II. Effects of attention” Electroen. Clin. Neuro., 36(2), 191–200, 1974.
- J. H. Cohen, J. Polich, “On the number of trials needed for P300” Int. J. Psychophysiol, 25(3), 249–55, 1997.
- M. E. Wewers, N. K. Lowe, “A critical review of visual analogue scales in the measurement of clinical phenomena” Res. Nurs. Health, 13(4), 227–236, 1990.
- M. Malik, A.J. Camm, “Components of heart rate variability: what they really mean and what we really measure” Am. J. Cardiol.,72(11), 821–822, 1993
- A. Hyvarinen, “Fast and Robust Fied-Point Algorithms for Independent Component Analysis” IEEE T. Neural Networ., 10(3), 626–634, 1999.
- S. Mika, G. Rätsch, J. Weston, B. Schölkopf, K. Müller, “Fisher Discriminant Analysis With Kernels” Neural Networks for Signal Processing IX: Proceedings of the 1999 IEEE Signal Processing Society Workshop, 1999.
- K. Fukui, “Past and Present of Subspace Method: Latest Technology Trend: Theoretical Extensions and their Applications” Information Processing Society of Japan, 49(6), 680–685, 2008.
- V. N. Vapnik, Statistical Learning Theory, Wiley-Interscience, 1998.
- H. Watanabe, Y. Koike, N. Sakurai, A. Takahashi, H. Iguchi, “Analysis of electroencephalogram fluctuations during mental work: mental arithmetic, inversion and association loading,” Japanese Journal of Electroencephalography and Electromyography, 19, 253–263, 1991.
- M. Osaka, “Effects of mental work and alpha wave peak frequency-associated task difficulty,” Japanese Journal of Electroencephalography and Electromyography, 11, 248–254, 1983.
- L. J. Trejo, K. Kubitz, R. Rosipal, R. L. Kochavi, L. D. Montgomery, “EEG-Based Estimation and Classification of Mental Fatigue” Psychology, 6(5), 572–589, 2015.
- C. Zhao, M. Zhao, J. Liu, C. Zheng, “Electroencephalogram and electrocardiograph assessment of mental fatigue in a driving simulator” Accident Anal. Prev., 45, 83–90, 2012.
- H. Shinji, W. Yuki, F. Isato, “On the number of averaged electroencephalography epochs for correct detection with a new multiple probe protocol for P300-based concealed information tests” Journal of the Faculty of Human Cultures and Sciences of Fukuyama University, 14, 99–106, 2014.
- K. Simonyan, A. Zisserman, “Very Deep Convolutional Networks for Large-Scale Image Recognition” in 2015 ICLR: Computer Vision and Pattern Recognition, 2015.