Q2 YouTube: Quantitative and Qualitative Information Analysis based Influencer-aware YouTube Channel Ranking Scheme
Volume 4, Issue 6, Page No 01-09, 2019
Author’s Name: Ji Hyeon Lee1, Hayoung Oh2,a)
View Affiliations
1Ajou University, Department of English Language and Literature, Suwon, Korea
2Ajou University, DASAN University College, Suwon, Korea
a)Author to whom correspondence should be addressed. E-mail: hyoh79@gmail.com
Adv. Sci. Technol. Eng. Syst. J. 4(6), 01-09 (2019); ![]() DOI: 10.25046/aj040601
DOI: 10.25046/aj040601
Keywords: Quality aware YouTube, Ranking scheme, Flipped learning maximization, Influencer Analysis, Data analysis

Export Citations
With the development of big data, artificial intelligence and deep learning, various social information networks are becoming exponentially intelligent. Of all the various social networks, YouTube is so popular that it is called the YouTube era. Not only video viewers, but also actual video producers, influencer youtubers, are increasing, allowing individuals as well as operators to use and market contents on various topics. As the number of users and contents increases, the choice of information increases, but it is more difficult for individual and business owners to select information that meets their needs. Therefore, this study aims to analyze the channel of the subject that the user needs from various angles and provide the ranking of the channel to individuals and businesses. We crawl the channels and measure the average awareness and influencer youtuber of channels and channel videos by analyzing the qualitative data of quantitative data and comments which are statistical information. As a final case study, we recommend the English learning channel to individual users based on numerical data statistics and emotional analysis results to show the maximum of flipped learning effect regardless of time and space. Plus, we prove the maximum of the effectiveness of marketing by influencer channel which is influential to operators in the medium and long term.
Received: 14 June 2019, Accepted: 08 October 2019, Published Online: 20 November 2019
1. Introduction
There are about 3.4 billion people using social media (SNS) among 7.6 billion people worldwide. Compared with the year 2018, about 280 million people started the SNS within a year. Especially with the development of big data, artificial intelligence and deep learning, various social information networks are becoming exponentially intelligent. One of them, YouTube is the most famous social platform for satisfying various objects such as users as well as businesses on top of the recommender system. However, as the development of technology and the emergence of big data have caused the exponential growth of YouTube channels, users are having difficulties in selecting personalized videos. In other words, users have difficulty in selecting a channel on top of the basic recommendation of YouTube, and they spend additional time searching for a good channel or comparing contents directly [1]–[4]. In aspects of the business operator, the new influencer marketing on top of YouTube data analysis is also emerging as a new and successful marketing strategy. Influencers are influential individuals, which can include the general public as well as entertainers and SNS stars. Using the recommedation on top of the influencer aware YouTube data analysis, the general public can easily consume the contents and at the same time be satisfied with the content.
As the application case studies based on influencer aware YouTube data analysis, in this paper we introduce the possibility of the flipped learning maximization of user education as well as business marketing satisfaction.
Regardless of age, interest in lifelong education has increased in various fields such as English and Chinese, and various contents based on smartphone such as internet lecture, radio, and learning application are attracting attention. As the number of smartphone users increases, demand for online content is growing more than offline. However, since the above-mentioned online service requires the motivation of the user to voluntarily learn, the more the time passes, the less motivated and the less interested in learning.
The popularity of the YouTube-based beyond time and space learning is increasing due to the characteristics of these online learners. Internet lectures are similar to flipping learning in pedagogy, which is not an existing concept of ’off-line class’, but can be learned anytime and anywhere by transcending time and space. In particular, Youtube provides big data that can be analyzed statistically of videos that are composed by influencer Youtuber in a free environment and have lots of choices in social network, so it can maximize the effect of flipped learning education. In other words, influencer aware YouTube video ranking based education does not require as much concentration as text-oriented education, and users can use it for free time very effectively. In particular, influencer aware YouTube video ranking based online education can maximize the effectiveness of education because it shows the candid reviews of ordinary users and the cases that are natural but helpful in real life on top of big data analysis quantitatively and qualitatively. Similar to the general online education methodologies, the influencer YouTube aware flipped learning education can solve the physical limitations and anyone can be educated in real time or streaming (pre-recorded streaming).
In aspects of the business operators, influencer aware YouTube data analysis based the marketing has become a new and solid strategy. As of February 2017, people spent 25.7 billion minutes on YouTube, a video platform. This shows that YouTube spending time has more than tripled in the past two years compared to 2015. In other words, research in video and photo-based YouTube influencers analysis techniques is critical in aspects of users and businesses, as it indicates that people are more interested in video content than text content over time. Specifically, if the business operators recommend the personalized video to the users by referring the features of influencer YouTuber with high quantitative and qualitative data analysis, the satisfactions of the users as well as businesses can be maximized. Different from the previous related schemes of YouTube big data anlysis, we consider velocity, veracity(Truth), value as well as volume and variety among five characteristics of big data.
As a result, in this paper, we propose an influencer aware YouTube ranking scheme for the channel recommendation technique to maximize the satisfaction of users as well as the businesses. As mentioned before, we show the flipped learning effect through explicit and implicit analysis of various data of the influencer provided by YouTube centering on the YouTube English learning channel. Based on numerical data such as the number of views and likes of channels collected by using Google and R’s tuber package for four channels with the same ranking of the social channel. The primary statistic is given and those of positive and negative are calculated through emotional analysis of the comment. Finally, based on the numerical data statistics and emotional analysis results, the English learning channel is recommended to the user to maximize the flipped learning effect and the business satisfaction regardless of time and space. In future, the proposed method can be used for flipped learning of various contents because it can be used for analysis of big data of influencer aware YouTube channel in various fields as well as language field.
2. Related Work
Recently, in an environment where big data has grown exponentially, personalized recommendations are a great way to efficiently search for information and discover content with high satisfaction.
2.1. Recommender system
Based on how designing recommender systems, the recommendation systems are usually classified into the following categories [5]–[8]: Collaborative recommendation systems; Content-based recommendation systems; and Hybrid recommendation systems.
Collaborative filtering is currently the most wise and popular approach because of focusing more on rating-based recommendations. The collaborative methods predict the utility, preference or taste of items per a particular user using the items previously rated by other users as shown in figure 1.
On the other hand, content-based approaches are generally based on classical information retrieval such as keywords as content descriptors. Therefore, the content-based methods are very popular for recommending documents, news articles or web pages. Lastly, the hybrid systems [9, 10] is to combine two or more different approaches to maximize desirable properties.
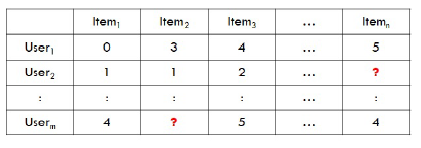 Figure 1: Collaborative recommendation systems
2.2. Social Network aware Recommender system
Youtube, which efficiently provides dynamic data such as video among various contents, is gaining popularity around the world. Although a basic recommendation system on the YouTube platform is installed to recommend high-profile videos, personal satisfaction is not high. Three factors can be used to determine ranking of recommendation systems. These are each of video quality, user specificity and diversity. The quality of the video includes quantitative information such as views, comments, favorites, upload time, and so on. User specificity is related to individual taste and preference. The way to check this is to consider the number of views or watch time of the watch record. Thereafter, in order to maintain the diversity of the video, there is a method of limiting the number of videos of the same channel [11]. In [12], the authors designed the recommendation system in consideration of the factors. In [13]–[16], different studies have attempted to verify the significance of influencer decision through R-based data analysis rather than heuristic judgment. In this case, the data commonly used are nine characteristics (i.e., features) such as total number of views of the channel, number of videos of the channel, average number of videos views of the channel, number of channel subscribers, likes and dislikes of each video. In [13], the authors tried to normalize covariance of each variable and analyzed the correlation between each variable with views of the subordination variable. Plus, they proved that the average number of views on the channel and the number of subscribers on the channel had a positive relationship with the number of views. However, the degree of correlation was insufficient, and the statistical data alone have limitations in producing significant results, such as the determination of video recognition, etc. In [14], the authors first focused on the influencer YouTube data analysis with accompanying the 50 channels made using the blind date app ’swipe’. With the data, the release date of the video, likes , dislikes, the number, video length, hash tag count, total number of views of channels, number of videos of channels, average number of video views of channels, number of channel subscribers were analyzed as variables, and Principal Component Analysis and Multiple Regression Analysis were performed as well as R-based data analysis. The cumulative contribution rate of PCA1 and PCA2 was more than 80% of the total to compared these two factors to determine the importance of each variable. For the first component, the average number of views on the channel, comments on swipe videos, views on swipe videos, and likes of videos were -1.25, -2.6, -2.49, and -2.83, respectively, showing a strong negative value, while the video length of swipe video and the hashtags of swipe video were 3.31 and 1.95, respectively, showing a strong positive value. The second component showed a negative value with the number of views and video subscribers, and a weak positive value with the length of the video and tag count. In addition, author concluded that the number of videos of the channel is most influential on the influencer attribute decision model among the variables when the two components are judged synthetically. In Multiple Regression Analysis, only the number of videos reveals significance. However, the limitation of the Principal Component Analysis was that the differences among the variables were large, and for Multiple Regression Analysis, there is a mismatch with the Principal Component Analysis results, therefore the study also has a limit. In [15], the authors analyzed the comment of each video with time to demonstrate the continuing influence of YouTube Influencer. The group is classified as ”Large group” and ”Small group” based on the total number of comments. In the case of ”Large group”, the number of comments per an hour is similar and the decreasing width is constant over time. In the case of ”small group” is assumed that the number of comments per an hour is irregular, and that the decreasing width is not constant over time. Accordingly, the paper selected the ”Big3” of the group and used the decreasing width and consistency obtained through the existing ”Large group” and ”Small group” as an evaluation indicator. In the case of decreasing width, the smallest percentage was 3% and the largest percentage 2%. For consistency, the standard deviation was used, and the results were derived that the standard deviation of the ”Large group” was relatively small compared to the standard deviation of the ”Small group.” This has proven that ”Large group”’s influencer continues to receive people’s attention in a stable manner. However, the limitations still exist because of the lack of connectivity with the recommendation system of YouTube through high-profile video analysis.
In [16], the authors proposed the importance of the analysis of the comments quantified through the questionnaire and suggested the link between the analysis of the comments and the generation of profits. According to the survey, 12 percent of users post their opinions on a regular basis, which means about 96 million people are actively writing their opinions, considering the size of the YouTube community is estimated at 800 million. Also, 34 % of the respondent of investigation read comments frequently and read comments 2-3 times after watching 53 % of the video. In the case of comments, those received a lot of likes if those were reasonable, practical and content-customized, and eventually showed that it could be used to increase the popularity of the videos and make profits. However, the existing study also has limitations due to the lack of connectivity with the recommendation system of YouTube through high-profile video analysis, and there is a limit to analyzing human contradictory behavior. In [17] the authors used YouTube comment analysis, TF-IDF (term frequency inverse document frequency) and Association Rule Analysis to select influencers. Comment analysis used the B-rated YouTube channel when searching for ”English study”, ”English education” and ”English learn” on the social blades that provide the YouTube ranking system. The comparison of TF (Terminal Frequency) and TF-IDF analysis then demonstrated that the TF-IDF analysis elicited more significant words. For example, when word analysis was conducted with the frequency of words (TF), common words related to learning such as ”learn” and ”lesson” or words that had nothing to do with the video content such as ”love,” ”video” and ”channel” were heavily weighted. In contrast, for TF-IDF analysis, words related to video content such as ”resort,” ”plan,” ”proposal,” ”vegan,” and ”vegetarian” are expected to be talking about travel first and vegetarian second. Compared to TF analysis, TF-IDF extracts features of each video content and shows them well. Finally, the association among words was analyzed through the Association Rule Analysis. As a result of the Association Rule Analysis, the authors can see that words with high TF are generally generated as rules. In case of using TF-IDF, there is a limit to judge the association among words heuristically. In the case of Association Rule Analysis, the rules are generated based on the frequency of words in general, so that only meaningless words are repeated in the YouTube environment. However, the paper is considered to provide a cornerstone of the proposed technique because it found that the two methods can be only applied to select the influencers. Recommender systems of [18] collects information about users and businesses and how they are related. The recommender systems let users share their reviews about products, places, establishments or services. If a product receives more votes or reviews, it becomes more popular among customers.
It is expected that higher number of positive reviews is beneficial for marketing’s success of the product. Interactions based on user’s followers are usually allowed by recommender systems. A user is considered a fan of another user when there’s no personal relationship between them but still the former wants to see the latter’s posts in his or her own main page. This type of social link is based on interests and affinities with celebrities, special products, places or common interests. When a review is posted, it is seen by the submitter’s friends and followers, increasing its chances of readings about the reviewed product or place. The more social links a user has, the more persons will likely read the review. This social component has become an interesting aspect of recommender systems because it allows an increase of popularity of a product or place. In the case of the recommendation system mentioned in the thesis, the user-to-user social network is formed through the follow, and is also distinguished by the user-user fan through the interaction relationship. In general, reviews by users with many social networks (users with many fans) are more likely to be accessed by more users. These characteristics are an interesting part of the recommendation system, and many businesses approach these users for satisfaction. This proves that the existing research direction of recommending to companies for profit generation is reasonable. The current model excludes text analysis, but acknowledges that the analysis of comments exerts an influence on Influencer’s numerical data.
3. System Model
The data used for the proposed scheme was based on 54 channels of influence, which produced promotional videos on the “Enligh Education” related channel. The videos are easy to use influencer attribute analysis because general public influencer can directly produce video and observe other users’ reactions in various formats such as numerical information and comments on YouTube. YouTube’s visible numerical data shows the date of creation of each video, likes, dislikes, length of the videos, number of hash tags, total number of views on the channel, the number of videos on channel, average number of views on the channel’s video, and number of channel subscribers. The primary analysis of suggested techniques is to look at their correlation using various numerical data provided on YouTube quantitatively. At this time, the set hypothesis is that ”if the correlation of each numerical data is high, can it be judged unconditionally that the recognition of the corresponding video is high?” In general, it is easy for general users to judge the quality of channel and video by trusting only the numerical data based ranking system of YouTube. However, since the average number of views of a channel is increased with only single click of a YouTube video, the actual playback time is unknown, such as whether the user actually viewed the videos, which parts of the videos were particularly popular, or whether they stayed for a certain period of time, rather than simply clicking them. In addition, YouTube does not provide access to statistics and visualization information (e.g., demographics information) of the audience, such as age, gender, etc., which videos are usually viewed highly by which user class. Therefore, we simultaneously analyze influencer YouTube data quantitatively and qualitatively as shown in figure 2
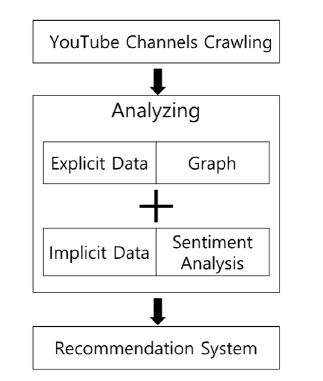 Figure 2: Recommendation System analysis flowchart
In detail, the English learning channels corresponding to B level, which is the self-rating of the social blade, were filtered based on the influencer criteria of the social network data. Those are the number of subscribers, English learning channels, which have a much higher number of views and likes, generally have a higher level awareness of videos as well as the number of videos with the long days of channel opening. We chose channels that were opened between 2016 and 2018 to allow for the latest videos of channel. The YouTube channel has its own concept, and English learning channels are largely divided into lecture type and talker type. One of the reasons that users prefer YouTube over Internet lectures is because they can learn English through content that is not formal and has a free atmosphere. Therefore, focusing on the talker-type channel except for the lecture type, we conducted research on ETK English, Interactive English, JForrest English and Real English With Real Teachers.
The study method used the statistical analysis software R tuber package. There are research [10] that used the chrome extension tool SelectorGadget. However, due to the limitations of the crawlable area due to the manual selection of the user and lack of real time property, considering the characteristics of R in which various packages exist, a tuber package for YouTube is used. We crawled the data on YouTube and explicitly extracted a statistical graph for the primary numerical social network data. Afterwards, we crawled the comment big data for each video on each channel through the package for YouTube data access only and the Google open API, and performed the YouTube data qualitative analysis.
The overall research process is shown in figure 2 After crawling YouTube channel data in the Tuber package, we set up different research methods for each data type quantitatively and qualitatively. The social numeric data such as the number of likes and subscribers extracts the graph based on the mutual relationship and applies the qualitative approach through the emotional analysis to the comment data in which the opinions of actual users are reflected on the channel.
4. Proposed scheme
4.1 Research technique
YouTube provides statistics on channel and channel video. In this study, channel information and channel video information are distinguished from each other because channel and channel video are different. We use the number of subscribers to measure channel itself awareness. The recognition of channel videos is based on qualitative data analysis using comment data analysis as well as quantitative data such as number of views, likes, and comments. Therefore, the recognition of one channel, that is, the number of subscribers, is not popular and highly rated. After analyzing the quantitative and qualitative data of the channel and the channel video, the channels are ranked by synthesizing them.
4.1.1 Crawling
After selecting the influencer channels to be ranked, call the channel ID from the YouTube url address as follows and use the R tuber package to crawl the statistical information like followings. https://www.youtube.com/channel/ (Channel ID). When we enter the YouTube channel main screen, the above url address is generated, and the last part is the channel ID. The channel information is coded by entering the channel ID into the get channel stats function of the tuber package.
The yt search function calls up the video list of the channel, and the video statistics information is also retrieved using the ID of each video in the same manner as above. In order to organize the crawled statistical information by video and channel, the title and channel name are added to the same row and stored as a data frame. Each channel is refined in the same manner as described above, and then organized into one data frame. Then, column names such as ”Title”, ”Likes”, ”Views”, ”Subscriptions”, ”Channel” The video title defines character type, number of likes, number of views, number of subscribers as integer type, and channel name as factor type. The comment data corresponding to the qualitative data also uses the tuber package. A comment on the video is called up to generate a comment data frame for each channel, which consists of a comment and an video ID in one row. This identifies channel names as well as quantitative data.
4.1.2 Quantitative Data Analysis
The results of quantitative data analysis are graphically displayed for visualization. Quantitative data is a measure of channel awareness and channel video awareness, and uses statistics provided by YouTube. The awareness of the channel is the number of subscribers, and the video recognition per channel is confirmed by the number of views, likes, and comments. Since the number of subscribers and the number of comments are fixed, they can be displayed as a bar graph. The reason why the number of comments in a video is classified as a fixed value is because the comment does not need to consider the deviation for each video fairly. Since the number of comments is a measure of how much viewers are interested in the channel, we consider only fixed values equally. On the other hand, the number of views and likes are taken into account for distribution and the deviation is taken into account by video.
4.1.3 Qualitative data analysis
In this study, the comment data is analyzed at the same time as the statistical data provided by YouTube. Likes, in addition to the number of subscribers, we can rate those channels and videos with the feedback from people who actually watched the video. It is difficult to judge that the number of views is high because it can be climbed even if the user clicks the video once even if the viewer does not watch the video to the end. On the contrary, it is possible to determine whether the video is good or not by checking whether the user has stayed in the video for a longer time, that is, whether the video has been watched until the end. Comments on video, except spam, are mainly left after watching video, mainly video related content. The higher the ratio of the result, the comment and the video content match, the more the commenter will see the video. Therefore, the comment analysis can be used to determine whether the video is suitable for ranking highly. To understand the correlation between video and comment, we invoke video script and comment file and refine data. Sort videos and comment data classified by corpus by frequency. Then, the comment data is compared with the video data, and the matching word is denoted by 1, and the non-matching word is denoted by 0. Scoring function is used to score differently for each frequency, divided by the total number of corpus and expressed as a ratio.
That is, the proposed scheme used Term Frequency (TF) to measure the frequency of each video based on script and comments. If the comment data matches the script, a list of the words is generated. The more words and duplicates in scripts and comments, the more the subject and content match. As the number of words in the list increases, it means that the viewer has a high degree of understanding and understanding of the video. Therefore, the video is recommendable to other users with the increasing recommendation reliability by weighting the degree of correspondence between video and comment. The response of the viewer, that is, the content of the comment, becomes the criteria.
The proposed scheme also consider Inverse Document Frequency (IDF) for TF-IDF (Term Frequency-Inverse Document Frequency). The TF-IDF (Term Frequency-Inverse Document Frequency) is often used for keyword extraction and similarity between documents. The higher the value of the TF indicating the appearance frequency of a word, the higher the importance of the word is, but it is not an absolute measurement method. It is more likely that the word is often used in other documents, and the frequency and importance are inversely proportional. Thus, in many document clusters, we multiply the frequency of occurrence of the word IDF with TF to assign weights to the only frequently appearing words in a particular document. Therefore, we also considered TF-IDF per each channel video for the proposed scheme.
4.1.4 Normalization
Since quantitative data and qualitative data analysis can not be accessed from the same point of view, we use a normalization function. As shown in figure 3, we use the normalization function to integrate the quantitative and qualitative data analysis of each channel to provide the final channel ranking. As shown in figure 3, the reasons for putting the weight on the 20th word list are as follows. As a result of checking the list of words based on the experimental data, word matching ratios up to 20th were distributed on average regardless of the total number of words, and other words showed the same or subtle differences. Therefore, based on the TF-IDF, weights are assigned to the words from the first to the 20th.
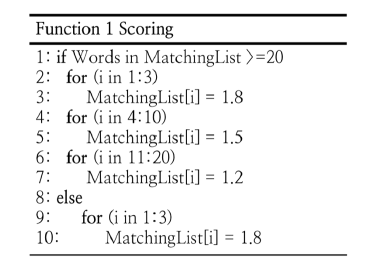 Figure 3: Normalization scoring function to integrate the quantitative and qualitative data analysis of each channel
The detailed rules for weighting criteria are as follows. The numbers 1 and 0 are assigned to the words that match each other. Since we place weight on words with a high percentage of match between video and comment content, they should be basically higher than the number 1 already granted. Therefore, based on various experiments as shown in figure
4, we have weighed the combinations of various numbers from 1.1 to 2 and confirmed the number that best matches the existing match ratio.
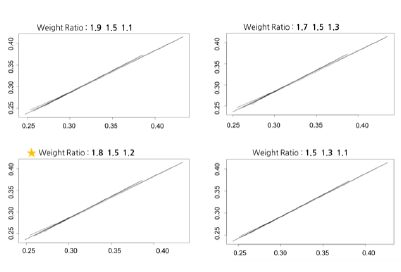 Figure 4: Weight ratio
4.2. Experiment Data
All the performance evaluation codes were written in the R environment suitable for data analysis, and the influencer channels with the subject of English learning were selected as the experimental subject. Four English language channels
(English Coach, Interactive English, JForrest English, and Real English with Real Teachers) were selected based on the ratings of social blades that provide social rankings. In order to experiment with the channels that can be compared, we chose channels that can be compared with each other considering the channel information such as the total number of views, the number of subscribers, etc., except for the old channel. Quantitative data and qualitative data were analyzed for each channel. First, quantitative data analysis results are shown in figures figure 5–8.
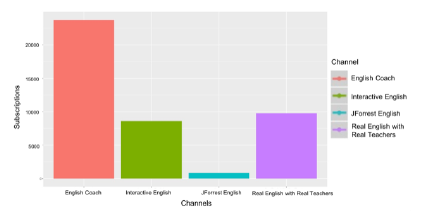 Figure 5: # of subscriber per channel
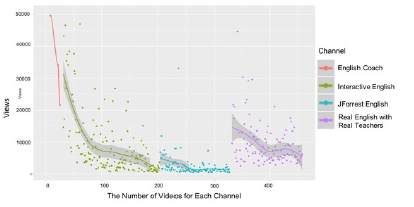 Figure 6: # of video views per channel
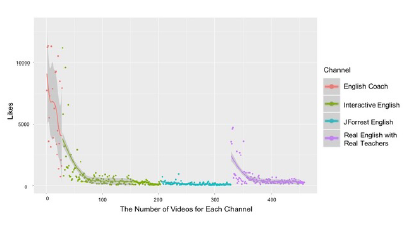 Figure 7: # of video likes per channel
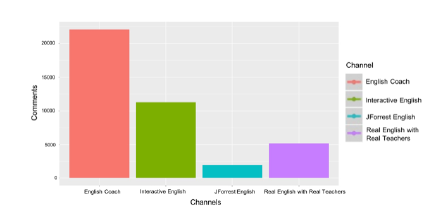 Figure 8: # of video comments per channel
Figure 9 and 10 show additional result graphs when considering different video data sets on the same channel.
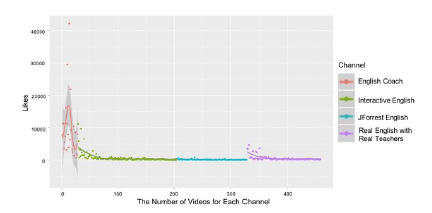 Figure 9: # of video likes per channel
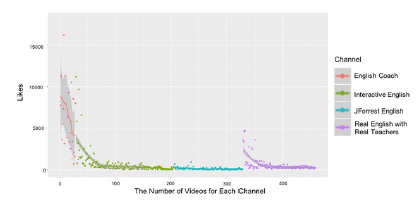 Figure 10: # of video likes per channel
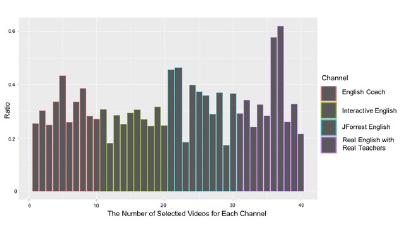 Figure 11: Correlation between video and comments per channel (i.e., Graph Analysis)
The above analyzes are different from each other of x coordinates because the fixed value graph and the distribution graph are mixed. To compare each graph, the analysis standard should be unified. As a result, all analysis results were adjusted through the normalization formula to integrate quantitative and qualitative data.
Figures 12, 13, 14 and 15 show cases where the quantitative data is normalized and re-expressed. Finally, considering both quantitative and qualitative information, it can be expressed as shown in figure 16. As the graph of quantitative and qualitative integrated normalization can be seen, satisfaction with other users can be increased at recommendation (ranking) when video is recommended considering qualitative data at the same time than when considering only quantitative data. Since the user actually watches the video for a long time and has a high probability of making a comment based on the contents of the video. In other words, the proposed scheme is more meaningful than the previous studies, the explicit analysis using the social network data alone, because it does not know the recognition of the video implicitly.
In addition, we found that the recommended videos of the proposed scheme were tracked for a certain period of time based on the same criteria. As a result, the amount of quantitative information such as the number of likes, comments, likes, and subscribers were increases and the quality correlation between video contents and comments was much higher, the performance was better than the existing methods.
In aspects of the business operators, their marketing strategies based on influencer YouTube data analysis were more successful than traditional approaches. Since the number of users and consistency degree between the contents and comments on top of big data analysis quantitatively and qualitatively were more higher with the trace analysis regardless of the time and space.
 Figure 12: (Normalization) # of subscriber per channel
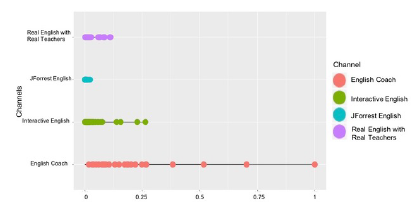 Figure 13: (Normalization) # of video likes per channel
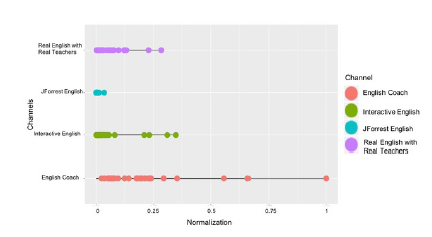 Figure 14: (Normalization) # of video views per channel
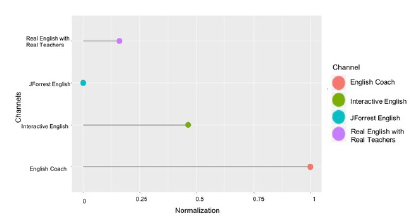 Figure 15: (Normalization) # of video comments per channel
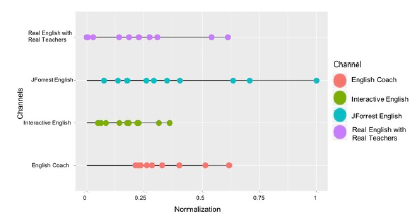 Figure 16: (Normalization) Correlation between video and comments per channel
5. Conclusion
With the development of social networks and wired and wireless networks, global users are constantly using YouTube, a huge platform from multiple angles. Although it provides a basic personalized ranking system in YouTube, it is based on simple statistical information. Therefore, it does not support sophisticated ranking and recommendation system by utilizing hidden secret information qualitatively at the same time.
In this study, we utilize two factors at the same time, and in Figure 13: (Normalization) # of video likes per channel particular, we prove that not only highly visible channels but videos are visible. This study is very meaningful because it can recommend the personalized recommendation system and the customized learning channel to the user in the future, and it can lay the cornerstone to lead to the application field that maximizes the flipped learning effect regardless of time and space as well as novel marketing strategy to the business operator.
Figure 15: (Normalization) # of video comments per channel
Conflict of Interest
The authors declare no conflict of interest.
Acknowledgment
This research was supported by the MIST(Ministry of Science and ICT), Korea, under the Na-Figure 14: (Normalization) # of video views per channel tional Program for Excellence in SW supervised by the IITP(Institute for Information & communications Technology Promotion)”(20150009080031001), Basic Science Research Program through the National Research Foundation of Korea(NRF) funded by the Ministry of Education(2017R1D1A1B03035557) and Ajou University.
- E. C¸ ano, M. Morisio, “Hybrid Recommender Systems: A Systematic Lit- erature Review” Intelligent Data Analysis, vol. 21, no. 6, pp. 1487-1524, 2017. https://arxiv.org/abs/1901.03888
- A. M. Elkahky, Y. Song, and X. He, “A multi-view deep learn- ing approach for cross domain user modeling in recommenda- tion systems” In Proceedings of the 24th International Confer- ence on World Wide Web, New York, NY, USA, 2015. ACM.
https://doi.org/10.1145/2736277.2741667 - K.J. Oh, W.J. Lee, C.G. Lim, H.J. Choi, “Personalized news recom- mendation using classified keywords to capture user preference” 16th International Conference on Advanced Communication Technology. https://doi.org/10.1109/ICACT.2014.6779166
- P. Chiliguano, G. Fazekas, “Hybrid music recommender using content-based and social information” 2016 IEEE International Conference on Acoustics, Speech and Signal Processing (ICASSP). https://doi.org/10.1109/ICASSP.2016.7472151
- I. Munemasa, Y. Tomomatsu, K. Hayashi, T. Takagi, “Deep reinforce- ment learning for recommender systems” 2018 International Con- ference on Information and Communications Technology (ICOIACT). https://doi.org/10.1109/ICOIACT.2018.8350761
- X. Amatriain, L. Gatos, “Building industrial-scale real-world recom- mender systems” RecSys ’12 Proceedings of the sixth ACM conference on Recommender systems. https://doi.org/10.1145/2365952.2365958
- J. Carbonell and J. Goldstein. ”Diversity-based Reranking for Re- ordering Documents and Producing Summaries” In Conference on Research and Development in Information Retreival (SIGIR), 1998. http://doi.acm.org/10.1145/290941.291025
- L. Chen, G. Zhang, and H. Zhou. ”Improving the Diversity of Top-N Recommendation via Determinantal Point Process” In Large Scale Rec- ommendation Systems Workshop at the Conference on Recommender Systems (RecSys), 2017. http://arxiv.org/abs/1709.05135
- Y. Koren, R. Bell, and C. Volinsky. ”Matrix Factorization Techniques for Recommender Systems” Computer 42, 8 (2009), 30–37. http:
//dx.doi.org/10.1109/MC.2009.263 - N. Lathia, S. Hailes, L. Capra, and X. ”Temporal Diver- sity in Recommender Systems” In Conference on Research and Development in Information Retreival (SIGIR), 2010. http://doi.acm.org/10.1145/1835449.1835486
- Young Il Chang, Jung You-Soo, “A Study on YouTube Product Review Channel Subscribers’ Product Attitude Formation Process,” e-business research, 20(2), 78, 2019.
- James Davidson, Benjamin Liebald, Junning Liu, Palash Nandy and Taylor Van Vleet, “The YouTube Video Recommendation System” in Proceedings of the fourth ACM conference on Recommender systems Pages 293-296, 2010.
- Minwoo Kim, JeongRyeon Park, Jiwon Park and Hayoung Oh, “Channel Attribute Analysis Scheme for Trustworthy Youtube Influencer Detec- tion”, in Proceeding of The 29th Joint Conference on Communications and Information on Big Data and Social Network, 2019.
- Minwoo Kim, JeongRyeon Park, Jiwon Park and Hayoung Oh, “In- fluencer Attribute Decision-Making based on Principal Component Analysis” in Proceeding of KIPS Conference on Web Science, Korea, pp 672-674, 2019.
- Ji-Won Park, Min-Woo Kim, Jeong-Ryeon Park and Hayoung Oh, “Sta- ble Influencer Selection Criteria Scheme through Youtube Analysis of Hourly Comments” ” in Proceeding of Korea Institute of Next Genera- tion Coputing, 2019.
- JeongRyeon Park, Minwoo Kim, Jiwon Park, Hayoung Oh “Influencer Identification based on TF-IDF and association rule analysis” in Pro- ceeding of KIPS Conference on information system, Korea, pp 293-295, 2019.
- Peter Schultes, Verena Dorner, and Franz Lehner, “Leave a Comment! An In-Depth Analysis of User Comments on YouTube” in Proceeding Wirtschaftsinformatik Proceedings 2013. 42, pp659-673, 2013.
- Andres Bejarano, Agrima Jindal, Bharat Bhargava ”Measuring user’s influence in the Yelp recommender system” in Poceeding of PSU
Reasearch review, Vol. 1 No. 2, pp. 91-104, 2017.
Citations by Dimensions
Citations by PlumX
Google Scholar
Scopus
Crossref Citations
- Luis-Alfonso Maldonado-Canca, Ana-María Casado-Molina, Juan-Pedro Cabrera-Sánchez, Guillermo Bermúdez-González, "Beyond the post: an SLR of enterprise artificial intelligence in social media." Social Network Analysis and Mining, vol. 14, no. 1, pp. , 2024.
No. of Downloads Per Month
No. of Downloads Per Country