
Estimating Academic results from Trainees’ Activities in Programming Exercises Using Four Types of Machine Learning
Volume 4, Issue 5, Page No 321-326, 2019
Author’s Name: Toshiyasu Kato1,a), Yuki Terawaki2, Yasushi Kodama2, Teruhiko Unoki3, Yasushi Kambayashi1
View Affiliations
1Nippon Institute of Technology, Saitama, Japan
2Hosei University, Tokyo, Japan
3Photron Limited, Tokyo, Japan
a)Author to whom correspondence should be addressed. E-mail: katoto@nit.ac.jp
Adv. Sci. Technol. Eng. Syst. J. 4(5), 321-326 (2019); ![]() DOI: 10.25046/aj040541
DOI: 10.25046/aj040541
Keywords: Programming Exercises, Classroom Assistants, Learning analytics, Machine Learning, Grading estimate

Export Citations
Predicting trainees’ final academic results in the early stage of programming class is a significant mission in the field of learning analytics. Performing exercises in programming class is hard and it takes a lot of time for trainees. For this reason, careful support with trainees are offered in many classes through classroom assistants (CAs). Even with CAs’ assistances, managing a programming class is difficult. Because each trainee’s coding activity is different from another’s, even when each of them is solving the same exercise. Classroom assistants with little teaching experience have difficulty for understanding the unique features of trainee’s coding activity. We have employed data mining to analyze trainees’ coding activities to distinguish those various features. The objective of this research is to present such behavioral features of trainees to CAs to enrich their assistance for the trainees. In order to investigate the timing of guidance, we conjectured the academic results from the chronicle record of coding activities.
Received: 28 May 2019, Accepted: 09 October 2019, Published Online: 22 October 2019
1. Introduction
This paper is an extension of the work originally presented in 2017 International Conference on Computational Science and Computational Intelligence (CSCI) [1].
In programming exercises, Individual trainee’s coding activity varies from person to person, even when each trainee is answering the common exercise. The aim of this research is to display many coding features of trainees to classroom assistants (CAs). We conjectured the academic results to indicate the timing of instruction to the CAs.
Through the analysis of the logs of trainees by using the data mining techniques, we can find the learning pattern of each trainee. This analysis helps instructors to identify “at-risk” trainees [2]. Programming exercises in higher education institutions allow trainees to solve individual tasks. Since the skill levels of trainees differ, each of them has to work on tasks in an individual way [3]. Some trainees solve exercises easily, while others take much time. Therefore, many schools employ CAs to provide assistances for the trainees. CAs are expected not only answer questions of trainees but also to provide comprehensive assistances for the trainees with large assignments [4]. For this reason, a CA needs to understand who needs assistance, what kind of assistance the trainee needs, and under what circumstances assistance the trainee confusing [5].
Predicting trainees’ final academic results in the early stage of programming class is a significant mission in the field of learning analytics. For instance, one can perform regression analysis for this purpose [6]. In order to catch the timing when the instructors intervene to the trainees who need help, instructors need to conjecture the trainees’ future scores of the programming exercises. In order to provide such estimations, the authors have developed and used a unique programming exercise support system [7]. The system is called PRESS, and through the analysis of the outputs of PRESS, we have succeeded to identify the coding activities.
Trainees’ progresses differ from each other, because of the difference of individual skill levels [3]. We have found that this skill level difference can be observed in the coding mode. Trainees who show slow progress have poor coding modes. PRESS demonstrates that such situations are common. Such trainees often stop programming and become disgusted [8]. Therefore, it is important for instructors to identify what kind of trainees have programming exercises at an early stage [4].
We have conjectured the trainee’s academic results in order to get the timing when CAs start assistance for the problematic trainees. According to the instructor’s opinion, trainees who take a lot of time for exercises tend to have low academic results. In this paper, we give details of the results of evaluation experiments on this estimation. As a result, CAs became to comprehend the trainee’s coding activities without having prior programming support experience.
2. Related Work
Several researchers have reported that coding activities has improved trainee’s skills by assisting in debugging and coding methods. Ryan has built a model that enables trainees to improve their skills by analyzing debug logs and execution results [9]. Our study analyzes coding history in addition to debug logs.
Alex proposed a tutor on a computer to support trainee programming [10]. The tutor checks whether the trainees are on the correct trajectory and advises trainees in a wrong track. For instance, an instructor may give trainees a hint on how to reconstruct their programs. Our research aim is to improve trainees’ practical skills by supporting coding methods.
There are past researches targeted at study how to support trainees through their learning chronicle data. In such studies, scientists have analyzed teaching materials using techniques based on statistical methods on Support Vector Machines (SVM). For instance, Yamada et al. detected contents on the Web pages that were difficult for trainees to comprehend by logistic regression [11]. In that research, they have created models with seven explanatory parameters, namely latent time, gaze point distance moved, gazing point movement speed, mouse distance moved, mouse speed, the amount of mouse wheel rotation, and correct identification. Yamada’s evaluation experiment have achieved the identification rate of 81% by using SVM and time series data to improve coding activities, such as compilation and execution frequency.
Researches on foreseeing trainee’s performance by machine learning (ML) algorithm that takes advantages of trainee’s learning chronicle data as teaching data are as follows.
Guo, Zhang, Xu, Shi, and Yang applied deep neural network (DNN) to the data from 12,000 trainees in Chinese elementary and junior high schools to predict five academic results in high school entrance exams [12]. They found that deep learning can predict academic results with highest accuracy rate (Accuracy) among many ML methods.
Belachew and Gobena employed three types of ML algorithms, namely neural networks, Naive Bayes and support vector machines to predict results of 993 trainees at Wolkite University in Ethiopia [13]. They found that, as a result of comparison, Naive Bayes had the highest accuracy rate.
Ahmad, Ismail, and Aziz used three ML algorithms, namely Naive Bayes, decision trees, and rule bases to predict the performance of about 500 trainees in Malaysian [14]. As a result, they reported that the rule base has the highest accuracy rate.
Amrieh, Hamtini, and Aljarah used three ML algorithms, namely neural nets, decision trees, and Naive Bayes, to predict performance with data from 480 trainees at Jordanian University [15]. They found that decision trees and neural networks obtained the highest accuracy rates.
In these preceding researches, variety of ML algorithms are applied to trainee data, and researchers who tackled this problem demonstrated how and what way each of the ML methods succeeds to predict the final scores. Unfortunately, the data used for the evaluation are largely different from each other, and the data used in many studies are not open to the public. It is difficult for a third party to pursue further study through conducting a comparative experiments with a follow-up test or alternative method. We can only use them as reference data.
3. Analysis of Coding Activities
In this research, we have set up data on the coding activities of trainees in 2014 and 2015 classes analyzed in previous study [16, 17]. Table 1 displays the explanatory parameters used for the analysis. We have measured all of the data and then analyzed the analysis targets using PRESS. We have examined the following two approaches to the data.
- Unsupervised classification.
- Estimation of exercise-solving time.
Table 1: Explanatory parameters
| Type of characteristics | ||
| Time | Frequency | Error |
| Problem-Solving | Compilation | Number of errors |
| Compilation interval | Execution | Number of similar errors |
| Execution interval | ||
3.1. Unsupervised classification
We have used Ward’s method, which is a representative hierarchical clustering [18] [19]. Clustering is a process that groups objects into classes of similar objects [20]. We have formed from
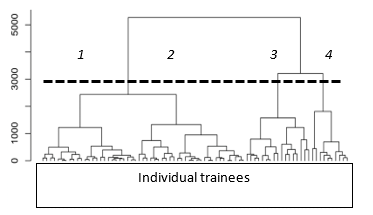 Figure 1: Clustering by Ward’s method
Table 2: Explanatory parameters for each cluster
| Cluster | Solving time [s] | Compilation interval [s] | Execution interval [s] | Compilation frequency | Execution frequency | Number of errors | Number of similar errors | Number of trainees |
| 1 | 528 | 209 | 267 | 7 | 5 | 1 | 1 | 25 |
| 2 | 812 | 379 | 606 | 6 | 3 | 3 | 3 | 28 |
| 3 | 1405 | 590 | 1160 | 7 | 3 | 4 | 3 | 17 |
| 4 | 1506 | 228 | 337 | 18 | 13 | 5 | 4 | 10 |
the patterns (observations, data elements, or characteristic vectors) into clusters (groups or subsets) based on those localities and connectivity in the n-dimensional space as shown in Figure 1. Figure 1 demonstrates the cluster analysis of the seven explanatory parameters. Table 1 indicates the summary of explanatory parameters for each cluster in Figure 1.
We have perceived the following clusters:
- Cluster 1: A group solved the exercise in short time. In this group, trainees understand each problem they encounter while coding.
- Cluster 2: A group solved the exercise in short time. In this group, trainees are coding without understanding the details of their problems.
- Cluster 3: A group solved the exercise in long time. In this group, trainees are cursorily checking the error contents and cording without full comprehension of their problems.
- Cluster 4: A group solved the exercise in long time. In this group, trainees are cording without checking any error details.
3.2. Length estimation of time for solving exercises
The trainees in each cluster should receive cluster-specific instructions. Therefore, instructors and CAs need to identify the features of the trainees in the class and pay special attentions to those who take a long time to solve given exercises. The cluster analysis, however, cannot conjecture the duration for solving exercises in the future. For this reason, CAs cannot know which trainees need certain types of guidance at the beginning or before class. In order to ameliorate this hindrance, we used the 2014 class coding activities as training data and tried to predict the exercise-solving time in 2015 class activities. Table 3 displays the coding activity data for two years. The values of the explanatory parameters for each year are averaged values (excluding the number of trainees). These data are taken from two programming exercises of the same content each year.
We have used logistic regression to decide whether trainees’ exercise-solving time would be long or short. Logistic regression is a typical statistical method that illustrates the relationship between two different series of data [21]. We can assume that one of the series of data as independent variables, and the other data are dependent variables. We assume that the output variable takes one value from a set of fixed values. This value corresponds to a class of the classification problem. The regression equation is displayed in Equation (1). p is the probability conjecture of the
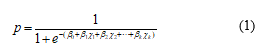 Table 3: Coding activities in 2014 and 2015
| 2014 | 2015 | |
| Number of trainees | 85 | 80 |
| Solving time (Problem) [s] | 815 | 936 |
| Compilation interval (Average) [s] | 295 | 352 |
| Execution interval (Average) [s] | 513 | 584 |
| Compile frequency | 10 | 8 |
| Execution frequency | 5 | 5 |
| Number of errors until correct answers | 7 | 3 |
| Number of similar errors that are most frequent | 4 | 3 |
| Number of trainees late submission | 32 | 35 |
| Number of exercise resolutions | 40 | 41 |
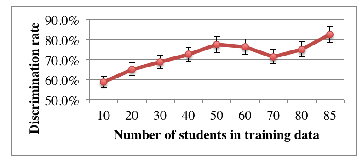 Figure 2: The number of trainees in the training data and discrimination rate
objective variable. In this research, we obtained the probability p of a long exercise-solving time. β0 is a constant, β1, β2, … βk are regression coefficients, and χ1, χ2, … χk are explanatory parameters.
We first applied training data to logistic regression to determine constant and regression coefficients. We used Tensor Flow for this calculation. Tensor Flow is a representative tool for DNN [22]. We used cross-entropy as a learning error function for the supervised classification problem and carried out optimization using the steepest descent method [23]. The objective variable for logistic regression must be represented in the 0/1 binary. We set the teaching data to 0 when it was longer than the mean exercise-solving time and to 1 if it was shorter than the mean exercise-solving time.
We created a model with the 2014 data, and then we applied the 2015 data to the model and conjectured the length of the exercise-solving time. The discrimination rate was 82.5%. The parameters at this time were a learning rate of 0.015 and the number of learning iterations was 70,000. Figure 2 displays the number of trainees and the identification rate used in the training data for ML.
4. Estimating Academic results from Trainees’ Activities
Now that we have the conjecture of the exercise-solving time, we next conjectured academic results to find the timing of instruction. In order to improve accuracy much further, we have used 2016 data in addition to the last two years (Table 3). Table 4 displays the coding activities for 2016 class and Table 5 displays the academic results by three years. The academic results are based on the final exam at the end of the semester.
The subjects (trainees) are sophomores in a Java programming class from our institute. Each year, the same instructors took the charge of the class, but the academic results are differed from year to year as a subjective evaluation of instructors has been added. For this reason, we have defined the estimation rate as follows along with the coincidence rate:
Based on the data of these three years, we have conjectured the academic results through the following procedure.
- Normalize the input data.
- Decide the features.
- Decide network configuration and parameters.
- Conjecture the accuracy by creating a network model.
- Check the estimation accuracy.
- Repeat steps 3 to 5 to improve accuracy of the estimation.
- Analyze by changing the hidden layer
Table 4: Coding activities in 2016
| Number of trainees | 107 |
| Solving time (Exercise) [s] | 639 |
| Compile interval (Average) [s] | 405 |
| Execution interval (Average) [s] | 139 |
| Compile frequency | 7 |
| Execution frequency | 2 |
| Number of errors until correct answers | 5 |
| Number of similar errors that are most frequent | 2 |
| Number of trainees late submission | 51 |
| Number of exercise resolutions | 38 |
Table 5: Academic results in programming exercises
| Academic results | 2014 | 2015 | 2016 |
| 1: Failing | 17 | 1 | 5 |
| 2: Below pass | 33 | 13 | 34 |
| 3: Pass | 17 | 17 | 34 |
| 4: Very good | 21 | 36 | 30 |
| 5: Excellent | 2 | 15 | 7 |
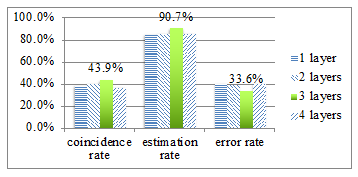 Figure 3: The coincidence rate, estimation rate, and error rate
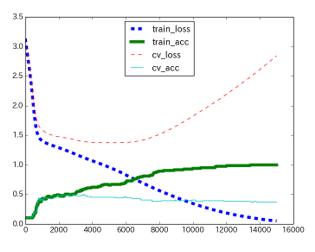 Figure 4: Loss and accuracy when the hidden layer is three layers
Figure 3 displays the coincidence rate, estimation rate, and error rate in the case of one, two, three and four hidden layers respectively. The error rate in Figure 3 is calculated by sum of the divergences between conjectured academic results and final academic results then divided by the number of trainees.
In addition to these parameters, we have chosen the following features to analyze the trainees’ activities. They are duration for solving the exercises compile frequency, execution frequency, the number of similar errors that are most frequent, and the number of exercises they resolved. Through various machine-learning situations, we have found that the case of three hidden layers provides the most accurate estimation. Figure 4 displays the best case of our experiments; that has three hidden layers.
Table 6 displays the mean values of explanatory parameters. We have normalized them for each academic result. There was no trainee conjectured to earn the academic result of 5 (highest). In academic result, the number of exercises solved and the time for solving exercises are particularly related.
In addition to the experiments using DNN, we have performed performance prediction using three ML algorithms. The algorithms used in this experiment are Random Forest, SVM, and Naive Bayes. The objective of these experiments is to assess the performance of different ML algorithms.
With those ML algorithms, the purpose is also classification; the same as DNN. Also, we used the same data set for analysis as
Table 6: The mean values of feature quantities normalized for each academic result
| Ac. result |
Exercise- solving times |
Compile times | Execution times | Similar Errors | Number of exercise resolutions |
| 1 | 1.66 | -0.40 | -0.96 | -0.78 | -2.28 |
| 2 | 0.25 | 0.44 | -0.44 | 0.47 | -0.65 |
| 3 | 0.20 | -0.77 | -0.69 | -0.68 | -0.61 |
| 4 | -0.96 | -0.32 | 0.32 | -0.30 | 1.01 |
| 5 | – | – | – | – | – |
Table 7: Estimation results
| Accuracy | Precision | Recall | |
| DNN | 0.70 | 0.41 | 0.46 |
| Random Forest | 0.62 | 0.34 | 0.37 |
| SVM | 0.58 | 0.32 | 0.42 |
| Naive Bayesian | 0.58 | 0.32 | 0.38 |
DNN. The reason for adopting these three types is that they were used for performance prediction in the previous researches [11] [13] [14] [15].
Table 7 displays the results of various data mining methods. The interpretation of precision and recall values here depends on each class and each academic result. This value is based on the average of all academic result classes. From these results, we can confirm that the academic results can be conjectured through analysis of coding activities by any MLs. DNN provides the most accurate predictions, but precision and recall values are low. From the perspective of accuracy, our method can find trainees who would fail from the class. However, since precision and recall are low, there is an exercise that the same method does not guarantee the same accuracy every year.
5. Discussion
We have conducted experiments of DNN with various combinations of explanatory parameters. We could not identify one single particular dominating explanatory parameter. We can conclude that all the explanatory parameters contribute almost equally to the accurate estimations. What we can state is that the DNN provides the highest values as displayed in Table 7.
For this data set, we can conclude that we can predict the performance of each trainee by any algorithms we select, even though the Deep Leaning provides the best results. However, precision and recall values are low even in DNN. The reason may be that the trainees are not the same every year and the final exam is different each year. The low value of precision and recall can be explained that the past trainee’s patterns were not suitable for the target trainee’s patterns. This can be expected to improve accuracy by increasing the number of trainee patterns each year.
Regarding the explanatory parameters, the most relevant activities to the academic results are the frequency of compilations and the number of similar errors. Trainees who display too frequent compilation and produce a number of similar errors are expected to receive low academic results. We can conclude that these trainees are doing programming without knowing what wrong they have done in the programming. However, there were some trainees with low academic results despite the small amount of compilations. There is a possibility that these trainees just copied their programs from other trainees. Instructor should intervene trainees those who compile too frequently in a short period of time. Also, we have observed that intervention is necessary for trainees who have not compiled for a long time. From these observation, we can conjecture that not only we can build a system that let instructors know which trainees need interventions but also we can construct a computerized automatic intervention system for trainees who need help.
We interpret the results in Table 6 and consider each group of trainees has the following features.
- result 1: A group solved the exercises in short period and produced a small number of executions. Some trainee in this group may be programming carefully, but in practice most of them are less motivated and not programming at all. This group of trainees may be waiting for their friends’ solutions of the task.
- result 2: A group compiled the programs very frequently, causing the similar errors. This group of trainees may not investigate the cause of the error very well, and may just execute their program mindlessly. Because this type of trainees do not understand the cause of the error, the final exam scores also tend to be low.
- result 3: A group produced a small number of compilations and executions. In this group, trainees do not produce the same type of errors many times. Trainees are coding while they are investigating the cause of the error carefully. They are trying to understand every error they produced. Therefore, their final exam scores tend to be high.
- result 4: A group consumed very short period for solving the exercises. Trainees in this group solve many exercises. We observed trainees in this group can understand exercise sentences quickly and can program for solutions quickly. Therefore, their final exam scores tend to be very high.
The numbers of incorrect estimations are as follows. There were six cases where the conjectured academic result was 4 and the actual academic result was 2. Also, there were four cases where the conjectured academic result was 2 and the actual academic result was 4.
The reason why there were no trainees of academic result 5 in Table 6 may be that the number of exercises solved was small. Actually, we do not have enough training data with trainees with this highest academic result.
6. Conclusion
In this paper, we have analyzed the trainee’s coding history to conjecture exercise-solving time and academic results. The objective of this estimation is to support CAs in order to assist trainees in programming exercises. We have carried out the analyses to classify trainees who perform programming exercises. We have applied ML to construct a model that represents the coding activities of a programming class and then applied that model to the coding activities of trainees in the following year to conjecture the results from the data for the past two years. As the results, we have observed that the coincidence rate is 43.9%, and the plus or minus 1 estimation rate was 90.7%. In addition, in the analysis using four types of ML, we have found that DNN provides the most accurate estimation. However, since the values of precision and recall are low, it is necessary for us to investigate the coding history of the trainees of each year, and then improve our analysis.
As the data mining, we discovered that DNN, Random Forest, SVM and Naive Bayes can foresee the same results with sufficiently high accuracy by the same data. We clarified the results and found that we could conjecture the academic results even with a small amount of explanatory parameters.
As a future direction for research, we analyze each lesson more methodically so that we can conjecture the results at an early stage while maintaining the estimation rate high. We also plan to apply this method to other programming classes that use other programming languages than Java, such as Python.
Acknowledgment
This work was supported by Japan Society for Promotion of Science (JSPS), with the basic research program (C) (18K02910), and (A) 26245048, Grant-in-Aid for Scientific Research (KAKENHI).
- Kato, T., Kambayashi, Y., Terawaki, Y. & Kodama, Y., “Estimating Grades from Students’ Behaviors in Programming Exercises Using Deep Learning”, In 2017 International Conference on Computational Science and Computational Intelligence (CSCI), IEEE, 1115-1119, 2017.
- Baradwaj, B. & Pal, S., “Mining Educational Data to Analyze Student’s Performance”, International Journal of Advanced Computer Science and Applications, 6, 2, 63-69, 2011.
- Horiguchi, S., Igaki, H., Inoue, A., Yamada M., Hoshi T. & Okada K., “Progress Management Metrics for Programming Education of HTML-based Learning Material”, Journal of Information Processing Society of Japan., 53, 1, 61-71, 2012. (In Japanese)
- Sagisaka T. & Watanabe S., “Investigations of Beginners in Programming Course Based on Learning Strategies and Gradual Level Test, and Development of Support-Rules”, Journal of Japanese Society for Information and Systems in Education., 26, 1, 5-15, 2009. (In Japanese)
- Yasuda K., Inoue A. & Ichimura S., “Programming Education System that can Share Problem-solving Processes between Students and Teaching Assistants”, Journal of Information Processing Society of Japan., 53, 1, 81-89, 2012. (In Japanese)
- You, J. W., “Identifying significant indicators using LMS data to predict course achievement in online learning”, Internet and Higher Education, 29, 23-30, 2016.
- Kato T. & Ishikawa T., “Design and Evaluation of Support Functions of Course Management Systems for Assessing Learning Conditions in Programming Practicums”, ICALT 2012, pp. 205-207, 2012.
- H, Saito S., Inoue A., Nakamura R., & Kusumoto S., “Programming Process Visualization for Supporting Students in Programming Exercise”, Journal of Information Processing Society of Japan, 54, 1, 2013. (In Japanese)
- Ryan C. & Michael C. L., “Debugging: from Novice to Expert”, ACM SIGCSE Bulletin: 36, 1, 17-21, 2004.
- Alex G., Johan J. & Bastiaan H., “An Interactive Functional Programming Tutor”, ITiCSE ’12: Proceedings of the 17th. ACM, 250-255, 2012.
- Yamada T., Nakamichi N. & Matsui T., “Detection of Low Usability Web Pages with Logistic Regression”, GN Workshop 2010, 57-62, 2010. (In Japanese)
- Guo, B., Zhang, R., Xu, G., Shi, C., & Yang, L., “Predicting Students Performance in Educational Data Mining”, 2015 International Symposium on Educational Technology (ISET), doi:10.1109/iset.2015.33, 2015.
- Belachew, E. B., & Gobena, F. A., “Student Performance Prediction Model using Machine Learning Approach: The Case of Wolkite University”, International Journal of Advanced Research in Computer Science and Software Engineering, 7, 2, 46-50. doi:10.23956/ijarcsse/v7i2/01219, 2017.
- Ahmad, F., Ismail, N. H., & Aziz, A. A., “The Prediction of Students Academic Performance using Classification Data Mining Techniques”, Mathematical Sciences 9, 6415-6426. doi:10.12988/ams.2015.53289, 2015.
- Amrieh, E. A., Hamtini, T., & Aljarah, I., “Preprocessing and Analyzing Educational Data Set using X-API for Improving Students Performance”, 2015 IEEE Jordan Conference on Applied Electrical Engineering and Computing Technologies (AEECT), doi:10.1109/aeect.2015.7360581, 2015.
- Kato T., Kambayashi Y. & Kodama Y., “Data Mining of Students’ Behaviors in Programming Exercises”, Smart Education and e-Learning 2016. 59, 121-133, 2016.
- Kato T., Kambayashi Y., Terawaki Y. & Kodama Y., ” Analysis of Students’ Behaviors in Programming Exercises using Deep Learning”, Smart Education and e-Learning 2017. 38-47, 2017.
- Kamishima T., “A Survey of Recent Clustering Methods for Data Mining (Part 1): Try Clustering!”, Journal of the Japanese Society for Artificial Intelligence, 18, 1, 59-65, 2003. (In Japanese)
- Michael R. A., “Cluster Analysis for Applications”, Academic Press, 1973.
- Jain, A. K., Murty, M. N. & Flynn, P. J., “Data Clustering: A review”, ACM Computing Surveys. 31, 3, 264-323, 1999.
- Uchida O., “Logistic Regression Analysis by SPSS”, Ohmsha, 2011. (In Japanese)
- Tensor Flow, Google, https://www.tensorflow.org
- Ozawa Y., Kohno Y. & Takahashi T., “Generalization method with satisficing on ANN”, The 29th Annual Conference of the Japanese Society for Artificial Intelligence, 29, 1-4, 2015. (In Japanese)