Sentiment Analysis of Transjakarta Based on Twitter using Convolutional Neural Network
Volume 4, Issue 5, Page No 281-286, 2019
Author’s Name: Kevin Yudia), Suharjito
View Affiliations
Binus Graduate Program – Master of Computer Science, Computer Science Department, Bina Nusantara University, 11480, Indonesia
a)Author to whom correspondence should be addressed. E-mail: kevin.yudi@binus.ac.id
Adv. Sci. Technol. Eng. Syst. J. 4(5), 281-286 (2019); ![]() DOI: 10.25046/aj040535
DOI: 10.25046/aj040535
Keywords: Sentiment Analysis, Deep Learning, CNN
Export Citations
TransJakarta is one of the methods to reduce congestion in Jakarta. However, the number of TransJakarta users compared to number of private vehicle users is very small, only 24% of the total population in Jakarta. The purpose of this research is to know public opinions about TransJakarta whether positive or negative by doing sentiment analysis about TransJakarta based on the opinion of Twitter, as Twitter is one of media to express its many users to express their opinions about an individual or an instance. Data is retrieved from Twitter using the R-Studio application by utilizing the “TwitteR” library, then pre-processing and stored in a database. Next step is labelling the data using Sengon Lexicon and will be trained and tested using the Convolutional Neural Network algorithm. There are three CNN architectural models to be tested, namely VGG, ResNet, and GoogleNet. The designed VGG consists of 16 layers, ResNet 34 layers, and GoogleNet 22 layers. After the data are trained and tested, the results will be evaluated using Confusion Matrix to get the best F-Score. The results showed that among the three architectural models that were tested, the Resnet 34 layers architecture model gave the best F-Score of 98.11%, better compared to VGG which had the highest F-Score value of 96.74% and GoogleNet of 96.80%.
Received: 08 August 2019, Accepted: 07 September 2019, Published Online: 08 October 2019
1. Introduction
Social Media is a popular platform to share information such as daily live updates, opinion and emotion in form of including pictures, text, videos, and audio. In Indonesia, the number of Social Media users is 90% of Internet users, counting to 132 million Users [1,2]. One of the platforms that are widely used is Twitter, where the number of users is 27% of the number of social media users in Indonesia. With those numbers of Users, Twitter can be used to retrieve information needed to do Sentiment Analysis. Sentiment analysis or opinion mining is a process of understanding, extracting and processing textual data automatically to get sentiment information contained in an opinion sentence [3].
One interesting phenomenon is the level of congestion in Jakarta. Based on the Inrix, Jakarta is ranked 12th as the most congested city in the world, and the second is in Asia. The government itself has sought to overcome severe congestion in Jakarta, one of which is by providing TransJakarta facilities. TransJakarta is a city-wide bus service that operates every day, with service coverage reaching all of Jakarta. The number of buses available by the end of 2017 has reached 3000 units, but TransJakarta’s average number of users per day is only 340,000 people. By using Social Media, opinion about TransJakarta can be retrieved, and then can be used to analyze public image about TransJakarta. In the process of getting results, the right and accurate methods are needed [4]. One method that can be used is using Deep Neural Network Convolutional Learning.
In-depth learning in the last decade achieved satisfactory results in image analysis and analyzing speech in the form of text. One of the developing models is the Convolutional Neural Network (CNN). CNN is a model of artificial neural network that does not use the steps carried out by traditional artificial neural networks, but uses the convolution method while to produce output, input data will go through many different filters, then the results of this filter will be combined so that the results obtained more accurate [5]. Some CNN architectures are VGG, ResNet, and GoogleNet, each of which has a different number of layers. In this study, CNN Deep Learning will be used to obtain the results of social media data analysis about TransJakarta, then it will seek the best verification by comparing existing CNN architectural models.
2. Related Works
In 2014, Dos Santos and Gatti [6] conducted sentiment analysis of data from Stanford Sentiment Treebank (SSTb), which contained sentences from the results of the film’s connection, Stanford Twitter Sentiment Corpus (STS), which contained text from Twitter. This research proposes the Character to Sentence Convolutional Neural Network (CharSCNN) method, using two convolution layers to extract features related to words and sentences in various sizes. From this experiment, Dos Santos and Gatti produced an AccuracyI of 86.4%. This research has not used MaxPooling to measure the size of the output produced.
Then in 2015, Severyn and Moschitti [7] conducted Twitter data sentiment analysis using the Dynamic Nevolute Neural Network. Research from Severyn and Moschitti emphasizes the use of Word Embedding, between Word2Vec and Random Word Embeddings in Information Retrieval by using an unsupervised neural language model to train initial word embeddings that are further tuned by deep learning model on a distant supervised corpus. This study resulted in an accuracy of 87.12%.
In 2017, Yenter and Verma [8] conducted a sentiment analysis using Film Review Data from the IMDB website using Deep CNN-LSTM with a Combined Kernel of Various Branches for Analysis of IMDb Review Sentiments. This research tries to try one-dimension kernel with size 3, 5.7 and 9. Each branch’s LSTM layer has 128 units. Any less or more units reduce accuracy or increase overfitting. From this research it produces an Accuracy of 89.5%.
In 2018, Cano and Morisio [9] also conducted sentiment analysis using Film Review Data from the IMDB website. The architectural model used is NGramCNN, compared to the SingleCNN and BLSTM-2DCNN models. It uses pretrained word embeddings for dense feature representation and a very simple single-layer classifier. The classifier used consists of a dense layer of 100 units and L2 regularization with 0.09 weight, followed by the output layer. Dropout of 0.5 between the dense and output layers were also used to avoid overfitting. From this study resulted in an accuracy of 91.2%.
3. Methodology
The first step taken in research is to retrieve data from Twitter. Data taken from Twitter contains the keyword ‘TransJakarta’. Twitter data can be obtained using the API provided by Twitter [10]. After receiving data about TransJakarta, the data will then be stored in a database. The database used is PostgreSQL version 10.
After the data is stored in a database, the data will be processed and stored so that the data can be used to analyze sentiments. This process is called PreProcessing [11-13]. After completion, the data is then labeled per Tweet using a dictionary or Lexicon. The Lexicon used is the Lexon Sengon. After that the data will be entered in CSV and will be used as a data model for the Train and Test of the Learning algorithm in using several CNN models compared to one RNN model.
The CNN model used consisted of VGG consisting of 16 layers [14], Residual Net (ResNet) consisting of 34 layers [15], GoogleNet consisting of 22 layers [16]. While the RNN model used is LSTM. The experiment will be carried out in two variations, namely using Train 80 data compared to Test 20 and Train 90 data compared to Test 10. After the Training Model data model is formed and generate Test data, then the data will be evaluated using the Confusion Matrix. Figure 1 shows the steps of this research.
3.1. Data Crawling
Data from Twitter will be collected through the Twitter API using R-Studio software. The data collected are about TransJakarta referred by Twitter users from August 1, 2018 to October 31, 2018. After the data is obtained, the data is then stored in the PostgreSQL Database. But not all parts of the data are stored in a database. Information needed for research is as follows:
o TweetID: The ID for each Tweet that exists, originating from Twitter.
o TweetContent: Tweet from Twitter about TransJakarta.
o TweetDate: The date a Tweet was posted.
o InsertDate: Date the data was inserted into the database.
3.2. PreProcessing
PreProcessing is a step to clean up data for sentiment analysis. The PreProcessing steps are as follows:
3.2.1 Case Folding
This step aims to turn all words into lowercase letters. The aim is to avoid case sensitive when matching words with a dictionary. An example is the change in the word ‘Slow’ to ‘slow’.
3.2.2 Normalization
This step aims to remove the link in the post on social media, because the link is not part of the analysis. For example, the ‘bit.ly/Xoa81p’ link will be removed as ‘’. This step is also carried out with the aim of avoiding promotional spam using unclear links.
3.2.3 Data Cleansing
Data cleansing is the process of removing characters other than letters, such as punctuation and symbols. In this process also removes the ‘RT’ symbol which indicates that this Tweet is a Tweet from another user’s Tweet.
3.2.4 Removing Stopwords
This step aims to eliminate words that are considered to have no meaning. For example, the words ‘there’ and ‘what’ are deleted because they have no meaning.
3.2.5 Tokenization
This step is done by separating each word into one separate part. Separation of these words is done by cutting sentences based on spaces so that later can be made a vocabulary based on unique words contained in the text.
3.3. Labelling Process
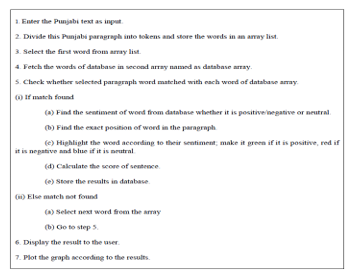 Figure 2: Pseudocode of Lexicon based Algorithm for Sentiment Analysis
Labeling Process is a step to give a positive or negative label to a Tweet based on the words contained in the Tweet. This step is done by comparing the words in the Tweet with the list of words contained in Lexicon, both for positive and negative categories [17,18]. Figure 2 shows the algorithm of Lexicon based Sentiment Analysis. The Lexicon used for this study is Sengon Lexicon, which can be obtained at the following link: https://github.com/masasdani/sengon. Sengon Lexicon consists of 3061 positive words and 4239 negative words.
3.4. Convolutional Neural Network
Convolutional Neural Network is one of the machine learning methods of developing Multi-Layer Perceptron (MLP) which is designed to process two-dimensional data but can be used for text classification [19-21]. CNN is included in the Deep Neural Network type because of its deep network level and is widely implemented in image data. CNN has two methods; namely classification using feedforward and learning stages using backpropagation. The way CNN works is similar to MLP, but in CNN each neuron is presented in two dimensions, unlike MLP where each neuron is only one dimensional. In purely mathematical terms, convolution is a function derived from two given functions by integration which expresses how the shape of one is modified by the other.
Several architectural models will be tested in this study, including VGG, ResNet, and GoogleNet. The three models will be designed using the same hyperparameter, but with a number of different layers according to the character of each model. Table 1 shows the paramaters that used in this research.
Table 1 – Comparison of Proposed Model Architecture
| VGG | ResNet | GoogleNet | |
| Layers | 16 | 34 | 22 |
| Epoch | 5 | 5 | 5 |
| Batch Size | 32 | 32 | 32 |
| Activation Function | ReLU | ReLU | ReLU |
| Max Pooling | 50% | 50% | 50% |
| DropOut | 0.5 | 0.5 | 0.5 |
| Kernel Size | 3×3 | 3×3 | 3×3 |
The first experiment will be carried out using Training Data 80% compared to Test Data 20%. The second experiment will be carried out using Training Data 90% and Test Data 10%. Each of Training data will be evaluated using k-fold cross validation method. In k-fold cross-validation, the original sample is randomly partitioned into k equal sized subsamples. Of the k subsamples, a single subsample is retained as the validation data for testing the model, and the remaining k − 1 subsamples are used as training data [22]. The cross-validation process is then repeated k times, with each of the k subsamples used exactly once as the validation data. The k results can then be averaged to produce a single estimation. The advantage of this method over repeated random sub-sampling is that all observations are used for both training and validation, and each observation is used for validation exactly once. In this research, number of the fold k = 5.
3.5 Evaluation Method
Evaluation is a step to get the accuracy value from the model that has been made. The evaluation method used is Confusion Matrix. Confusion Matrix is used to get values consisting of Accuracy, Precision, Recall, and F-Score [23].
Accuracy: The percentage of data that is correctly identified is compared with the sum of all data.
Precision: The total number of correctly classified positive examples by the total number of predicted positive examples.
Recall: The ratio of the total number of correctly classified positive examples divide to the total number of positive examples.
F-Score: The harmonic mean of the precision and recall, where an F-score reaches its best value at 1 (perfect precision and recall) and worst at 0.
Definition of terms:
True Positive (TP): Observation is positive and is predicted to be positive.
False Negative (FN): Observation is positive but is predicted negative.
True Negative (TN): Observation is negative and is predicted to be negative.
False Positive (FP): Observation is negative but is predicted positive.
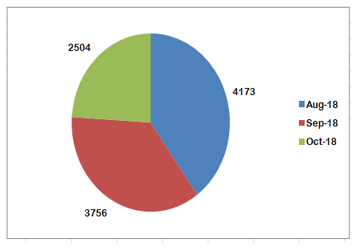 Figure 3: Chart of Data Distribution
4. Results Analysis
4.1. Data Collection
Data for this research were taken in the period between August 1, 2018 and October 31, 2018. In August 2018, the number of Tweets obtained was 4173 Tweets. While in September 2018 passed 3756 Tweets. Last October 2018 exceeded 2504 Tweets, with a total data of 10433 Tweets. Due to the policy of the Twitter API which only allows retrieving data from the past week, the data is taken every two days within a week. Figure 3 shows the distribution of data taken for this research.
4.2. Labelling Process
From the results of the labeling process, we got Tweet data labeled ‘Positive’ of 7174 Tweets out of a total of 10433 Tweets or 68.76%. Whereas the Tweet labeled ‘Negative’ by 3259 or 31.24%. Data labeled Neutral were not used in this research because it did not provide any meaning between positive and negative. The percentage distribution can be seen in Figure 4.
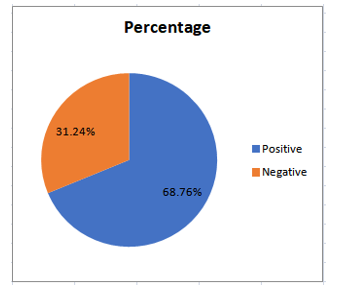 Figure 4: Percentage of Data after Labelling
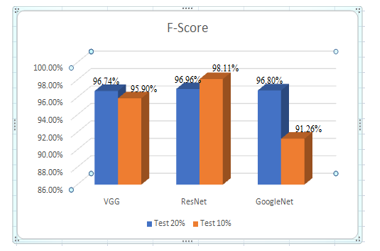 Figure 5: Comparison of F-Score between VGG, ResNet, GoogleNet
4.3. Model Architecture Results
After the data has been labeled, the next process is to use the Machine Learning Algorithm to study the data and provide the results of the classification of Tweet comments on TransJakarta. The algorithm used here is CNN VGG (16 layers), ResNet (34 Layers), GoogleNet (22 Layers), and LSTM. The first try will be carried out using Training Data 80% compared to Test Data 20%. The second experiment will be carried out using Training Data 90% and Test Data 10%. To conduct research, the machine used has the following specifications:
o Intel Core i5-7200U @ 2.50 GHz (4CPUs) Processor
o 12288MB RAM
o NVIDIA GeForce 940MX 2010 MB GPU
In Figure 5 the ResNet architecture model with Train-Test 90:10 data has the highest F-Score, which is 98.11%. The VGG architectural model achieved an F-Score of 96.74%, while GoogleNet with Train-Test data of 90:10 had the lowest F-Score of 91.26%.
Figure 6 shown the comparison results of Accuracy between three models, experiments with Train-Test 90:10 data always have a higher level of accuracy compared to Train-Test 80:20, with the exception of the GoogleNet architecture. Of all the architectural models that were tested, the ResNet method with a Train-Test 90:10 produced the highest Accuracy compared to other architectural models, which amounted to 95.94%.
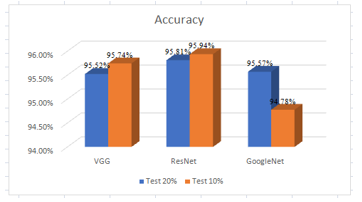 Figure 6: Comparison of Accuracy between VGG, ResNet, and GoogleNet
Two existing approaches are compared to assess the recognition effect of the proposed approach, namely the Deep CNN – LSTM with Combined Kernels based approach, and the NGramCNN based approach. Table 2 shown the comparison between existing approaches and proposed approaches. From them, it can be seen that the proposed approach achieves has better Accuracy and F-Score, compared to other methods.
Table 2 – Comparison of Accuracy and F-Score by different methods
| Method | Accuracy | F-Score |
| Decision Tree | 84.37% | 85.41% |
| Random Forest | 86.88% | 86.71% |
| Deep CNN | 87.14% | 86.45% |
| NGramCNN | 88.73% | 89.58% |
| VGG | 95.74% | 96.74% |
| ResNet | 95.94% | 98.11% |
| GoogleNet | 95.57% | 96.80% |
5. Conclusions
From the research of Twitter sentiment data analysis with the keyword ‘TransJakarta’ using proposed method, several conclusions can be drawn as follows:
- The selection of data using different Training and Test Percentages only has a small effect on the value of Accuracy and F-Score, where the difference between the highest Accuracy value between the two percentages is 0.32%, and the difference in the highest F-Score value is 1.14%.
- The research method used between VGG, ResNet, GoogleNet, and LSTM by using the same parameters only has a small effect on the value of Accuracy and F-Score, where the difference in the highest Accuracy value among all methods is 0.19%, and the difference in the value of F- The highest score ¬ 0.89%.
- Based on comparison with methods from previous studies, the proposed method has increased from the F-Score results. When compared with the Deep CNN method, the F-Score of the proposed method increased by 11.66, whereas when compared with nGramCNN it increased by 8.53.
Conflict of Interest
The authors declare no conflict of interest.
- J. H. Kietzmann, K. Hermkens, I. P. McCarthy, B. S. Silvestre, Social media? Get serious! Understanding the functional building blocks of social media, Business Horizon, 2011.
- P. Kotler, K. L. Keller, Marketing management, Pearson, 2012.
- L. Schweitzer, “Planning and social media a case study of public transit and stigma on twitter”, Journal of American Planning Association, 80(3), 218-238. 2014. https://doi.org/10.1080/01944363.2014.980439.
- M. Skuza, A. Romanowski, “Sentiment Analysis of Twitter Data within Big Data Distributed Environment for Stock Prediction”, in Proceedings of the Federated Conference on Computer Science and Information Systems, Lodz, Poland, 2015. https://doi.org/10.15439/2015F230.
- Y. Kim, “Convolutional neural networks for sentence classification.”, 2011, arXiv preprint arXiv:1408.5882.
- C. N. Dos Santos, M. Gatti, “Deep convolutional neural networks for sentiment analysis of short texts”, in Proceedings of COLING 2014, the 25th International Conference on Computational Linguistics: Technical Papers, Dublin, Ireland, 2014.
- A. Severyn, A.Moschitti, “Twitter sentiment analysis with Deep Convolutional Neural Networks”, in Proceedings of the 38th International ACM SIGIR Conference on Research and Development in Information Retrieval, Santiago, Chile, 2015. https://doi.org/10.1145/2766462.2767830.
- A. Yenter, A. Verma, “Deep CNN-LSTM with combined kernels from multiple branches for IMDB Review Sentiment Analysis.”, In 2017 IEEE 8th Annual Ubiquitous Computing, Electronics and Mobile Communication Conference (UEMCON), New York, NY, USA, 2017. https://doi.org/10.1109/UEMCON.2017.8249013.
- E. Cano, M.Morisio, “A deep learning architecture for sentiment analysis” in Proceedings of the International Conference on Geoinformatics and Data Analysis, Prague, Czech Republic, 2018. https://doi.org/10.1145/3220228.3220229.
- M. Stowe, Undisturbed REST a guide to designing the perfect API, San Fransisco: MuleSoft, 2015.
- B.Liu, Sentiment analysis and subjectivity, Handbook of Natural Language Processing, 2010.
- T. C. Carr, R. Hayes, “Social media: defining, developing, and divining”, Atlantic Journal of Communication, 23(1), 46-65, 2015. https://doi.org/10.1080/15456870.2015.972282.
- N. Kalchbrenner, E. Grefenstette, P. Blunsom, “A Convolutional Neural Network for Modelling Sentences.”, arXiv preprint arXiv:1404.2188, 2014.
- K. Simonyan, A. Zisserman, “Very Deep Convolutional Networks for Large-Scale Image Recognition”, 2014, arXiv:1409.1556.
- K. He, X. Zhang, S. Ren, J. Sun, “Deep residual learning for image recognition”, The IEEE Conference on Computer Vision and Pattern Recognition (CVPR), 2016. arXiv:1512.03385.
- C. Szegedy, W. Liu, Y. Jia, P. Sermanet, S. Reed, D. Anguelov, A. Rabinovich, “Going Deeper with Convolutions.”, 2014, arXiv:1409.4842.
- F. K. Chopra, R. Bhatia, “Sentiment Analyzing by Dictionary based Approach.”, International Journal of Computer Applications, 152(5). 32-34, 2016. https://doi.org/10.5120/ijca2016911814.
- B. Verma, R. S. Thakur, “Sentiment analysis using lexicon and machine learning-based approaches: A survey.”, in Proceedings of international conference on recent advancement on computer and communication, Singapore, 2018. https://doi.org/10.1007/978-981-10-8198-9_46.
- R. A. Solovyev, M. Vakhrushev, A. Radionov, V. Aliev, A. A. Shvets, “Deep Learning Approaches for Understanding Simple Speech”, 2018, arXiv preprint arXiv:1810.02364.
- E. Alpaydin, Introduction to Machine Learning, Massachusetts Institute of Technology Press, 2010.
- C. Bishop, Pattern Recognition and Machine Learning, Springer, 2006.
- W. Fu, P. O. Perry, “Estimating the number of clusters using cross-validation”, Journal of Computational and Graphical Statistics, 1-20, 2019. https://doi.org/10.1080/10618600.2019.1647846.
- M. Yulianto, A. S. Girsang, R. Y. Rumagit, “Business intelligence for social media interaction in the travel industry in Indonesia”, Journal of Intelligence Studies in Business, 8(2), 77-84, 2018.

