
Proposal Methodology of Planning and Location of Loading/Unloading Spaces for Urban Freight Vehicle: A Case Study
Volume 4, Issue 5, Page No 273-280, 2019
Author’s Name: Moufad Imanea), Jawab Fouad
View Affiliations
Laboratory of Production, Energy & Sustainable Development (LPE2D), Sidi Mohamed Ben Abdellah University, Higher School of Technology (EST) Fez, Morocco.
a)Author to whom correspondence should be addressed. E-mail: imane.moufad@gmail.com
Adv. Sci. Technol. Eng. Syst. J. 4(5), 273-280 (2019); ![]() DOI: 10.25046/aj040534
DOI: 10.25046/aj040534
Keywords: Urban logistics, Urban freight vehicles, Loading/unloading areas, Location, Planning

Export Citations
The problem of planning and location of loading/unloading (L/U) areas attracting interest from several researchers. This is mainly because of the heterogeneity of information and the great complexity of logistics flows. Among the projects of the urban logistics in Morocco, the L/U areas represent an essential importance in the deliveries to the centers of the agglomerations. In light of this context, this work proposes a methodology for planning and location of L/U spaces for urban freight vehicles taking a commercial street in Morocco as a case study. Therefore, the proposed framework details the different steps of planning of L/U areas since the elaboration of the commercial map of the study area until the phase of sizing and location. Then, we study the applicability of this system, making a detailed proposal of the physical arrangements will be put in place, and the principle of spatial and temporal organization of deliveries, aiming at the best match between available supply and demand.
Received: 08 August 2019, Accepted: 07 September 2019, Published Online: 08 October 2019
1. Introduction
The urban freight transport (UFT) is an important activity that accounting for 15% to 20% of urban mobility [1, 2]. Thinking about UFT also means thinking about the organization of urban space, business development, the environment and people’s quality of life. The arbitration between the different components of UFT and the uses of roads is particularly complex [3, 4].
Indeed, the road network and the public space represent a place of conflict between the UFT vehicles and other urban activities, particularly in mixed residential and commercial quarters. This conflict results in congestion, illegal parking and accidentality. Hence the better management of the organization associated with UFT vehicles is much needed. In this context, delivery areas represent a real opportunity in urban areas to facilitate the delivery/pick-up of UFT vehicles, ensure accessibility to delivery drivers, and reduce congestion [5].
In light of this context, this work proposes a methodology for planning and location of L/U areas in the case of a commercial street in Morocco. Our article begins with a state of the literature in order to understand the problem of organizing the transport of goods in the city in relation to the concept of L/U areas. The knowledge of theoretical and empirical work will give the efficacy to our work. The second step is to consolidate these achievements by proposing an approach in which we successively describe the different stages of preparation for the implementation of the L/U spaces. The next step will take the case of a commercial street in Morocco for the implementation of the proposed approach. We present the results obtained in this way.
2. Background
The terminology for loading/unloading areas has not standardized: delivery area, service area, or even, on some panels, stop minute can designate these spaces [6,7]. These spaces represent a stopping point for vehicles loading or unloading the goods [9]. They are located on public roads, usually in front of shops, supermarkets, restaurants or grocery stores. The term “stop” means the momentary stopping of a vehicle on a road for the time necessary to allow the loading or unloading of the freight vehicle [9].
There are many authors in the literature that focus on identifying best practices in the location and improvement of L/U spaces. In 2009, the French Center for Studies on Networks, Transportation, Urban Planning and Public Construction (CERTU[1]) published a guide on planning these spaces that provides a rough quantification of delivery area requirements, and a set of recommendations to improve their management.
In the same way, [7-9] proposed an approach to designing and operating the delivery areas stating the steps to achieve that.
In addition, [10] proposed the Monte-Carlo method to simulate the operation of L/U areas. We also refer to [11] who proposed the combination of two models (FRETURB & DALSIM) allowing the dimensioning and the allocation of the delivery zones by taking into account the impacts on the flows of global traffic and give an example of implementation in the city of La Rochelle.
In addition, [12] proposed a hybrid method between the FRETURB model and the CERTU method to quantify the demand for delivery areas. Even more, [13] proposed technical solutions to improve the number and locations of delivery spaces with a practical application on the city of Bologna in Italy.
The concept of delivery areas has also been studied by [8] who proposed a set of policy recommendations to increase the availability of these spaces by taking New York City as a case study. The authors [14] studied the concept of reservation and control of delivery areas in the case of a shopping street. They proposed a number of operating scenarios based on punctual deliveries and pickups, using a comprehensive database of UFT traffic and parking conditions.
Other relevant contributions to this area don’t necessarily address all the design and layout practices of the L/U spaces but focus on the location and improvement of these spaces. In this sense, [15-17] assessed the impact of changing the number and location of delivery areas on the level of illegal parking practices. The authors in [18] developed for the case of the city of Seville, a model for optimizing the location of delivery spaces by evaluating the effect on the cost of the delivery system. In addition, [4] have developed a model for assessing and optimizing the location of delivery areas based on meeting the logistical needs of commercial establishments associated with the frequency of goods movements generated in the study area.
From the same angle, [19] addressed the problem of location of parking areas. They proposed a model to sample the arrival intervals and service times of trucks using these areas.
Finally, in another contribution, we find [20] who proposed, in their project Future Delivery Area, a new concept of operation of delivery areas based on the principle of prior booking by delivery drivers managed by a delivery information system. In addition, the same principle has been studied by [21] introducing the environmental parameter within the reservation of delivery areas.
According to this literature review, we conclude that existing research on the organization of urban freight transport across delivery areas is rich and can be divided into two parts. On the one hand, there is the theoretical and empirical work that has proposed methods for the design and operation of delivery areas in several stages. On the other hand, some works have not focused entirely on organizational practices but rather on the study of the impact of implementation or change of the configuration of delivery spaces on mobility, congestion and anarchic parking practices.
3. Proposed methodology
Indeed, a good management of the traffic and the parking of the vehicles of the UFT pass by a good management of the delivery areas in order to adapt the supply of areas to the demand of displacements [4]. To do this, it is necessary to know this demand exhaustively, which means: who? (What type of trade); When? (Critical time slots); What? (Type of vehicle that serves the trade); and how much? (Frequency of deliveries / pick-ups) [22,23].
Based on the theoretical and empirical work that we discussed previously, we propose an approach through which we address all the steps of the planning and the location of the delivery spaces in study area (Figure 1).
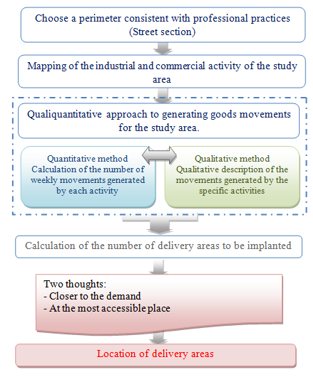 Figure 1: Proposed methodology of planning and location of L/U spaces.
3.1. Step 1: Choice of the study area
Although the delivery area development guide proposed by Certu1 declares that there is really no minimum quota regulating the creation of delivery areas, we can remember that the implementation of a first delivery area can be done from 50 weekly movements [4-7]. Therefore, the study area must represent a living pond both functionally (employment, daily mobility) and economically (activity and product exchange basin) [21]. It should be in a densely populated area [3]. Given that the cost and time are required to carry out this type of study, it is necessary to proceed to a specification of the study area in order to guarantee a good representation of the commercial activity, which will serve as a basis for extrapolating the studies and hypotheses of movement generation at other study areas [6]. Thus, the area under study should allow us to observe, understand and measure how the UFT participates in the occupation of the road.
3.2. Step 2: Development of commercial and industrial mapping of the study area
This step consists of identifying the movements of all industrial and commercial activities in the study area [16]. Since it is a movement mapping, it must later allow a spatial presentation of the study area. By indicating the commercial typology on a background, it will be possible to identify traffic areas by activities, and thus give these zones characteristic movement generation ratios.
3.3. Step 3: Generation of movements
This step consists of determining the generation of goods movements through the census and the observation of the logistic functioning of all the industrial and commercial activities. According to [4,9,11,13,19] a movement generation study is based on two complementary methods: a quantitative method and a qualitative one. The prioritization of one method over the other is not specified in the above-mentioned works.
Quantitative method
This method is based on the criterion of movement ratio. From the commercial survey of the study area, it is necessary to define
an average coefficient of movements generated per week for each type of activity. Thus, it has been shown that the average number of movements generated by a point of sale is strongly correlating with the type of activity exerted by this point of sale [15,9,19]. Therefore, the number of delivery areas is calculated from the following relation1:
Theoretical number of loading/unloading areas =
(∑Number of activities by type × ratio of Mvts) / (1)
(∑Mvts generated by a delivery area with full potential)
*(Mvts: Mouvements)
Indeed, the knowledge of the movements generated per week and by typology makes it possible to establish the total number of movements generated in a given perimeter. Therefore, the theoretical number of delivery areas can be obtained by dividing this total by the average number of weekly movements that can be processed by L/U area used to its full potential. This theoretical number represents a first estimate of the need in the delivery area. The subsequent conduct of a field survey at the local level is necessary to refine the results obtained.
Qualitative method
This method is based on the results of field observations. It concerns the types of activities that are the subject of a qualification of their main characteristics as generators of movements of goods. Example of car dealers, banks … etc.
In Table 1, we describe the characteristics and logistic functioning of this type of activity [6]: mapping of the movements generated at the level of the study area. However, as with many design principles, it is desirable to know the maximum stress to determine the provisions that will be implemented [9]. To refine this constraint, the motion analysis stage provides qualitative information on the nature of the movements generated according to the commercial typology [4].
Table 1 : Qualitative description of the movements of activity
| Activity | Characteristic |
Logistic operation |
| Coffee shops | Most of the time, this type of establishment receives daily delivery by specialized wholesalers. These long and bulky deliveries require proximity to the trade. | · One delivery per day· Long and bulky· Heavy weights |
| Department stores | Most of these establishments have integrated supply logistics (their own delivery areas and do not use those in the public space). However, some of them do not have private delivery areas. | · Several deliveries a day.· Integrated Supply Logistics.· Heavy weights |
| Car dealers | This type of establishment causes many problems during delivery such as street blocking. Most of the time, the delivery is done with an appointment. |
· Very bulky · Delivery often taken with appointment. |
| Banks | This type of establishment requires specific treatment. In most cases, there is a reserved space for parking. | · Various movements per day· Requiring a specific parking space. |
| Pharmacies | This type of establishment is subject to frequent deliveries during the day, but these deliveries are generally short-term. It is therefore not always necessary to consider them, as the delivery areas are rarely used for such short stops. | · Frequent deliveries· Short term (2minutes) |
| Tertiary service | This activity class mainly generates small delivery or removal movements by courier companies. These movements happen on a daily basis and spread over the entire working period. |
· Small movements. · Daily movements spread over the entire work period. |
From these two complementary methods and information collected in the field, it is possible to draw up an effective
3.4. Step 4: Movements analysis
This stage of the diagnosis aims to determine the critical characteristics allowing the good dimensioning of the arrangements and the good logistic operating of the operations of deliveries / pick-ups in the study section. This is to describe the nature of the movements by type of business, specifying in particular the typology of vehicles and the handling tool. The necessary data for this step are [7-15]:
- The duration of the movements to define an average rotation rate and, apriority, the number of delivery areas required to ensure demand [24].
- The type of vehicles used to define the right-of-way of the delivery areas. The classification of vehicles can be done according to several criteria [4].
- PTAC: This is the authorized loaded weight. It represents the maximum authorized mass for a road vehicle as stated in the Highway Code. It includes the weight of the unladen vehicle, the maximum load of goods and the maximum weight of the driver [25]. This criterion classifies the freight vehicles into two categories: light utility vehicles (LUVs) with a PTAC of less than 3.5 tones and heavy vehicles (HV) with PTAC greater than 3.5 tones.
- Dimension: This includes the length and width of the vehicle as well as the floor area (length × width). These data are necessary for the size of the delivery areas.
- Handling tool used by the type of vehicle and the type of movement (pick-up or delivery). These data make it possible to approach the part of movements and vehicles requiring a handling tool. They provide an indicative image for the logistical diagnosis that serves as a guide for the layout of delivery areas in order to facilitate handling operations [21].
3.5. Step 5: Location of loading/unloading areas
This step is based on the analysis of accessibility [20]. From the traffic and parking conditions of goods transport vehicles, it is necessary to define the level of accessibility to the signs or service point. As a result, the analysis of accessibility is carried out on two levels: superficial analysis and specific analysis [4-18].
The first one indicates that the location of the loading/unloading area must be must determine in such a way that a parking management is sufficient to clear space for deliveries, and located in a way so as not to impede the visibility of users (professionals and particular) on other signaling equipment (bus area, signs, traffic lights …) [11].
In the superficial analysis stage, the level of accessibility is roughly quantified at each point on the sidewalk, but without taking into account the differences between these points, that is to say [24]:
- How many movements do they generate?
- At what times of the day do they generate them?
- What types of vehicles serve them?
- Which handling tools use the freight vehicles?
- What is the time required for each of these deliveries?
4. Case study
4.1. Presentation of study area
Our choice was focused on the city of Fez as a case study. It is the second largest city in Morocco after Casablanca with a population of 1.1million in 2014[2]. The city accounts for nearly 62%[3] of the industrial fabric of the Fez-Meknes region, occupies a privileged place in the national industrial fabric and contributes to the socio-economic development of the region and consequently of the country.
As previously stated, the quantification of the need for loading/unloading areas must be carried out on a coherent perimeter representative of a high commercial density. Therefore, we chose the Mohammed Zerktouni Street as a case study. It is a single-store residential and commercial street (that is, one-way traffic) that stretches for 600 m. Located in the city center, the street begins with the entrance “Atlas” and ends with an exit to Avenue Mohammed Esslaoui. We divided this avenue into four sections. Considering the cost and the time of realization of this kind of study, we decided to carry out the survey on section 1.
The figure 2 presents the study area:
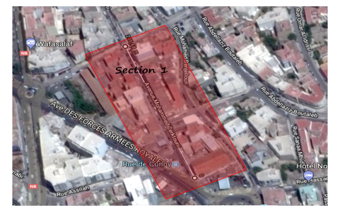 Figure 2: The study area –Mohammed Zerktouni Street
The study zone extends over a length of 205 m from the main entrance of Mohammed Zerktouni Street to the “Patrice LEMOMBA”. Indeed, this part is characterized by the existence of two inputs and two outputs. At 95 m from the main entrance, there is a two-way road (Entrance / Exit) through which the vehicles of urban freight transport transit at the Mohammed Zerktouni Street. Thus, the width of the section is about 8 m; the municipality has reserved 2m on both sides for parking. This means that it is indeed a narrow commercial street.
In Figure 3, we have illustrated all the dimensions of section 1.
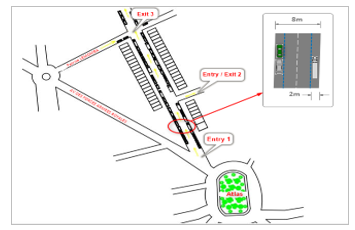 Figure 3: Study area layout
4.2. Mapping of commercial and industrial movements of the study area
To elaborate the mapping of the commercial and industrial movements of the study section, we conducted a survey that spanned a period from mid-November 2017 to the first week of April 2018. Through which, we will observe, understand and measure how the urban freight vehicles participates in the occupation of roads. This is a two-part inquiry. The first part concerns all the field visits carried out in order to understand the logistic operation, to identify the problems and to draw up the survey of the commercial and industrial typology of the study area. Through the field visits, we developed the commercial and industrial mapping of the study area (Figure 4):
 Figure 4: Mapping of commercial and industrial activity of the study area.
4.3. Quantification of the number of loading/unloading spaces
In this step, we have conduct a survey on the study area, in order to calculate the number of loading/unloading areas through the estimation of weekly movements generated by each establishment (Table 2).
According to the results of the survey, 60% of deliveries are making between 8:00 a.m. and 12:00 noon. Thus, a loading/unloading area can process an average of four deliveries per hour [22], bearing in mind that the commercial activity is
Table 2: The movements generated by industrial and commercial activities in the study area
| Monday | Tuesday | Wednesday | Thursday | Friday | Sunday | Sum of movement per week | Number of service points | Average of movements generated per week / point of service | Mvts / point of service (Rounded to the next integer) | |||
| Activity | ||||||||||||
| Services (Bank, Offices, Gas Station) | 8 | 7 | 2 | 6 | 3 | 6 | 32 | 11 | 2,9 | 3 | ||
| General drugstore | 14 | 12 | 4 | 12 | 6 | 16 | 64 | 10 | 6,4 | 6 | ||
| Warehouse | 3 | 3 | 1 | 2 | 0 | 2 | 11 | 1 | 11 | 11 | ||
| Industrial & hydroelectric equipment | 7 | 5 | 3 | 6 | 2 | 8 | 31 | 4 | 7,8 | 8 | ||
| Building Materials (Wood, Cement) | 2 | 1 | 1 | 2 | 1 | 2 | 9 | 1 | 9 | 9 | ||
| Ceramic, Marble & Granite | 4 | 3 | 1 | 3 | 2 | 3 | 16 | 3 | 5,3 | 5 | ||
| Grocery | 2 | 2 | 1 | 2 | 2 | 2 | 11 | 1 | 11 | 11 | ||
| Car accessories | 1 | 1 | 0 | 1 | 1 | 1 | 5 | 1 | 5 | 5 | ||
| Sanitairy | 3 | 2 | 0 | 1 | 1 | 2 | 9 | 2 | 4,5 | 5 | ||
| Electric tools | 13 | 11 | 3 | 11 | 3 | 14 | 55 | 8 | 6,9 | 7 | ||
| Ferrous materials | 2 | 1 | 0 | 1 | 0 | 2 | 6 | 1 | 6 | 6 | ||
| Automatic Electronics and Computer Equipment | 2 | 1 | 0 | 2 | 0 | 3 | 8 | 1 | 8 | 8 | ||
| TOTAL | 61 | 49 | 16 | 49 | 21 | 61 | 257 | TOTAL | 83,8 | 84 | ||
carried out 6 times a week. Therefore, a delivery area can handle 6 * 16 deliveries, even 96 deliveries a week between 8h and 12h. Therefore, the number of loading/unloading spaces can be obtained by summing the weekly movements generated by each establishment (257 mouvements) and then dividing by the average number of weekly movements that can be treated by a loading/unloading area in its full potential. Therefore, the frame study zone requires the development of three loading/unloading areas as following:
Number of loading/unloading areas = 257/96 3 (2)
However, it is important to know the conditions of movement generation to determine the provisions that should be implemented. The motion analysis part thus makes it possible to refine this constraint.
4.4. Movement Analysis
This step aims to determine the critical characteristics allowing the good dimensioning of the arrangements and the good logistic operating of the operations of deliveries / pick-ups in the study section. This is to describe the nature of the movements by type of business, specifying in particular the typology of vehicles and the handling tool.
We started with the typology of the vehicles borrowing the perimeter of study. From the field visits that we have made, we distinguish between four categories: Motorcycle & tricycle, cars, light utility vehicles (LUVs) and heavy vehicles (HV).
In figure 5, we present the results obtained from the survey about the use of these categories of vehicles according to the type of activities present in the study area:
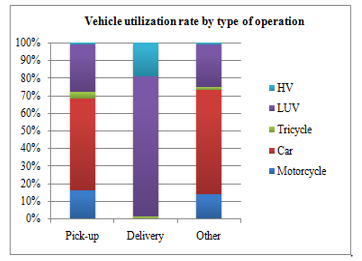 Figure 5: Distribution of mouvements by vehicle type.
The presence of heavy vehicles is a determining factor for the sizing of loading/unloading areas. The figure 5 show that 80% of deliveries operations are made by LUVs and 19% by trucks. The LUVs represents the category of vehicles with a length between 6 and 8 meters. The HV vehicles represents the category with a length between 8m and 15m. To ensure easy access to the area, the recommended dimensions are 12 to 15 meters in length and 2.20 to 2.50 meters in width for the size of the area [23].
The second point of analysis concerns the duration of the movements. It determines the possible turnover rate per loading/unloading area. The figure 6 shows the distribution of the duration of movements by type of movements:
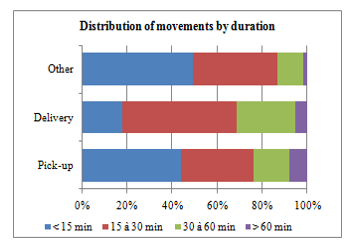 Figure 6: The distribution of the duration of movements by type of vehicle
By interpretation, more than 50% of pick-ups movements last more than 15 minutes. While 60% of delivery movements less than half an hour. The movements that last between 30 and 60 min represent mostly deliveries. For other types of operation, 90% do not exceed 30 minutes. Based on these results, the possible turnover rate per loading/unloading area is between 15min and 30 minutes.
Concerning the handling tools, the results of the survey show that 65% of the movements realized by the trucks lead to a devil, trolley and pallet truck that represents 30%. The figure 7 summarizes the results obtained:
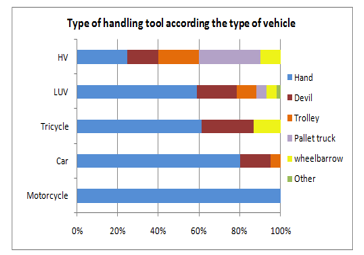 Figure 7: Use of handling tools by type of vehicle
For the LUVs, 60% of the movements are done by hand and 40% by devil, trolley, pallet truck and wheelbarrow. These data are essential for a good adaptation of the offer in delivery areas on demand.
For this, the lowering of the sidewalk for part of the area is important to facilitate handling operations.
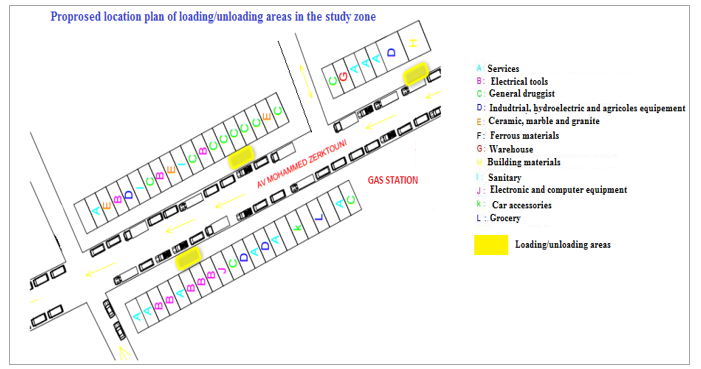 Figure 8: Location plan of loading/unloading areas in the study zone
4.5. Location of loading/unloading spaces
As mentioned earlier, the location of L/U areas is based on two types of analysis. On the one hand, the superficial analysis means that the location of the delivery area must be close to the shops receiving the highest frequency of deliveries and / or next to the activities giving rise to an important part of handling tools[4-18]. From the movement’s analysis stage, we have an idea about the movements generated at each point of the study area. This information allows for a real assessment of the accessibility of driver-delivery drivers and a determination of areas likely to generate conflict.
In the case of the study area, this section represents the example of a narrow street with a strong single-line commercial activity lined by two parking lanes on both sides of 2m wide.
Therefore, it is interesting to drill a marked delivery area (that is to say on the sidewalk) since the left sidewalk is wide for (4m) and has no tree planting, and the other two straight half-notches (which means that is between the floor and sidewalk) since it measures 2.5m in width.
On the other hand, the specific analysis makes it possible to consider the typology of vehicles and handling tools in the location of L/U areas. Therefore, the location of the three loading/unloading areas must be close to the shops receiving the highest frequency of deliveries and / or next to the businesses giving rise to handling.
In our case, these are mainly: Building materials, general hardware, electrical tools, industrial, hydroelectric and agricultural equipment.
The figure 8 shows the location plan of the loading/unloading areas taking into consideration all of these elements:
5. Conclusion
In this article, we have proposed a methodology for planning and location of the loading/unloading spaces. Thus, we have presented all the works that dealt with the problem of design and location of these spaces. Based on this literature review, we have detailed all the steps of our methodology from the choice of the study area to the stage of location plan.
As a case study, we chose to deploy these steps in a commercial street in Morocco. It is the Avenue Mohammed Zerktouni of the city of Fez.
According to the results of the survey, 60% of deliveries are making between 8:00 a.m. and 12 noon, and the movements generated by each establishment are 257 mouvements. For this, the frame study zone requires the development of three loading/unloading areas.
In addition, we have described and presented in the movement’s analysis step the nature of the movements by the type of vehicles, duration of movements and the handling tool in order to determine the critical characteristics allowing the good dimensioning and location of the L/U areas in the study section. Therefore, the location of the three L/U areas must be close to the activities receiving the highest frequency of deliveries and / or next to the activities giving rise to handling. In our case, these are mainly: Building materials, general hardware, electrical tools, industrial, hydroelectric and agricultural equipment.
The main contribution of this work is to propose an approach that decision-makers (especially local authorities) can easily apply to capture urban needs quickly and efficiently and thus allow for simple replication of the proposed framework in other cities.
As a perspective, an assessment of the impact of the location of loading/unloading areas on traffic flow will be the subject of future contributions. The objective is to evaluate how much L/U activities on the road affect traffic conditions that cause traffic congestion.
Conflict of Interest
The authors declare no conflict of interest.
- L. Dablanc, G. Giuliano, K. Holliday, T. O’Brien “Best Practices in Urban Freight Management: Lessons from an International Survey” Transportation Research Record, 2379, 29–38, 2013. https://doi.org/10.3141/2379-04
- I. Moufad, F. Jawab, “A study framework for assessing the performance of the urban freight transport based on PLS approach” Archives of Transport, 49(1), 87-98, 2019. https://doi.org/10.5604/01.3001.0012.8368
- I. Moufad, F. Jawab, “Conception and Validation of a Decision Support Model for Urban Freight Transport” In IEEE International Colloquium on Logistics and Supply Chain Management (LOGISTIQUA), 94-99, 2017. https://doi.org/10.1109/LOGISTIQUA.2017.7962880
- R. Pinto, R. Golini, A. Lagorio, J. Gonzalez-Feliu, C. Ambrosini, P. Pluvinet, M. Serouge, “Loading/unloading lay-by areas location and sizing: a mixed analytic-Monte Carlo simulation approach”, IFAC-Papers Online, 49(12), 961–966, 2016. https://doi.org/10.1016/j.ifacol.2016.07.900
- I. Moufad, F. Jawab, “The Determinants of the performance of the Urban Freight Transport – An Empirical Analysis” In IEEE International Colloquium on Logistics and Supply Chain Management (LOGISTIQUA), 2018. https://doi.org/10.1109/LOGISTIQUA.2018.8428296.
- M. Laurence, “The delivery area: Its use, its users, the principles of development”. CERTU, 1-5, 2013.
- J. L., Reynaud, “Design and operation of delivery areas”, 2015.
- M. Browne, J. Allen, A. Woodburn, D. Patier, J.-L. Routhier, C. Ambrosini, M. Jaller, “Comprehensive Freight demand Data Collection Framework for Large Urban Areas” Journal of Chemical Information and Modeling, 1-13, 2014. https://doi.org/10.1007/978-3-642-31788-0_6
- W. Debauche, “Delivery areas: for what, how much, where, how ?” In Centre de recherche routières (Ed.), INFRA. Quebec, 2015.
- A. Gaudron, S. Tamayo, A. De la Fortelle, “Simulation de l’utilisation des aires de livraisons en ville par la méthode de Monte-Carlo” In Les rencontres de la mobilité intelligente, 24-25 January, Paris, France, 2018.
- L. Delaître and J. L. Routhier, “Mixing two French tools for delivery areas scheme decision making” Procedia – Social and Behavioral Sciences, 2(3), 6274–6285, 2010. https://doi.org/10.1016/j.sbspro.2010.04.037
- M. Gardrat and M. Serouge, “Modeling Delivery Spaces Schemes: Is the Space Properly used in Cities Regarding Delivery Practices?” Transportation Research Procedia, 12, 436–449, 2016. https://doi.org/10.1016/j.trpro.2016.02.077
- G. Dezi, G. Dondi, C. Sangiorgi, “Urban freight transport in Bologna: Planning commercial vehicle loading/unloading zones” Procedia – Social and Behavioral Sciences, 2(3), 5990-6001, 2010. https://doi.org/10.1016/j.sbspro.2010.04.013
- F. McLeod and T. Cherrett, “Loading bay booking and control for urban freight”, International Journal of Logistics Research and Applications, 14(6), 385-397, 2011. https://doi.org/10.1080/13675567.2011.641525
- A. R. Alho, J. de Abreu e Silva, de Sousa, J. P., E. Blanco, “Improving mobility by optimizing the number, location and usage of loading/unloading bays for urban freight vehicles” Transportation Research Part D: Transport and Environment, 61, 3-18, 2016. https://doi.org/10.1016/j.trd.2017.05.014
- A. Alho, J. de Abreu e Silva, J. P. de Sousa, “A state-of-the-art modeling framework to improve congestion by changing the configuration/enforcement of urban logistics loading/unloading bays” In 16th Meeting of the EURO Working Group on Transportation, Procedia – Social and Behavioral Sciences 111, 360-369, 2014. Doi: 10.1016/j.sbspro.2014.01.069
- A. Comia, B. Buttarazzi, M.M. Schiraldi, R. Innarella, M. Varisco, L. Rosati, “DynaLOAD: a simulation framework for planning, managing and controlling urban delivery bays” In the 19th EURO Working Group on Transportation Meeting, Istanbul, Turkey, Transportation Research Procedia, 22, 335–344, 2017. 10.1016/j.trpro.2017.03.049
- J. Muñuzuri, P. Cortés, R. Grosso, J. Guadix, “Selecting the location of minihubs for freight delivery in congested downtown areas” Journal of Computational Science, 3(4), 228–237, 2012. https://doi.org/10.1016/j.jocs.2011.12.002
- R. Pinto, R. Golini, A. Lagorio, J. Gonzalez-Feliu, C. Ambrosini, P. Pluvinet, M. Serouge, “Loading/unloading lay-by areas location and sizing: a mixed analytic-Monte Carlo simulation approach”, IFAC-Papers Online, 49(12), 961–966, 2016. https://doi.org/10.1016/j.ifacol.2016.07.900
- D. Patier, B. David, R. Chalon, & V. Deslandres, “A New Concept for Urban Logistics Delivery Area Booking.” Procedia – Social and Behavioral Sciences, 125, 99-110, 2014. https://doi.org/10.1016/j.sbspro.2014.01.1459
- L. Ramoneda Cuenca, “The problem of the last kilometer in Paris intra-muros. Introduction of the environmental parameter in the reservation of delivery areas”. Polytechnic University of Catalunya, 2014.
- T. Baudel, L. Dablanc, P. Alguiar-Melgarejo, J. Ashton, “Optimizing Urban Freight Deliveries: From Designing and Testing a Prototype System to Addressing Real Life Challenges” Transportation Research Procedia, 12, 170–180, 2016. https://doi.org/10.1016/j.trpro.2016.02.056
- N. Aiura, E. Taniguchi, Planning on-street loading-unloading spaces considering the behaviour of pickup-delivery vehicles. In R. G. Thompson, & E. Taniguchi (Eds.), Recent advances in city logistics Oxford: Elsevier, 2006.
- P. Barette, M. Thoulen, E. Caelen, “Organization of road deliveries” The Mobility and Road Safety Monitor’s notebooks, 8, September, 2012.
- Piarc. “Guide for setting up a road freight management system in an urban environment”, 2012.