
Transformation of Solar Energy to Electricity with Photovoltaic Systems, Reduction of Electrical Consumption and Installation of LED Lamps in the ITSAO
Volume 4, Issue 5, Page No 234-242, 2019
Author’s Name: Jeremias Bravo Tapiaa), Juan José Rivera Toledo, Francisco Ramos Guzmán, Yoxkin Estévez Martínez
View Affiliations
Instituto Tecnológico Superior de Acatlán de Osorio, División de la Carrera de Ingeniería Electrónica, Carretera Acatlán-San Juan Ixcaquixtla Km. 5.5 Unidad Tecnológica C. P. 74949, Acatlán de Osorio, Puebla, México.
a)Author to whom correspondence should be addressed. E-mail: jrmsbt@hotmail.com
Adv. Sci. Technol. Eng. Syst. J. 4(5), 234-242 (2019); ![]() DOI: 10.25046/aj040529
DOI: 10.25046/aj040529
Keywords: Electricity consumption, LED lamps, Photovoltaic system, Solar planter

Export Citations
In this work of technological development and research is presented the work done in the ITSAO to contribute to the use of clean energy such as photovoltaics and the implementation of activities to reduce electricity consumption by the technological community, the monitoring of electricity consumption is made on a monthly basis and an annual report is prepared in which the consumption monitoring and the reduction percentage thereof are shown by tables and graphs. The students of electronic Engineering carry out activities of optoelectronics and sustainable development where they intervene with the design and installation of photovoltaic systems that are part of their academic formation. It has a photovoltaic system that produces 2.16 kW-h / d and another will be installed to have photovoltaic energy in the tables of the ITSAO planters; these actions are part of the operational control related to the energy of the Integral Management System (SGI).
Received: 16 June 2019, Accepted: 26 August 2019, Published Online: 08 October 2019
1. Introduction
This paper is an extension of work originally presented in 2018 XXXI International Summer Meeting on Power and Industrial Applications (RVP-AI) [1] off the IEEE Sección México; in the Instituto Tecnológico Superior de Acatlán de Osorio, Puebla, México; work continues with the development of projects related to the saving of electrical energy with renewable energy applications and the replacement of fluorescent tube lamps by LED’s lamps; this is how the Academy of Electronic Engineering has intervened in the installation and replacement of LED’s tube lamps.
In [2] it presents a work aimed at reducing the consumption of electrical energy delivered by the conventional electricity network, through the use of photovoltaic solar energy. It is proposed the design of an electronic transfer system that facilitates the use of DC electric power from the solar panel, thus eliminating the use of the voltage inverter, commonly used in this type of applications and which increases the cost of the use of solar energy.
Alternative energies have always been present in the daily life of humanity, although their existence has often been unknown because of the need to put the economic over the environmental benefit. In addition to being free, they are clean and protective of the environment [2]. It is necessary to implement an adequate ecological culture in the present generations so that it contributes to the care of the global environment and in this way the new generations are already developed in an environmental system from which it will no longer be necessary to learn to adapt to the environment.
Currently as an example of the application of energy efficiency is in a house at least there is a device that requires the use of electrical energy for its operation, so in some cases there is a high demand and even waste of energy, when there is a considerable amount of these consumer elements, it affects the areas of the rural sector and certain cases of a greater proportion of electricity consumption, because although they have subsidized rates, they suffer increases in costs, thus paying the demand for generated consumption by other sectors, without worrying about the high value in the payment of the energy service. [2].
The study of renewable energies is currently presented as a very useful tool, due to the scarcity of conventional energy sources that have been exploited for several years, without thinking that this would lead humanity to a point where those resources would be exhausted [2]. This allows the development of research for the generation of electricity from clean energy sources in small, medium and large-scale production.
Energy efficiency is a primary consideration when designing off-grid renewable energy systems including portable micro-grids. This study focuses on characterizing the potential benefits associated with using energy-efficient exterior area lighting commonly associated with remote installations. Light-Emitting Diode (LED) luminaires are becoming more commercially available, and this study compares two LED products designed for exterior lighting to traditional metal halide lamps. The energy efficiency benefit of the LED luminaires is offset by their lower illuminance. However, a comparison of lighting standards for specific purposes such as security lighting indicates that LEDs may be appropriate for applications where a metal halide system would provide significantly more illumination than required at a much higher energy cost [3].
Measures to improve energy efficiency in small and medium enterprises do not apply due to financial reasons, lack of information and limited internal skills. Suggested information measures, audits, capacity building. As potentially effective measures to support the implementation of energy efficiency measures. Companies in Austria, Bulgaria, Cyprus, Italy, Romania, Slovakia and Spain have identified and implemented a wide range of energy efficiency measures, which in part consist of no-cost options, but are also partly innovative technical solutions [4]. This must be implemented throughout the world starting from our home to be able to impact the environment around us.
Energy efficiency has a vital part to play in all future energy scenarios. Improved energy efficiency limits energy demand growth to one-third by 2040 even though the global economy grows by 150%. Energy policy has traditionally been almost entirely concerned with energy supply and most often focused on the electricity system. The close link between electrification and modernization has given the electricity supply industry in all countries a strong political voice. Energy efficiency, energy conservation or “energy savings” has tended only to be given a high priority in times of crisis, when energy prices are particularly high or when economies face electricity shortages. This was most notable during the “oil crises” of the 1970s. Until recently, energy efficiency policy has always had a lower priority in energy policy development compared to energy supply [5].
All the energy used is ultimately to meet human needs. Natural gas is not burned to heat the room in which one lives by simply heating, but it is done to feel comfortable in that room. Energy is used to produce the materials that are needed to make consumer goods, for example, steel is produced to make cars, paper for printing books and fertilizers to grow more food so as not to be hungry. Energy is not a necessity in itself, it is one of the goods used to meet human needs that can be realized through the use of energy called energy services. [6].
Energy consumption in homes and buildings is large and, in the future, it tends to be unsustainable for our planet, both due to the depletion of natural resources and the irreversible damage it causes to the ecosystem. To help the sustainable development of Humanity it is essential to create an energy education that allows, without waste, continue using fossil fuels for the development of new energy technologies more efficient and in harmony with the environment. The option of renewable energies offers an alternative to achieve a social development that tends to the ecological and that in the future an economic benefit is obtained as well. The energy obtained from photovoltaic panels, specifically the Sun Irradiance, is proposed as an aid to minimize energy consumption in both houses and buildings. Currently, photovoltaic energy is still not profitable, but it seems to be the most viable option until now to solve the great problem of generating electricity without using fossil fuels [7].
The photovoltaic parks have taken great importance as renewable energy generation systems in individual buildings integrating from the design of the building involving the architecture and installers of photovoltaic systems; thus, the photovoltaic industry is a technology that is already included in the architectural design process [8], [9] & [10].
In ITSAO, a photovoltaic system will also be implemented in the gardens of the esplanade so that the technological community has the possibility of connecting their electronic equipment such as laptops and mobile devices outdoors on the rest tables.
2. Determination of solar radiation.
For the development of the photovoltaic part there is location data of the ITSAO in Google Maps [11]. Data provided by NASA corresponding to the solar radiation received by the solar panels, the hours of solar radiation were used to calculate the design of the battery bank and the temperature to see the performance of the solar panels [12].
The coordinates of the location of the ITSAO at a latitude of 18.226883 and a longitude of -98.040143 are shown in Figure 1 a). Figure 1 b) shows the location coordinates on the NASA platform in Prediction of Worldwide Energy Resource Prepare.
Next, Figure 2 shows the data that must be identified for the calculation and design of the photovoltaic system as the minimum radiation for solar panels inclined towards Ecuador, the days without sun in a month to determine the size of the battery bank and the maximum and minimum temperature at two meters high.
Figure 3 a) shows the behavior of the monthly days without solar radiation to add the days of autonomy in the design of the size of the battery bank, in Figure 3 b) the maximum temperature is shown and in Figure 3 c) the minimum temperature is shown at two meters high. this to determine the efficiency behavior of solar panels that depend on the temperature.
One of the very important parameters for the sizing of photovoltaic systems is the solar radiation that is received in the place of the installation of the solar panels, for this data is taken provided by NASA that as mentioned above are reliable data to work sizing, performance, days of autonomy and storage capacity.
Figure 4 shows parameters the solar radiation values in the ITSAO; days without sun, maximum temperature, minimum temperature; in blue are the radiation data for different inclinations are monthly data and an annual average.
Figure 5 shows the optimal peak solar radiation hours (HSP) to calculate the size of the sizing of the photovoltaic system on a monthly and annual basis; The annual average is 5.87 HSP with this the daily production that a solar panel will have is calculated according to its power provided by the manufacturer.
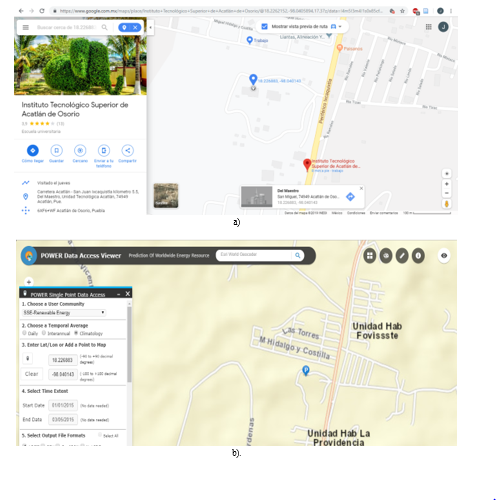 Figure 1: Location coordinates of ITSAO. a) Google maps [11]. b) NASA platform [12].
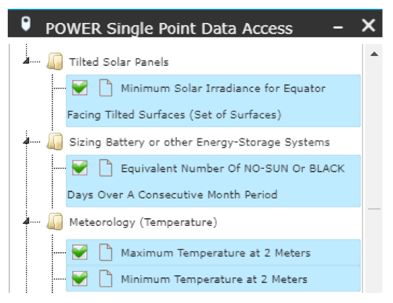 Figure 2: Solar radiation data and temperature [12].
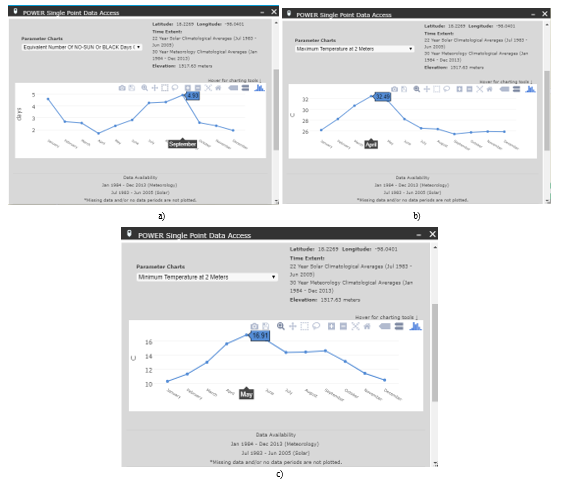 Figure 3: Parameter graphs for calculating photovoltaic systems, a) days without solar radiation,
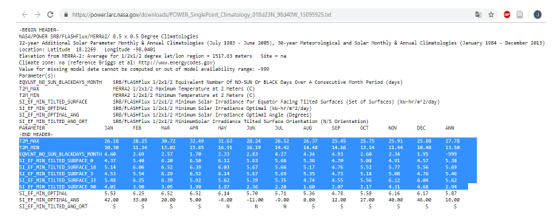 Figure 4: Monthly solar radiation parameters in the ITSAO [12].
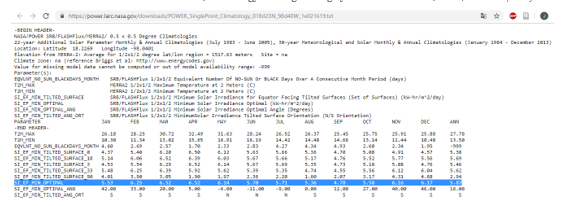 Figure 5: Average monthly solar radiation in the ITSAO [12].
It is possible to determine that there is an annual average of 5.87 hours of minimum solar radiation equivalent to 5.87 kWh/m2/day. For the photovoltaic calculations applying the rounding, 6 hours of solar radiation are considered.
3. A photovoltaic system installed with LED lamps.
It has a photovoltaic system installed with three 120 W solar panels giving 360 W-h between the three with a daily output of 2.16 kWh/d taking into account 6 hrs of solar radiation for this region. Figure 6 shows the module installed with the three solar panels.
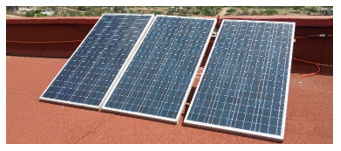 Figure 6: Photovoltaic module installed in the ITSAO.
The battery bank is formed by 4 batteries from 12 V to 100 A each allowing a storage capacity of 4.8 kWh/d. That is, a 100% load is achieved in 2 days. Figure 7 shows the battery bank used.
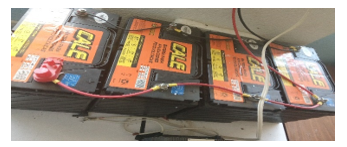 Figure 7: Battery bank.
Figure 8 shows the battery bank, the charge controller to which a 1500 W inverter is connected, all controlled with a load center; the inverter is connected to LED lamps with a 30 W reflector for outdoor lighting in the F building of the ITSAO.
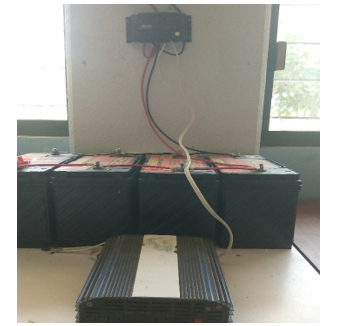 Figure 8: Charge controller, batteries and inverter.
The LED lamp has a consumption of 30 W with a reflector installed at an approximate height of 10 m; By having 2.16 kWh/d of production, up to 7 lamps can be connected to work all night, considering a continuous operation of 10 hrs per day with the consumption of 300 W per night of each lamp. Figure 9 shows the installed lamp.
 Figure 9: 30 W lamp with reflector installed.
4. Change of fluorescent tubes by LED tubes and monitoring of electric power consumption.
The operational control of energy has the purpose of establishing guidelines and activities for the control of electrical energy in the ITSAO facilities applicable to all activities, processes, products and services that consume electricity.
To reduce electricity consumption to date, we have worked with the acquisition of LED lamp tubes to replace the fluorescent tubes that consume the most electrical energy; in all areas of the ITSAO the lamps have been replaced with the participation of the technological community. Figure 10 shows the LED lamps corresponding to the interior lighting of the ITSAO buildings.
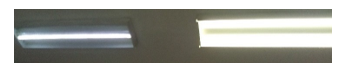 Figure 10: Lamps of LED tubes in operation.
The person in charge and his collaborators of the operational control of energy diffuses guidelines and activities to contribute to the reduction of the consumption and one of them is the use of LED lamps and the implementation of photovoltaic systems, also, awareness talks are held.
Monthly monitoring of electricity consumption is made by comparing quantitatively the monthly consumption of the current year with the previous one so that the energy savings obtained through an annual report to the representative of the general management can be identified and analyzed annually.
Table 1 shows the monitoring of electricity consumption, in this case, corresponds to the annual report of consumption monitoring in 2016, Table 2 shows the monitoring of electricity consumption for 2017, Table 3 shows the monitoring of electricity consumption for the year 2018 and Table 4 shows the monitoring of electricity consumption for the year 2019.
Table 1: Monitoring of electricity consumption in 2016.
| MONITORING OF THE ITSAO ELECTRICAL CONSUMPTION | ||||||||||||||
| YEAR: 2016 | ||||||||||||||
| PERIOD |
12/29/2014 TO 01/27/2015 |
01/27/2015 TO 02/26/2015 |
02/26/2015 TO 03/27/2015 |
03/27/2015 TO 04/28/2015 |
04/28/2015 TO 05/28/2015 |
05/28/2015 TO 06/26/2015 |
06/26/2015 TO 06/27/2015 |
06/27/2015 TO 08/27/2015 |
08/27/2015 TO 09/25/2015 |
09/25/2015 TO 10/26/2015 |
10/26/2015 TO 11/26/2015 |
11/26/2015 TO 12/28/2015 |
ANNUAL SAVINGS | |
|
12/29/2015 TO 01/27/2016 |
01/27/2016 TO 02/26/2016 |
02/26/2016 TO 03/27/2016 |
03/27/2016 TO 04/27/2016 |
04/27/2016 TO 05/26/2016 |
05/26/2016 TO 06/27/2016 |
06/27/2016 TO 07/25/2016 |
07/25/2016 TO 08/25/2016 |
08/25/2016 TO 09/26/2016 |
09/26/2016 TO 10/25/2016 |
10/25/2016 TO 11/25/2016 |
11/25/2016 TO 12/26/2016 |
|||
| MONTHLY CONSUMPTION kW-h | 8960 | 12180 | 14000 | 12040 | 16800 | 5180 | 21280 | 14840 | 17640 | 14000 | 16100 | 10640 | 163660 | |
| 8260 | 11060 | 9800 | 11620 | 18340 | 13720 | 12320 | 15540 | 16240 | 19640 | 15400 | 10360 | 162300 | ||
| SAVINGS IN % WAIT ANNUAL | 1% | 1% | 1% | 1% | 1% | 1% | 1% | 1% | 1% | 1% | 1% | 1% | ||
| * SAVINGS IN % | 7.81% | 9.20% | 30.00% | 3.49% | -9.17% | -164.9% | 42.11% | -4.72% | 7.94% | 40.29% | 4.35% | 2.63% | 0.83% | |
Table 2: Monitoring of electricity consumption in 2017.
| MONITORING OF THE ITSAO ELECTRICAL CONSUMPTION | ||||||||||||||
| YEAR: 2017 | ||||||||||||||
| PERIOD |
12/29/2015 TO 01/27/2016 |
01/27/2016 TO 02/26/2016 |
02/26/2016 TO 03/27/2016 |
03/27/2016 TO 04/27/2016 |
04/27/2016 TO 05/26/2016 |
05/26/2016 TO 06/27/2016 |
06/27/2016 TO 07/25/2016 |
07/25/2016 TO 08/25/2016 |
08/25/2016 TO 09/26/2016 |
09/26/2016 TO 10/25/2016 |
10/25/2016 TO 11/25/2016 |
11/25/2016 TO 12/26/2016 |
ANNUAL SAVINGS | |
|
12/29/2016 TO 01/23/2017 |
01/23/2017 TO 02/23/2017 |
02/23/2017 TO 03/27/2017 |
03/27/2017 TO 04/26/2017 |
04/26/2017 TO 05/25/2017 |
05/25/2017 TO 06/26/2017 |
06/26/2017 TO 07/26/2017 |
07/26/2017 TO 08/24/2017 |
08/24/2017 TO 08/25/2017 |
08/25/2017 TO 10/25/2017 |
10/25/2017 TO 11/24/2017 |
11/24/2017 TO 12/26/2017 |
|||
| MONTHLY CONSUMPTION kW-h | 8260 | 11060 | 9800 | 11620 | 18340 | 13720 | 12320 | 15540 | 16240 | 19640 | 15400 | 10360 | 162300 | |
| 7420 | 14280 | 17920 | 15120 | 22540 | 16520 | 16520 | 15120 | 15400 | 13440 | 12880 | 9520 | 176680 | ||
| SAVINGS IN % WAIT ANNUAL | 1% | 1% | 1% | 1% | 1% | 1% | 1% | 1% | 1% | 1% | 1% | 1% | ||
| * SAVINGS IN % | 10.17% | -29.11% | -82.86% | -30.12% | -22.90% | -20.41% | -34.09% | 2.70% | 5.17% | 31.57% | 16.36% | 8.11% | -8.86% | |
Table 3: Monitoring of electricity consumption in 2018.
| MONITORING OF THE ITSAO ELECTRICAL CONSUMPTION | ||||||||||||||
| YEAR: 2018 | ||||||||||||||
| PERIOD |
12/29/2016 TO 01/23/2017 |
01/23/2017 TO 02/23/2017 |
02/23/2017 TO 03/27/2017 |
03/27/2017 TO 04/26/2017 |
04/26/2017 TO 05/25/2017 |
05/25/2017 TO 06/26/2017 |
06/26/2017 TO 07/26/2017 |
07/26/2017 TO 08/24/2017 |
08/24/2017 TO 08/25/2017 |
08/25/2017 TO 10/25/2017 |
10/25/2017 TO 11/24/2017 |
11/24/2017 TO 12/26/2017 |
ANNUAL SAVINGS | |
|
12/26/2017 TO 01/25/2018 |
01/25/2018 TO 02/23/2018 |
03/23/2018 TO 03/26/2018 |
03/26/2018 TO04/24/2018 |
04/24/2018 TO 05/25/2018 |
05/25/2018 TO 06/25/2018 |
06/25/2018 TO 07/26/2018 |
07/26/2018 TO 08/24/2018 |
08/24/2018 TO 09/25/2018 |
09/25/2018 TO 10/25/2018 |
10/25/2018 TO 11/26/2018 |
11/26/2018 TO 12/26/2018 |
|||
| MONTHLY CONSUMPTION kW-h | 7420 | 14280 | 17920 | 15120 | 22540 | 16520 | 16520 | 15120 | 15400 | 13440 | 12880 | 9520 | 176680 | |
| 6720 | 10360 | 16940 | 13160 | 17080 | 18340 | 16520 | 15400 | 20720 | 19460 | 14000 | 10640 | 179340 | ||
| SAVINGS IN % WAIT ANNUAL | 1% | 1% | 1% | 1% | 1% | 1% | 1% | 1% | 1% | 1% | 1% | 1% | ||
| * SAVINGS IN % | 9.43% | 27.45% | 5.47% | 12.96% | 24.22% | -11.02% | 0.00% | -1.85% | -34.55% | -44.79% | -8.70% | -11.76% | -1.51% | |
Table 4: Monitoring of electricity consumption in 2019.
| MONITORING OF THE ITSAO ELECTRICAL CONSUMPTION | ||||||||||||||
| YEAR: 2019 | ||||||||||||||
| PERIOD |
12/26/2017 TO 01/25/2018 |
01/25/2018 TO 02/23/2018 |
03/23/2018 TO 03/26/2018 |
03/26/2018 TO04/24/2018 |
04/24/2018 TO 05/25/2018 |
05/25/2018 TO 06/25/2018 |
06/25/2018 TO 07/26/2018 |
07/26/2018 TO 08/24/2018 |
08/24/2018 TO 09/25/2018 |
09/25/2018 TO 10/25/2018 |
10/25/2018 TO 11/26/2018 |
11/26/2018 TO 12/26/2018 |
ANNUAL SAVINGS | |
|
12/26/2018 TO 01/26/2019 |
01/26/2019 TO 02/22/2019 |
02/22/2019 TO 03/25/2019 |
03/25/2019 TO 04/24/2019 |
04/24/2019 TO 05/27/2019 |
05/27/2019 TO 06/24/2019 |
06/24/2019 TO 06/25/2019 |
06/25/2019 TO 08/24/2019 |
08/24/2019 TO 08/25/2019 |
08/25/2019 TO 10/25/2019 |
10/25/2019 TO 11/26/2019 |
11/26/2019 TO 12/26/2019 |
|||
| MONTHLY CONSUMPTION kW-h | 6720 | 10360 | 16940 | 13160 | 17080 | 18340 | 16520 | 15400 | 20720 | 19460 | 14000 | 10640 | 179340 | |
| 7140 | 9940 | 20300 | 15960 | 22120 | 17920 | 20720 | 114100 | |||||||
| SAVINGS IN % WAIT ANNUAL | 1% | 1% | 1% | 1% | 1% | 1% | 1% | 1% | 1% | 1% | 1% | 1% | ||
| * SAVINGS IN % | -6.25% | 4.05% | -19.83% | -21.28% | -29.51% | 2.29% | -25.42% | 100.00% | 100.00% | 100.00% | 100.00% | 100.00% | 36.38% | |
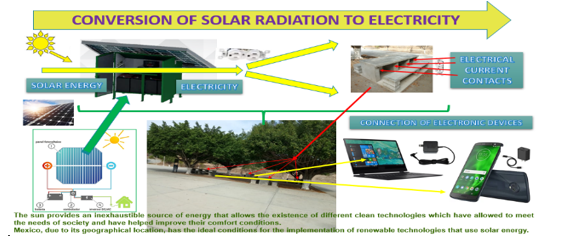 Figure 11: Infographic of the photovoltaic system for the ITSAO planters.
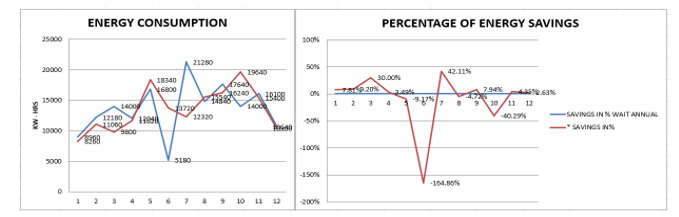 Figure 12: Graph of consumption in 2016 compared to 2015 and Graph of the reduction percentual for electricity consumption in 2016 compared to 2015.
One of the activities to be implemented is a photovoltaic system with the purpose of supplying electricity to the tables located in the planters of the esplanade; the conversion of solar energy to electricity will be applied so that the technology community can use it to power their electronic devices such as laptops and mobile devices while they rest or gather in the flower beds. Figure 11 shows an infographic that describes the operation and location of the photovoltaic elements and electrical power outlets
5. Results of the electric follow-up corresponding to the reports of 2016, 2017, 2018 and the current follow-up in 2019.
Figure 12 shows the comparison charts of electricity consumption and shows the relative comparison of electricity consumption reduction for 2016 compared to 2015.
Figure 13 shows the comparison charts of electricity consumption and shows the relative comparison of electricity consumption reduction for 2017 compared to 2016. In this case, electricity consumption increased due to the installation of air conditioning equipment in salons that did not have this electrical equipment.
Figure 14 shows the comparison charts of electricity consumption and shows the relative comparison of electricity consumption reduction for 2018 compared to 2017. In this case, electricity consumption increased due to the use of air conditioning equipment in salons that did not have this electrical equipment.
Figure 15 shows the comparison charts of electricity consumption and shows the relative comparison of electricity consumption reduction for 2019 compared to 2018. In this case, to date only monitoring is carried out until July the follow-up is in process.
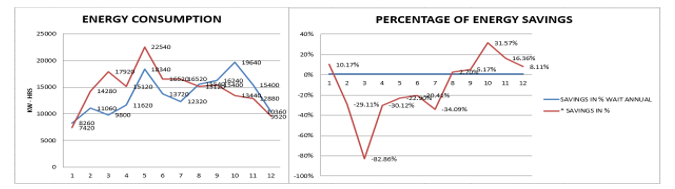 Figure 13: Graph of consumption in 2017 compared to 2016 and Graph of the reduction percentual for electricity consumption in 2017 compared to 2016.
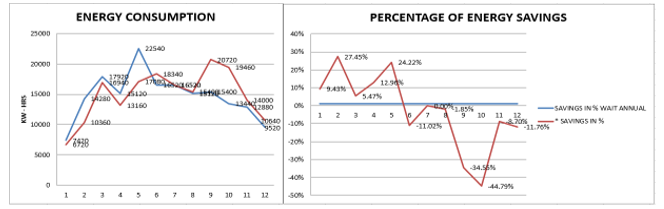 Figure 14: Graph of consumption in 2018 compared to 2017 and Graph of the reduction percentual for electricity consumption in 2018 compared to 2017.
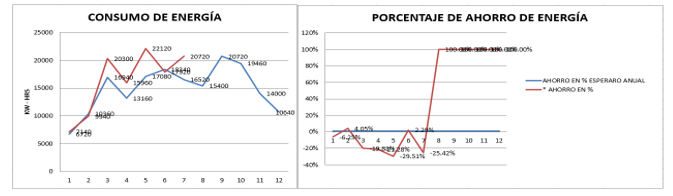 Figure 15: Graph of consumption in 2019 compared to 2018 and Graph of the reduction percentual for electricity consumption in 2019 compared to 2018.
The activities implemented are not only part of the Integrated Management System of the ITSAO, but they are also part of the academic and professional training of the students and the intervention of the Electronic Engineering Academy. They are also part of the research area corresponding to the research line “Renewable Energy and Energy Efficiency”.
6. Conclusions.
With the execution of the activities carried out, the emphasis is mainly on the use of clean energies such as solar as an alternative means to obtain electricity for the external lighting of the ITSAO facilities, with the implementation of LED lamps it is possible to reduce the electricity consumption with sustainable approach; the entire technological community will be given the opportunity to use photovoltaic energy for their outdoor electronic devices. The students manage to carry out sustainable development practices, research foundations, research workshops and optoelectronics to strengthen their academic training. The activities implemented to reflect a good result by observing the graphs in the reduction of electricity consumption.
Conflict of Interest.
The authors declare no conflict of interest.
Acknowledgement.
The research was carried out with the support of the Electronic Engineering area and the ITSAO technological community within the framework of the implementation of the Environmental Management System and the research area.
- B. T. Jeremias, E. M. Yoxkin, J. R. T. Juan, y R. G. Francisco, “Photovoltaic Energy, LED Technology and Energy Efficiency in the ITSAO”, en 2018 XXXI INTERNATIONAL SUMMER MEETING ON POWER AND INDUSTRIAL APPLICATIONS (RVP-AI), 2018, pp. 19-22.
- J. C. Cruz-Ardila, J. C. Cardona-Gómez, y D. M. Hernández-Porras, “Aplicación electrónica para el ahorro de energía eléctrica utilizando una energía alternativa”, Entramado, vol. 9, n.o 2, pp. 234-248, jul. 2013.
- A. N. Sperber, A. C. Elmore, M. L. Crow, y J. D. Cawlfield, “Performance evaluation of energy efficient lighting associated with renewable energy applications”, Renew. Energy, vol. 44, pp. 423-430, ago. 2012.
- J. Fresner, F. Morea, C. Krenn, J. Aranda Uson, y F. Tomasi, “Energy efficiency in small and medium enterprises: Lessons learned from 280 energy audits across Europe”, J. Clean. Prod., vol. 142, pp. 1650-1660, ene. 2017.
- Steven Fawkes, Kit Oung, y David Thorpe, Best Practices and Case Studies for Industrial Energy Efficiency Improvement. An Introduction for Policy Makers. DTU Library, 2016.
- J. de Beer, Potential for Industrial Energy-Efficiency Improvement in the Long Term. Springer Netherlands, 2000.
- Soraya Navarro Rayas, José Antonio González Moreno, y César M. López Andrade, “Implementación de un sistema fotovoltaico para la alimentación de un edificio de usos múltiples”. 2016.
- S. Medio, “Photovoltaic Design Integration at Battery Park City, New York”, Buildings, vol. 3, n.o 2, pp. 341-356, abr. 2013.
- M. Wichliński y J. Staszkiewicz, “Photovoltaic installation for a roofed car park in Egypt as an example of effective use of solar energy”, E3S Web Conf., vol. 49, p. 00127, 2018.
- C.-G. Haba, “Monitoring photovoltaic parks for damage prevention and optimal operation”, en 2017 International Conference on Electromechanical and Power Systems (SIELMEN), Iasi, 2017, pp. 321-326.
- “Google Maps”, Google Maps. [Online]. Available in: https://www.google.com.mx/maps/place/Instituto+Tecnol%C3%B3gico+Superior+de+Acatl%C3%A1n+de+Osorio/@18.2248389,-98.0409622,17z/data=!3m1!4b1!4m5!3m4!1s0x85cf4182fb37cc4f:0xf1a9691f53f1acf!8m2!3d18.2248389!4d-98.0387735. [Accessed: Mar 03, 2019].
- “POWER Data Access Viewer”. [Online]. Available in: https://power.larc.nasa.gov/data-access-viewer/. [Accessed: Mar 03, 2019].