
Application of Fractal Algorithms to Identify Cardiovascular Diseases in ECG Signals
Volume 4, Issue 5, Page No 143-150, 2019
Author’s Name: Gustavo Gallegos Dávalos, Pedro Freddy Huamaní Navarretea)
View Affiliations
Ricardo Palma University, Engineering Faculty, Lima 33, Peru
a)Author to whom correspondence should be addressed. E-mail: phuamani@urp.edu.pe
Adv. Sci. Technol. Eng. Syst. J. 4(5), 143-150 (2019); ![]() DOI: 10.25046/aj040519
DOI: 10.25046/aj040519
Keywords: ECG signals, Physionet database, Higuchi and Katz algorithm fractals, Principal Component Analysis

Export Citations
The aim of this article was the identification of cardiovascular diseases, after applying Katz and Higuchi fractal algorithms on 4 databases of ECG signals downloaded from the Physionet website: heart failure (HF), hypertension (H), ischemic heart disease (IHD) and normal sinus rhythm (NSR). For this purpose, initially the ECG signals passed through a filtering stage using a Butterworth high pass filter of order 6 and 0.5Hz of cutoff frequency, in order to cancel variations of the baseline. The fractal algorithms were applied independently for each database. For such application, all signals were standardized with a total of 100,000 data, and for the calculation of each fractal dimension (FD) a frame equal to 10,000 with an overlap of 1,000 was used in a first stage; in a second stage, a frame equal to 1,000 with an overlap of 100 was used. Thus, the results showed that the Higuchi algorithm, in general, has a better performance compared with the Katz algorithm. These results refer to the observation of the variance of the FD averages, which are shown in Table 4. For example, in the cardiovascular disease Arterial Hypertension, the Higuchi algorithm presented 0.0093 of variance compared with the algorithm of Katz that only reached 0.0352. Complementarily, we used the Principal Component Analysis (PCA) to show graphically the differences between algorithms, so the components related to the Higuchi algorithm were presented in a less dispersed and grouped form, making possible their differentiation, mainly when the second analysis stage was carried out.
Received: 27 May 2019, Accepted: 04 July 2019, Published Online: 24 September 2019
1. Introduction
The circulatory system is one of the such systems of the human being that fulfills a specific function; and, where the most important piece of this system is the heart, because it is responsible for pumping the blood to the different organs and systems of the human body in order to oxygenate them.
Due to the agitated life we lead, poor feeding, combined with the consumption of tobacco and alcohol steadily and in some cases certain hereditary ills, they can produce different types of ilness that damage the heart and affect the natural rhythm of its heartbeat. For this reason, there are several alterations about the forms of cardiac rhythms, which vary in intensity and severity. Thus, the purpose of using ECG signals of patients with cardiovascular diseases of higher incidence arises, such as it was stated by the World Health Organization [1], in order to be identified. For this was necessary to use the Physionet database [2], from which a total of 60 records of electrocardiogram signals were downloaded, including the one corresponding to the normal sinus rhythm. Then, for the identification of cardiovascular diseases in digitized ECG signals, we chose a field of mathematics that is dedicated to the study of signals that have a repetitive characteristic of self-similarity, which is called fractals. Likewise, this theory is also used in the analysis of encephalogram signals EEG, like early detection of Alzheimer’s disease [3], to visual evoked potential [4], to analyze the EEG brain oscillations during the development of cognitive tasks [5], and to analyze of the bimodal pattern of neuronal activity [6]. Likewise, the principal components analysis theory was used to reduce the dimensionality of the results obtained from the fractal dimensions of Higuchi and Katz. For this, the work of [7] was taken as reference, who used fractal analysis and chaos theory to detect dynamic changes in a group of 13 ECG signals with healthy and unhealthy segments, mainly when RR intervals and the ST segments were analyzed. Likewise, [8] was taken as reference who show the use of a procedure about analysis of fluctuation without tendency based on the theory of fractals, for patients who had cerebrovascular accidents. Also, the work of [9] where they indicate the development of a local fractal characteristic based on a method of concordance for the classification of arrhythmia ECG, by matching it with the representing templates from other ECG signals with different types of arrhythmias; and for this they used the Euclidean distance. Also, [10] used fractal dimension for automated diagnosis of serious arrhythmias. In the same way, the work of [11] investiged three fractal dimension methods, among them, Higuchi and Katz, plus artificial neural networks, as a methodology to predict sudden cardiac death. And, in [12], the use of two methods for the extraction of characteristics in ECG signals is proposed, where the second method is a fusion of fractal characteristics by stacking.
2. Processing and Fractal Dimension
This section briefly describes the four databases used to subsequently apply the filtering step, followed by the calculation of the fractal dimension of the ECG signals. In addition, this database was seleccioned, because represent to a group of cardiovascular diseases that have great incidence in Peru.
2.1. Physionet Database
There were four databases used in this article, which were obtained from the Physionet website [2]. These are:
- The BIDMC Congestive Heart Failure Database, for severe cases of heart failure. Which used a sampling frequency of 250 Hz, for a DII derivation, and with signals of 900,000 samples.
- The MIT-BIH Normal Sinus Rhythm Database, in the case of healthy people. Which used a sampling frequency of 128 Hz, for a DII derivation, and with signals of 460,800 samples.
- -Petersburg Institute of Cardiological Technics 12-lead Arrhythmia Database, for the case of hypertension disease. Which used a sampling frequency of 257 Hz and signals of 462,600 samples.
- The PTB Diagnostic ECG Database for the case of ischemic heart disease. Which used a sampling frequency of 1,000 Hz and signals of 115,200 samples.
In the same way, the PhysioBank ATM tool was used to download the files in *. MAT format, for a total of 15 signals per database in order to have a uniformity in all four cases. Figure 1 shows the temporal representation of an ECG signal in its original form, corresponding to a patient with heart failure.
2.2. Filtering Stage
Filtering stage consists of attenuating the baseline or DC component that alter the ECG signal. According to the American Heart Association in its article Recommendations for the Standardization and Interpretation of Electrocardiograms, recommends the use of filters with cutoff frequencies up to 0.67 Hz or less for linear digital filters with phase distortion equal to zero [13]. Therefore, it was used a Butterworth high pass filter with order 6 and cutoff frequency equal to 0.5 Hz, in order to attenuate the DC component and having a stable phase response. Figure 2 shows the comparison between an original signal from a patient with ischemic heart disease, and its corresponding result after applying the filtering stage.
 Figure 1. ECG signal from the database BIDMC Congestive Heart Failure to a patient with heart failure. Source: Authors.
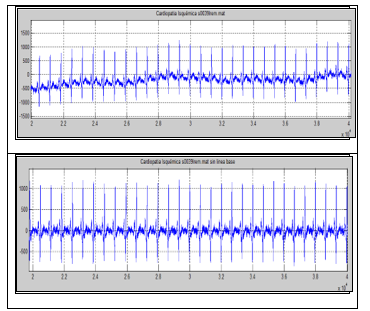 Figure 2. Above: original ECG signal from a patient with Ischemic heart disease. Bottom: ECG signal filtered with Butterworth filter. Source: Authors.
3. Estimation of Fractal Dimensions
The calculation of the fractal dimension of Higuchi considers a finite set of observations of time series taken in a regular interval, to then built a new series of time [14]. It is described using Equation (1).
![]() Where « m » indicates the initial time value, « k » is the discrete time delay, and means integer part of a.
Where « m » indicates the initial time value, « k » is the discrete time delay, and means integer part of a.
In this way, algoritm proposed by Higuchi, to estime the fractal dimension, can be seen in Figure 3 as a flow chart. This flow chart is based on the program coded by [15].
Likewise, algorithm proposed by Katz to estimate the fractal dimension of a flat curve is shown in Equation (2).
![]() Where « d » is the diameter of the curve and « L » is the length of the curve, defined as the distance between two successive points.
Where « d » is the diameter of the curve and « L » is the length of the curve, defined as the distance between two successive points.
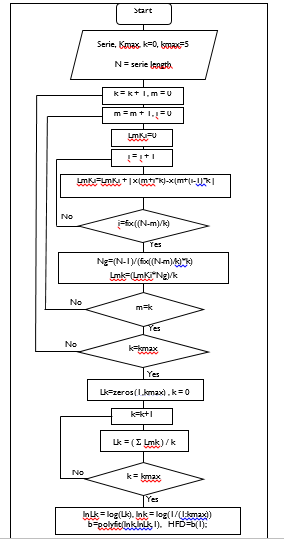 Figure 3. Flow chart to calculate the fractal dimension by Higuchi.
In addition, Katz adds that by practical convention, in order to discretize the space and to normalize the fractal dimensions, he defines the standard unit as the smallest convolution size of interest in a form, then for waveforms, the average distance between 2 successive points is « a », then using « a » and clearing in the formula for fractal dimension D [16], result Equation (3).
![]() Where « n » is the number of steps in the curve (L / a), and « a » is the average length of the unit. Then, flow chart used to calculate the fractal dimension by Katz can be seen in Figure 4. This flow chart is based on the program coded by [17].
Where « n » is the number of steps in the curve (L / a), and « a » is the average length of the unit. Then, flow chart used to calculate the fractal dimension by Katz can be seen in Figure 4. This flow chart is based on the program coded by [17].
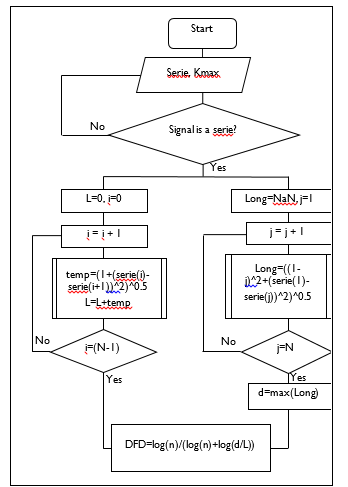 Figure 4. Flow chart to calculate the fractal dimension by Katz.
4. Fractal characteristic of ECG signal
The calculation of the fractal dimension of Higuchi considers a finite set of observations of time series taken in a regular interval, to then built a new series of time [14]. It is described using Equation (1).
In the work of [18], it is affirmed that the methods based on fractal geometry have been used satisfactorily in the analysis of cardiac signals. These studies show that ECG signals were modeled as self-related fractal sets and their characteristics can be determined using the fractal dimension. In addition, the fractal nature of the ECG signal can be attributed to the self-similar pattern of cardiac rhythm activity, then the change in the rhythmic pattern can be measured using the fractal dimension since the self-similar structure will change.
Likewise, [19], in his article A Healthy Heart is a Fractal Heart, says that the heart is part of a great feedback system, whose dynamics are non-linear, non-stationary and multiscale. Consequently, the heartbeat is one of the most complex signs in nature. Thus, in the records of ECG signals obtained from sick and elderly people, show great losses of complexity with respect to the beats obtained from healthy people. That is, the values of the fractal index tend to 1 when people are sick and on the contrary they move away from the unit when they are healthy.
Therefore, from a group of 4 ECG signals, the most distorted wave is the signal in Figure B and it is the one that belongs to a healthy person. Then, figure D belongs to the disease called atrial fibrillation, while Figures A and C belong to patients with severe heart failure. They are show in Figure 5.
 Figure 5. Complex behavior of ECG signals [19].
However, before proceeding to calculate the fractal dimensions of Katz and Higuchi, it is necessary to check their performance. For it, we used the Weierstrass function which was characterized by generating a synthetic signal to verify the operation of the proposed algorithms. Therefore, the procedure used by [20] was repeated, where synthetic signals are generated using the Weierstrass cosine function with known fractal dimensions (theorical), then these signals are processed with the proposed algorithms of Katz and Higuchi. Next, they are represented in tabular and graphic scheme. It is show in Table 1 and in Figure 6.
In the previous graphic representation, was observed a quasi linear behavior of the Higuchi algorithm with respect to the synthetic signal. By another hand, from the graphical representation corresponding to the Katz algorithm, a light variation was observed from the fractal dimension equal to 1.5, showing an increasing behavior as equal as the obtained by [20].
In this way, with the four previously filtered databases, we proceed to calculate the fractal dimensions of Katz and Higuchi in order to differentiate the signals belonging to healthy and sick people. However, such algorithms are of the unsupervised type, because they do not perform learning and they are only used to discriminate or differentiate the data.
|
Table 1. Averages obtained from the Higuchi and Katz’s FD Source: Authors |
||
| FRACTAL DIMENSIONS | ||
| THEORETICAL | HIGUCHI | KATZ |
| 1.10 | 1.1298 | 1.0000 |
| 1.20 | 1.2064 | 1.0000 |
| 1.30 | 1.294 | 1.0000 |
| 1.40 | 1.3858 | 1.0000 |
| 1.50 | 1.4778 | 1.0000 |
| 1.60 | 1.5700 | 1.0002 |
| 1.70 | 1.6646 | 1.0011 |
| 1.80 | 1.7668 | 1.0059 |
| 1.90 | 1.8797 | 1.0331 |
| 1.95 | 1.9390 | 1.0781 |
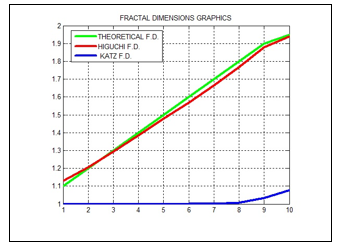 Figure 6. Graph of Fractal Dimensions of the Synthetic Signal.
Source: Authors.
For the estimation procedure of both fractal dimensions, each signal of the group of 15 was subdivided into 10 equal sections. For example, for the Physikalisch-Technische Bundesanstalt (PTB) database, belonging to ischemic heart disease, 115,200 samples are collected. However, only the first 100,000 samples were selected and subdivided into 10 equal parts to obtain frames or sections of 10,000 samples with an overlap of 1,000 samples.
 Figure 7. Katz’s FD of Heart Failure.
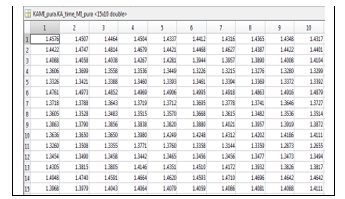 Figure 8. Katz’s FD of Ischemic Heart Disease.
Figures 7 and 8 show the fractal dimensions of Katz for the 15 signals of Heart Failure and Ischemic Heart Disease, respectively. Similarly, Figures 9 and 10 show the fractal dimensions of Higuchi for the 15 signals of Normal Signal and Signal with Hypertension, respectively.
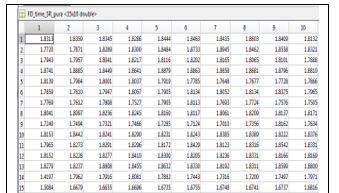 Figure 9. Higuchi’s FD of the Normal Sinus Rhythm.
 Figure 10. Higuchi’s FD of the Signal with Hypertension.
As observed from Figures 7, 8, 9 and 10, there are 10 dimensions for each of the 15 signals in the database. Therefore, we proceeded to determine the arithmetic mean of the 10 FD, because are very close to each other. They are show in Tables 2 and 3.
However, with the arithmetic mean it is not possible to discriminate easily between one and another type of ECG signal, because such result present not scattered values for the same type of ECG signal. Only in the case of normal signal and ischemic heart disease do not have so scattered values. Otherwise, in the case of the Higuchi algorithm, the results of the arithmetic means present closer values, and they are no higher as scattered for each of the four signals, especially in the case of the normal sinus rhythm (healthy people).
| Table 2. Averages obtained from the Katz’s FD | |||
| Heart Failure | Ischemic Heart Disease | Normal Sinus Rhythm | Signal with Hypertension |
| 1.2212 | 1.4415 | 1.5761 | 1.3590 |
| 1.2198 | 1.4539 | 1.4090 | 1.3538 |
| 1.1935 | 1.4064 | 1.5360 | 1.2828 |
| 1.1602 | 1.3415 | 1.4395 | 1.2777 |
| 1.3286 | 1.3398 | 1.4750 | 1.3631 |
| 1.1923 | 1.4903 | 1.4491 | 1.7435 |
| 1.2273 | 1.3717 | 1.5331 | 1.8564 |
| 1.1836 | 1.3552 | 1.4787 | 1.5952 |
| 1.4434 | 1.3882 | 1.3967 | 1.6198 |
| 1.2280 | 1.4022 | 1.3928 | 1.5117 |
| 1.5239 | 1.3304 | 1.4818 | 1.5321 |
| 1.1715 | 1.3466 | 1.4576 | 1.6883 |
| 1.1932 | 1.4068 | 1.5216 | 1.5666 |
| 1.2870 | 1.4685 | 1.3166 | 1.7599 |
| 1.3700 | 1.4056 | 1.4618 | 1.7354 |
| Table 3. Averages obtained from the Higuchi’s FD | |||
| Heart Failure | Ischemic Heart Disease | Normal Sinus Rhythm | Signal with Hypertension |
| 1.3629 | 1.5116 | 1.8379 | 1.6180 |
| 1.6130 | 1.5127 | 1.8368 | 1.6735 |
| 1.3751 | 1.4801 | 1.8069 | 1.6870 |
| 1.6722 | 1.3048 | 1.8760 | 1.6979 |
| 1.5862 | 1.4361 | 1.7878 | 1.7149 |
| 1.5137 | 1.4550 | 1.8024 | 1.5928 |
| 1.5747 | 1.4296 | 1.7723 | 1.6298 |
| 1.6073 | 1.4601 | 1.8147 | 1.5914 |
| 1.5717 | 1.4552 | 1.7410 | 1.4783 |
| 1.5602 | 1.3781 | 1.8297 | 1.4866 |
| 1.4120 | 1.4407 | 1.8274 | 1.5489 |
| 1.4640 | 1.4019 | 1.8247 | 1.6871 |
| 1.6003 | 1.4811 | 1.8464 | 1.6330 |
| 1.4542 | 1.5284 | 1.7346 | 1.4497 |
| 1.5090 | 1.2369 | 1.6565 | 1.4220 |
In this way, in order to have a better visualization and differentiation of the obtained results, we processed the FD by calculating the variance in order to see how these results differ from their average. Results of the variance of the averages obtained from the FD of Higuchi and Katz, for the four types of signals used, are shown. Also, signal with the greatest variation for the Higuchi’s FD is arterial hypertension and the one with the least variation is the FD of the normal sinus rhythm. Similarly, for the Katz algorithm, the FD with the greatest variation is also arterial hypertension and the one with the least variation is that of ischemic heart disease. It is show in Table 4.
Then, in order to reduce the dimensionality, we decided to use the Principal Component Analysis on the obtained data. So, in this way, we achieved a better differentiation of the databases studied. For this, we created a matrix where the values of the FD are analyzed.
| Table 4. Variance of the averages obtained from the Higuchi and Katz’s FD | ||
|
CARDIOVASCULAR DISEASES |
HIGUCHI’s F.D. | KATZ’s F.D. |
| Heart Failure | 0.0087 | 0.0116 |
| Normal Signal | 0.0030 | 0.0044 |
| Arterial Hypertension | 0.0093 | 0.0352 |
| Ischemic heart disease | 0.0062 | 0.0025 |
When the results of the PCA are plotted, the values of the “score” matrix are used, which is generated when working with the PRINCOMP function of the Matlab. This matrix score contains the coordinates or projections of the main components. In a first stage, we used the PCA to compare the signals in pairs, so, the FD of the signals corresponding to the diseases had compared with the signal of the healthy person. In this way, we show some results in two dimensions that comes of the application of the PCA algorithm on the FD of Katz and Higuchi, respectively, for the case of frame equal to 10,000 and overlap equal to 1,000.
Thus, for Katz’s Fractal Dimension, the comparison of heart failure with the normal signal showed a tendency between the two when trying to group, but several scattered points were also observed. It is show in Figure 11.
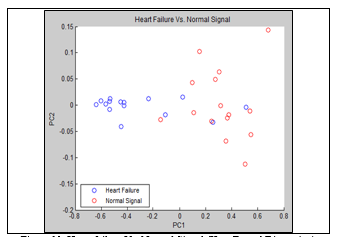 Figure 11. Heart failure Vs. Normal Signal (Katz Fractal Dimension). Frame=10,000 and Overlap=1,000.
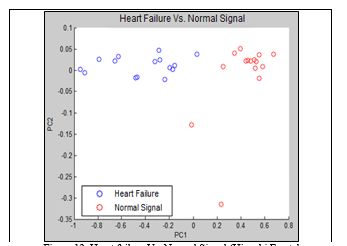 Figure 12. Heart failure Vs. Normal Signal (Higuchi Fractal Dimension). Frame=10,000 and Overlap=1,000.
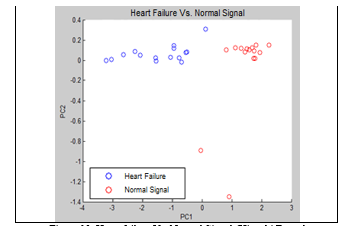 Figure 13. Heart failure Vs. Normal Signal (Higuchi Fractal Dimension). Frame=1,000 and Overlap=100.
On the other hand, for Higuchi’s Fractal Dimension, the comparison of heart failure with the normal signal showed a better separation between the 2 signals observed. It is show in Figure 12.
Performing more tests with the algorithms used, we proceeded to reduce the size of the frame to 1,000 and the overlap to 100. This gave rise to a calculation of the FD for 100 segments and therefore more features emerged were analyzed with the PCA algorithm. For this case, again, the Higuchi algorithm presented a better performance to analyze and differentiate the signals.
Similarly, for Higuchi’s Fractal Dimension, the comparison of heart failure with the normal signal showed an excellent differentiation of the main components. It is show in Figure 13.
In this way, for Katz’s Fractal Dimension, the comparison of heart failure with the normal signal showed an improvement in the differentiation of the main components. It is shown in Figure 14.
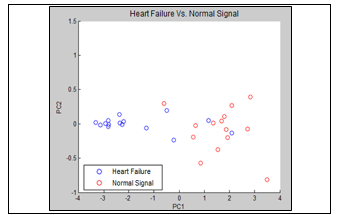 Figure 14. Heart failure Vs. Normal Signal (Katz Fractal Dimension). Frame=1,000 and Overlap=100.
Therefore, with the reduction of the size of the frame and of the overlap a major separation of the main components is achieved.
At the end, we show, in 2D and 3D graphs, principal components (PCA) of the 4 signals studied for Higuchi Fractal Dimension for the case of frame equal to 1,000 and over equal to 100, where it is appreciated that heart failure is mixed with hypertension and ischemic heart disease. They are show in Figures 15 and 16.
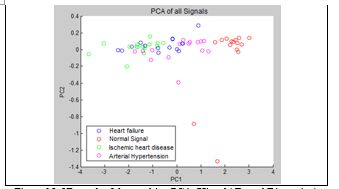 Figure 15. 2D graph of the resulting PCA (Higuchi Fractal Dimension). Frame=1,000 and Overlap=100.
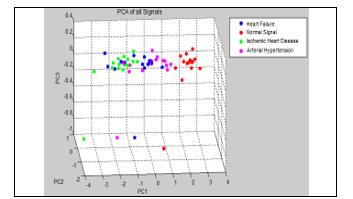 Figure 16. 3D graph of the resulting PCA (Higuchi Fractal Dimension). Frame=1,000 and Overlap=100.
On the other hand, as a result of the calculation of Katz´s Fractal Dimension for the case of frame equal to 1,000 and over equal to 100, the graphic representation in 2D and 3D of the main components of te 4 signals studied show a greater combination between them, making their separation and identification more difficult. They are show in Figures 17 and 18.
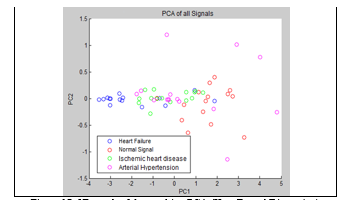 Figure 17. 2D graph of the resulting PCA (Katz Fractal Dimension). Frame=1,000 and Overlap=100.
5. Conclusions
The Butterworth high pass filter was used for the elimination of the variations of the baseline, which allowed to filter the frequencies below 0.5 Hz, range in which they are present unwanted signals. In addition, the algorithms of Katz and Higuchi were adapted to the programming language of Matlab, for this purpose the corresponding equations were used, which were the basis of calculation for these algorithms.
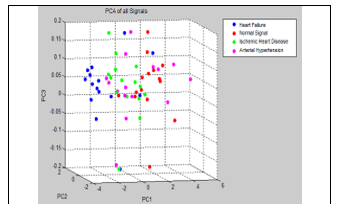 Figure 18. 3D graph of the resulting PCA (Katz Fractal Dimension). Frame=1,000 and Overlap=100.
PCA algorithm was used optimally, since it was possible to reduce the FD, obtaining the main components that represent the 4 types of signals (heart failure, hypertension, ischemic heart disease and normal signal).
The results were graphically represented with the principal components in two and three dimensions for the Katz and Higuchi algorithms. Finally, the algorithm of Higuchi gave a better performance and this is because Higuchi’s algorithm calculates the FD through summations and repetitive averages of the segment or distance at which the FD was calculated, while Katz uses the basic form of the calculation proposed by Mandelbrot when define a fractal, which consists of a division of logarithms to calculate the FD. This performance results when refer to the observation of the variance of the FD averages, which are shown in Table 4.
In addition, the results improve when the size of the frame and the over are reduced to 1,000 and 100, respectively. This improvement is due to the fact that the components of the PCA do not appear dispersed, and on the contrary they remain grouped which facilitates their differentiation. In this way, despite using a frame size equal to 10,000 and an overlap equal to 1,000, the Higuchi algorithm achieved a better separation of the PCA components from the databases: normal signal y heart failure, as show in figures 11 and 12. For the other hand, by reducing the number of frames to 1,000 and the overlap to 100, again the Higuchi algorithm achieves a better grouping of the components, as show in figures 16 and 18.
On the other hand, the result of the work of [20] shows that Katz’s algorithm is the most consistent method for discrimination of epileptic states from the intracranial EEG (IEEG), likely due to its exponential transformation of FD values and relative insensitivity to noise. For this reason, the content of this article differs in terms of the results achieved with respect to Higuchi’s algorithm.
Finally, it can also be concluded that the use of fractal dimensions plus other techniques such as artificial neural networks, frequency analysis, principals components analysis, among others, offer greater applications of identification and classification on ECG and EEG signals allowing the early detection of Alzheimer’s, identifying cardiovascular diseases, predicting sudden deaths due to heart problems, classifying heart signals [3], [7], [11], [12], etc.
Conflict of Interest
The authors declare no conflict of interest.
- World Health Organization. Press Center. Cardiovascular diseases. 2015. Recovered in June, 2017. Available: http://www.who.int/mediacentre/factsheets/fs317/es/
- Physiobank Database, 2017. Available: https://physionet.org/physiobank/database/
- A. Al-nuaimi, E. Jammeh, L. Sun and E. Ifeachor, “Higuchi fractal dimension of the electroencephalogram as a biomarker for early detection of Alzheimer’s disease”. In 39th Annual International Conference of the IEEE Engineering in Medicine and Biology Society (EMBC), 2017. DOI: 10.1109/EMBC.2017.8037320.
- S. Solehah, V. Sagayan, S. Chandra and D. Yanti, “Evaluation of simulated VEP signals on basis of Higuchi and Katz’s algorithm”. In 2017 IEEE International Conference on Signal and Image Processing Applications, 2017. DOI: 10.1109/ICSIPA.2017.8120627.
- C. Flores and J. Noel, “Parameters analyzed of Higuchi’s fractal dimension for EEG brain signals”. In 2015 Signal Processing Symposium (SPSympo), Debe, Poland, 2015. DOI: 10.1109/SPS.2015.7168285.
- S. Spasić, A. Savic, L. Nikolic, S. Budimir, D. Janošević and A. Mitrović, “Applications of Higuchi’s fractal dimension in the analysis of biological signals”. In 2012 20th Telecommunications Forum (TELFOR), 2012. DOI: 10.1109/TELFOR.2012.6419291.
- I. Sedielmaci & F. Bereksi, “Detection of some heart diseases using fractal dimension and chaos theory”. In 2013 8th International Workshop on Systems, Signal Processing and their Applications (WoSSPA), 2013. DOI: 10.1109/WoSSPA.2013.6602342
- A. Gómez, O. López, D. Sierra y O. Rueda-Ochoa, “Extracción de características fractales de la señal de variabilidad de frecuencia cardiaca en pacientes con accidente cerebrovascular y análisis de su viabilidad como factor pronóstico”. In XVI Simposio de Tratamiento de Señales, Imágenes y Visión Artificial (STSIVA), 2011.
- K. Amit and S. Raghav, “Local fractal dimension based ECG arrhythmia classification” Journal Biomedical Signal Processing and Control, 5(2), 114–123, 2010. https://doi.org/10.1016/j.bspc.2010.01.002
- U. Rajendra, H. Fujita, M. Adam, O. Shu, T. Jen, V. Sudarshan and J. EW Koh, “Automated characterization of arrhythmias using nonlinear features from tachycardia ECG beats”. In 2016 IEEE International Conference on Systems, Man, and Cybernetics (SMC), Budapest, Hungary. 2016. DOI: 10.1109/SMC.2016.7844294.
- F. López-Caracheo, A. Bazualda, C. Perez-Ramirez, M. Valtierra-Rodriguez, A. Dominguez-Gonzalez, and J. Amezquita-Sanchez, “Fractal Dimension-based Methodology for Sudden Cardiac Death Prediction”. In IEEE International Autumn Meeting on Power, Electronics and Computing (ROPEC 2018), Ixtapa, Mexico. 2018. DOI: 10.1109/ropec.2018.8661371.
- M. Hamidi, H. Ghassemian and M. Imani, “Classification of heart sound signal using curve fitting and fractal dimension” Journal Biomedical Signal Processing and Control, 39, 351-359, 2018. https://doi.org/10.1016/j.bspc.2017.08.002
- Recommendations for the Standardization and Interpretation of the Electrocardiogram: Part I. 2007 Available: https://www.sciencedirect.com/science/article/pii/S073510970700232X#bib23
- T. Higuchi, “Approach to an irregular time series on the basis of the fractal theory” Journal Physica D: Nonlinear Phenomena, 31(2), 277-283, 1988. https://doi.org/10.1016/0167-2789(88)90081-4
- S. Selvam, “Complete Higuchi Fractal Dimension Algorithm”. Mathworks, File Exchange. Recovered in may, 2017. Available: https://la.mathworks.com/matlabcentral/fileexchange/30119-complete-higuchi-fractal-dimension-algorithm
- M. Katz, “Fractals and the Analysis of Waveforms” Journal Computers in Biology and Medicine, 18(3), 145-156, 1988. https://doi.org/10.1016/0010-4825(88)90041-8
- J. Monge-Alvarez, “Higuchi and Katz fractal dimension measures”. Mathworks, File Exchange. Recovered in may, 2017. Available: https://la.mathworks.com/matlabcentral/fileexchange/50290-higuchi-and-katz-fractal-dimension-measures
- D. Kumar, Fractals Applications in Biological Signaling and Image Processing. Boca Raton, USA: Taylor & Francis Group, 2017.
- Cipra B, “A healthy Heart is a Fractal Heart. SIAM News”, 2003. Available: https://studylib.net/doc/10393710/a-healthy-heart-is-a-fractal-heart-by-barry-a.-cipra
- R. Esteller, G. Vachtsevanos, J. Echauz and B. Litt, “A comparison of waveform fractal dimension algorithms”. In IEEE Transactions on Circuits and Systems-I: Fundamental Theory and Applications, 2001. DOI: 10.1109/81.904882.