
The Effect of Fuel Additives on Pyrorated Biodiesel Blends on the Performance of a Diesel Power Generator
Volume 4, Issue 5, Page No 88-96, 2019
Author’s Name: Maroa Semakulaa), Freddie Inambao
View Affiliations
Department of Mechanical Engineering, University of KwaZulu-Natal, Durban, South Africa
a)Author to whom correspondence should be addressed. E-mail: ssemakulamaroa@gmail.com
Adv. Sci. Technol. Eng. Syst. J. 4(5), 88-96 (2019); ![]() DOI: 10.25046/aj040511
DOI: 10.25046/aj040511
Keywords: 2-ethyl hexyl nitrate, Ethanol, High content of oxygen, Ignition quality, Waste plastic pyrolysis oil, Phase separation

Export Citations
The demand for renewable energy sources such as waste pyrolysis plastic oil (WPPO), ethanol biofuel with high oxygen content is increasing globally. This study used blending of conventional diesel oil, waste plastic pyrolysis oil, ethanol and 2-ethyl hexyl nitrate (EHN) as additive. The purpose was to improve combustion, the ignition quality, and performance and emission characteristics of WPPO as an alternative source of energy. As an additive EHN reduces emissions of CO, CO2, UHC, NOX, and PM. On the other hand, the inclusion of ethanol purposed to improve the viscosity, increase the oxygen content of the blends, and increase miscibility of WPPO. The study utilized the following ratios, 50/WPPO25/E25, 60/WPPO20/E20, 70/WPPO15/E15, 80/WPPO10/E10 and 90/WPPO5/E5 for conventional diesel (CD), WPPO and ethanol and EHN respectively. The ratio of the additive was determined by the percentage method based on the total quantity of the blended fuel and was calculated as 0.001 %. A complete Miscibility was observed to avoid phase separation during the study and experimentation, for the blended ratios of WPPO. The testing for performance and emission characteristics was conducted on a fixed bed, water-cooled, single cylinder diesel generator engine. The results were compared to ASTM standards and discussed using tables and figures. The results conclusively show very close densities of 792 kg/m3, 963 kg/m3, 825 kg/m3 for WPPO, ethanol, EHN respectively, which are close to CD fuel at 845 kg/m3. Increased blend ratio decreased BSFC, 50 % engine load blend 80/WPPO10/E10 had values of 0.043 g/kW.h compared to full load with 0.041 g/kW.h. The highest brake thermal efficiency was by blend 90/WPPO5/E5 at 25 % engine load with a value of 26.5 % compared to 19 % at full engine load. Increase in the blend ratio and engine load decreased CO emissions up to 75 % engine load. For example, blend 90/WPPO5/E5 had a value of 0.035 % carbon emissions compared to 0.055 % at 25 % engine load. Therefore, conclusively WPPO blends can be alternative fuel with or without major engine modification.
Received: 14 May 2019, Accepted: 06 August 2019, Published Online: 03 September 2019
1. Introduction
The demand for energy due to the increasing world population energy needs has placed tremendous pressure on the primary sources of energy, which are oil-based fossil fuels, in the last decade [1-3]. Although economically good on the other hand, widespread use and burning of fossil fuels is responsible for long-term environment problem in climatic changes. Secondly, fossil fuels are non-renewable and as such, their depletion is a global energy security threat. Besides depletion, the burning of fossil fuels decreases air quality leading to large-scale increase in cardiovascular diseases and cancer cases [4-6].
Globally fossil fuel still commands 80 % of the total energy requirements of the world which is consumed mostly by the transport industry alone [7]. The largest fossil fuel brand is diesel, which is a primary in diesel engines used for commercial and private transportation. Since their discovery in 1893 by Rudolph Diesel, diesel engine are efficient and good in fuel economy over power [8, 9]. Diesel engines are gaining more popularity in agricultural transport and applications, power generation and heating systems. This is due to their high thermal efficiency resulting into energy saving overload and safety aspects due to low volatility [10, 11].
However, diesel engines are responsible of high smoke and NOx emissions [12, 13]. Leading Diesel exhaust to be classified as carcinogenic [14] to humans which link it to increased risk of lung cancer and other cardiovascular ailments [15]. The diesel exhaust is now one of the primary sources of ground ozone [16], the sick building syndrome [17], acid rain [18], and smog [19]. Other disadvantages of fossil fuels include erratic fuel prices in the world market, potential turmoil in oil producing countries and the ever-increasing emission control requirements by governments. Therefore, finding an alternative renewable fuel that can mitigate the negative impact of fossil fuels cannot be emphasized [20].
The earliest development in alternative fuels utilized food crop-based feedstocks. As a result, this increased food insecurity in low middle-income countries and the developing countries. Hence, human rights campaigners including United Nations Food and Agriculture Organization (FAO) and the UN Security Council on human rights rejected these feedstocks. The rejection was based on Commercialization of large swathes of land for biodiesel feedstock cultivation, hence suppression of edible food crop acreage. Consequently, food prices increased and prices of essential commodities increased too [21]. Early this year a palm oil has been removed as a biodiesel feedstock by United Nations agencies like FAO due to the continued environmental hazards food security challenges in Malaysia and Indonesia.
In recent years, research has awakened focus and interest in higher alcohols due to their high levels of energy, higher cetane number (CN); better blend stability, less hygroscopic tendencies, increased carbon chain length and improved ignition quality by the alcohol fuel molecules [22]. However, lower level of alcohols methanol and ethanol, still have high qualities oxygenates. The availability of high-oxygen content with a hydroxyl (OH) group is one of the major advantages of alcohols, it reduces smoke emissions and opacity during high engine load [23, 24]. Other advantages of ethanol which make it preferable as an additive for waste plastic pyrolysis oil (WPPO) biodiesel blends include (i) ethanol is made from sources of plant origin, making it renewable, (ii) improvement in modern fermentation processes in biotechnology engineering.
This has led to improved yields in ethanol by synthesizing cellulose, for example Clostridium species [25], biosynthesis from glucose using genetically engineered micro-organisms like Escherichia coli [26], cyanobacteria [27] and Saccharomyces cerevisiae [28]. The third reason why ethanol is important as additive in WPPO due to its inherent physicochemical composition properties. These characteristics include the presence of high oxygen content, high solubility and miscibility in WPPO blends [29-34].
Extracting liquid fuel from plastic waste material using thermal decomposition in viable and sustainable technologies has been reported in research in the last decade. Plastic waste decomposition is not only through thermal processes but also through catalytic pyrolysis. The catalytic technique uses low levels of temperature to cause plastic decomposition compared to thermal decomposition, which employs very high temperatures to produce greater yield of liquid oil. This has increased developments in turning plastic waste into energy a development that has captivated and motivated researchers such as [35-37]. A number of researchers have studied additives in their work on performance and emission impacts using biodiesel blends such as [38-53]. Especially when the final product is used with fuel additives with characteristics focusing on reducing NOX, CO, CO2, unburnt hydrocarbon (UHC) and particulate matter (PM) emissions [20].
A number of studies have been conducted on the reduction of NOX and PM emissions using additives and biodiesel blends in diesel engines such as: [54] the authors used ethanol, selective catalytic reduction (SCR) catalyst Ag/Al2O3, and blends of biodiesel-ethanol fuel (BE). The results were mixed for emissions of UHC, CO, and PM, with an increase of 14% respectively. The authors attributed it to the presence and increase in SOFs in the PM emissions. However, a decrease in the Bosch smoke by 60 % to 80 % was reported using the European stationary cycle (ESC) standard. The NOX emissions reduced by a margin of 73 % leading to a conclusion that a combination of BE and SCR catalyst arrangement provides a platform for the reduction and control of PM and NOX emissions.
In another study by [55] wanted to determine cold flow features using ethanol-biodiesel blends by characterization. In this study a relationship between blend and torque, brake thermal efficiency, brake specific fuel consumption and emission characteristics. The findings of this study have led developed and developing countries to adopt and make fuel blending a mandatory requirement in Europe, USA and Brazil. For example, In the United States of America, the renewable fuel standard (RFS) program requires blending of fuels in increasing measure with fossil transportation fuel. This is targeting an annual growth rate escalation of 36 billion gallons by 2022 [56].
As an additive in blends, an increase in the ethanol fraction decreases auto-ignition properties of the blends, due to ethanol’s low propensity [57-64]. These findings report a decrease in the CN value of the blends as the fraction of ethanol increases as the main cause. Reduced CN values prolong ignition delay and is undesirable in the combustion of the blends. Ignition delay is responsible for increased engine peak combustion pressure [65, 66]. This increases wear, combustion noises besides increasing NOX emissions in diesel engines. The effect of CN alteration on combustion values in relation to blend characteristics is not a new research area. For example, researchers such [67-74] have covered this area and one can read the findings and conclusions.
Plastics contain a high potential of stored energy from hydrocarbon inherent in their makeup and molecular structure. Plastics are daily used in our lives and are readily available as waste in municipal solid waste sites. Plastics have become a health hazard as they litter everywhere while pausing an environmental danger to humans and animals. Therefore, altering them through modern processing methods into liquid oils for transportation fuels is a novel idea whose time has come. [75]. This study aims at utilizing and developing feedstocks from waste streams of plastics and converting them through pyrolysis into energy. This will provide a framework for creating alternative fuels to reduce dependency on petroleum fuels, which are primary transport fuels. The third aspect of this work is to show the importance of blending WPPO or any other new alternative feedstocks to improve their
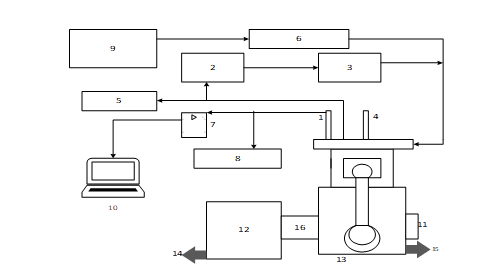 Figure 1: Schematic diagram of the test engine rig
Key: 1 Cylinder pressure sensor; 2 EGR control valve; 3 EGR cooler; 4 Injection control unit; 5 Exhaust gas exit; 6 Air box; 7 Signal amplifier; 8 Gas analyser; 9 Air flow meter; 10 Data acquisition system; 11 Crank position sensor; 12 Dynamometer; 13 Engine; 14 Cooling water exit from the dynamometer to the cooling tower; 15 Cooling water exit from engine to the cooling tower; 16 Dynamometer drive coupling qualities. The focus is to reduce emission and enhance performance of transportation fuel while creating jobs in recycling but protecting our environment.
2. Methodology
2.1. Methodology and Experimental Set-Up
This experiment is making a case for blending of WPPO whose n-alkenes are very low by 25 % in auto-ignition, compared to diesel fuel whose n-alkenes are good for auto-ignition. The aromatics, which affect PM emissions, are very low in WPPO blends. WPPO consists of iso-alkanes, n-alkanes, and olefins in the areas of 27 %, 25 %, and 9 % respectively, the remaining 30 % content is undefined due to complicated chemical bond structures [76, 77]. However, aromatics cyclo-alkanes (naphthalene) and other poor in auto-ignition were also found to be 40 % by [78]. Blending was preferred to improve the low pour point of WPPO to improve its cold starting characteristics. Secondly blending improves the fuel spray characteristics. Blending using ethanol, which is soluble and miscible in WPPO blends, also improves physicochemical properties of blends. Thirdly blending helped this experiment to reduce the viscosity of WPPO biodiesel, thus aiding and improving spray characteristics. The blends used in this experiment are broken into five ratios namely: 50/WPPO25/E25, 60/WPPO20/E20, 70/WPPO15/E15, 80/WPPO10/E10 and 90/WPPO5/E5 respectively. For example, to define a blend sample such as 90/WPPO5/E5 is composed of 90 % conventional diesel (CD) fuel by volume 5 % WPPO and 5 % additive 2-Ethyhexyl Nitrate (EHN) respectively for all the replicates.
2.2. Engine Tests
The experiment used a naturally aspirated single-cylinder diesel engine power generator, water cooled, direct injection, Kirloskar TV1, in the Mechanical Engineering Department Laboratory, the University of KwaZulu Natal in Durban, South Africa. The details of the engine and specifications are in Table 1. Figure 1 shows a schematic of the engine test setup.
Table 1: Experimental engine specification
| Parameters | Position value |
| Ignition Type | 4 (Stroke)DICI |
| Number Of Cylinders | 1 |
| Model | TV 1 |
| Cooling Medium | Water |
| Manufacturer | Kirloskar |
| Revolutions Per Minute | 1500 |
| Brake Power | 3.5 kW |
| Cylinder Bore | 87.5 mm |
| Piston Stroke | 110 mm |
| Compression Ratio | 18.5:1 |
| Connecting-Rod Length | 234 |
| Engine Capacity | 661cc |
| Dynamometer Make | 234 |
| Injection Timing | 23.4֯ bTDC |
| Maximum Torque | 28 Nm @1500 |
| Injection Pressure | 250 Bar |
2.3. Physicochemical Property Analysis
The WPPO pyrolysis unit was designed at the University of KwaZulu Natal School of mechanical engineering GPS (29°52’09.9”S 30°58’37.9”E), by the author who is from the Green Energy Group, Howard campus, Durban, South Africa. Lucien engineering Company fabricated the final product in their premises in Durban. The pyrolysis unit comprised of the heating system and its control, the reactor tank, pipes, the heat exchanger and the collector, which all culminate into the pyrolysis unit. The energy requirements for each step is according to the references [79, 80], and the plant’s production chart is shown in Figure 3. Ethanol, conventional diesel and EHN in local outlets and blended using a homogenizer for 5 min at 3000 rpm. Sampling and testing for properties was in the Department of Chemical Engineering Laboratory, at the University of KwaZulu Natal in Durban, South Africa. Table 2 shows some important physicochemical properties of the fuels oils before blending.
Table 2: Properties of Diesel, WPPO, and ethanol before blending and the addition of EHN
| Properties | Unit | CD | WPPO | Ethanol |
| Density @ 20⁰C | kg/M3 | 845 | 825 | 792 |
| Visc.@ 40⁰C | cSt | 3.04 | 2.538 | 1.05 |
| Cetane Number | _ | 55 | _ | 8.5 |
| Flash Point | ⁰ C | 50 | 43 | 16 |
| Fire Point | ⁰ C | 56 | 45 | 53 |
| Carbon residue | % | 22 | 0.015 | _ |
| Sulfur content | % | <0.028 | 0.248 | _ |
| Gross Calories | kJ/kg | 46500 | 43340 | 29700 |
| Cetane index | _ | 46 | 65 | _ |
Table 3: Properties of blended ratio mixtures of diesel, ethanol, WPPO with EHN
| Property | Unit | CD | 90/5/5 | 80/10/10 | 70/15/15 | 60/20/20 | 50/25/25 | STANDARD |
| Density | Kg/M3 | 845 | 838.5 | 834 | 830 | 825 | 823 | ASTM D1298 |
| KViscosity@40 | cST | 3.452 | 2.38 | 2.37 | 2.365 | 2.340 | 2.325 | ASTM D445 |
| Cetane Number | – | 48 | 58 | 60 | 62 | 63 | 65 | ASTM D4737 |
| GCV | kJ/kg | 44840 | 40125 | 39985 | 38700 | 36800 | 34500 | ASTM D4868 |
| Sulfur Content | % | <0.0124 | 0.0248 | 0.0249 | 0.0251 | 0.0253 | 0.0257 | ASTM D4294 |
| Oxygen | % | 12.35 | 11.80 | 10.75 | 10.15 | 10.25 | 10.35 | ASTM D5622 |
| Carbon Residue | % | 74.85 | 75.35 | 76.40 | 77.55 | 78.25 | 79.65 | ASTM D7662 |
| Flashpoint | ⁰C | 56.5 | 38.5 | 37.55 | 37.35 | 37.15 | 36.85 | ASTM D93 |
| Hydrogen | % | 12.38 | 7.5 | 7.55 | 7.65 | 7.75 | 7.95 | ASTM D7171 |
 Figure 2: Assembled view of the pyrolysis unit experimental set-up
Table 3 shows the physicochemical properties of blended mixtures fuels and their determined fuel properties after blending in relation to American Standard of Testing and Measurements (ASTM).
3. Results and Discussion
3.1. Brake Specific Fuel Consumption
Figure 3 is a variation of brake specific fuel consumption (BSFC) with engine load. The BSFC compared to the engine load in Fig. 3 shows that as the load increases there is an equal increase for fuel consumed by the test engine. The values obtained at full engine load for the blends of 90/WPPO5/E5, 80/WPPO10/E10, 70/WPPO15/E15, 60/WPPO20/E20, 50/WPPO25/E25 and CD were 0.04 g/kW.h, 0.041 g/kW.h, 0.042 g/kW.h, 0.043 g/kW.h and 0.035 g/kW.h respectively.
At high engine loads the conversion of heat energy to mechanical energy increases with increase in combustion temperature, leading to increased BSFC for the biodiesel. This increase is proportional to the difference in their heating values which is identical to the findings of [81]. Additionally, WPPO blends have high densities, therefore suffer high mass injection pressure, hence the increase in BSFC which is identical to studies by [82, 83]. These blends of WPPO compare well to conventional diesel fuel and sometimes-other biodiesel blends with comparative differences in the heating values.
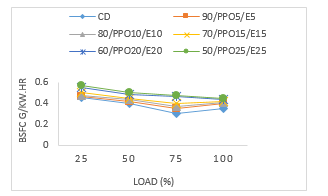 Figure 3: Brake specific fuel consumption versus load
As the blend ratio increased there was a decrease in the BSFC across all the test fuels. However, the values for all WPPO blends increased compared to CD test fuel. This is due to the lower calorific values of the blends as the percentage of the blend ratio increased. In other words, by increasing the ratio of WPPO in the diesel test fuel, the engine fuel consumption increased, this is identical to the studies of [84-86]. The closeness of the values and the packed graph reveal a close resemblance and identical BSFC characteristics of WPPO, ethanol, and EHN compared to CD fuel. For example, at 50 % engine load the blend of 80/WPPO10/E10 had a value of 0.043 g/kW.h compared to full engine load with 0.041 g/kW.h. This value is higher than CD test fuel with 0.04g/kW.h at 50 % engine load and 0.035 g/kW.h at full engine load.
3.2. Brake Thermal Efficiency
The brake thermal efficiency (BTE) variations with engine load is as shown in Figure 4. The graphs show that, as the load increased there was an increase in the BTE across all the test fuel blends of WPPO and CD. The result of this experiment shows that the BTE increased as the load increased, explained by the reduction in the heat loss as the engine power (more fuel) increased with load. At 50 % engine load the values for blends 90/WPPO5/E5, 80/WPPO10/E10, 70/WPPO15/E15, 60/WPPO20/E20, 50/WPPO25/E25 and CD were 22 %, 21 %, 20 %, 18 %, 16.5 % and 22.5 % respectively. As the blend ratio and engine load increased, there was an increase in BTE across the blends of WPPO but with a decrease in the BTE within the blends. For example, at 25 % engine load, 90/WPPO5/E5 had values of 14 %, 22 %, 26.5 % and 25 % compared to 70/WPPO15/E15 with 12.5 %, 20 %, 22.5 % and 23 % respectively.
The highest BTE value was by blend 90/WPPO5/E5 at 25 % engine load compared to any other blend of WPPO. For example, Fig. 4 shows values of 24.8 %, 23 %, 21 % and 19 % respectively for blends 80/WPPO10/E10, 70/WPPO15/E15, 60/WPPO20/E20, 50/WPPO25/E25. However, blend 50/WPPO25/E25 reported the lowest values compared to the other blends. At 25 % engine load the BTE value was 9.5 % compared with 19 % at full load, these two are the lowest values of BTE.
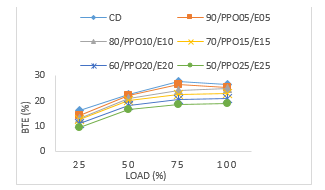 Figure 4: Brake thermal efficiency versus load
3.3. Exhaust Gas Temperature
Figure 5 is a variation of exhaust gas temperature (EGT) and engine load. The graph reveals that as the load increases the value of the EGT increased significantly and linearly especially for the blends. At 25 % engine load the blends 90/WPPO5/E5, 80/WPPO10/E10, 70/WPPO15/E15, 60/WPPO20/E20; 50/WPPO25/E25 reported values of 165 ⁰C, 195 ⁰C, 226 ⁰C and 256 ⁰C compared to CD with 155 ⁰C, 175 ⁰C, 205 ⁰C and 240 ⁰C for all engine load conditions. What explains this increase in engine temperatures is the increase in the required fuel to compensate increased load. However, observed also is temperature increase becomes pronounced with increased blend ratio of WPPO compared to CD test fuel as in Figure 5. The second reason for increased EGT temperature increase is the BTE heat loss factor for high blend ratios compared to CD test fuel.
The experiment also showed another interesting observation, as the engine load increased from 25 % to full load (100 %) the graph curves tend toward unitary, adopting almost identical and similar values to CD test fuel. This concludes that the blends of WPPO, ethanol, and fuel additives have identical temperature characteristics to those of CD test fuel especially as the engine load hits 75 % heading to 100 % (full load). This is due to the presence of ethanol, which decreased ignition delay thus lowering the combustion temperature. The equations are an exception to the prescribed specifications of this template. You will need to determine whether or not your equation should be typed using either the Times New Roman or the Symbol font (please no other font). To create multi-levelled equations, it may be necessary to treat the equation as a graphic and insert it into the text after your paper is styled.
 Figure 5: Exhaust gas temperature versus load
3.4. Carbon Monoxide
Figure 6 is a variation of carbon monoxide (CO) with engine load. The graph reveals that as the engine load and the blend ratio increased CO emissions decreased up to 75 % of engine load. This was for all blends 90/WPPO5/E5, 80/WPPO10/E10, 70/WPPO15/E15, 60/WPPO20/E20, and 50/WPPO25/E25. The highest value in Figure 6 of CO emission reported was 0.0625 % for blend 50/WPPO25/E25 and the lowest value reported was by blend 90/WPPO5/E5 at 0.055 %. Another observation is that as the engine was approaching full load, all the test fuels showed increased CO emissions with blends 90/WPPO5/E5 and 80/WPPO10/E10 reporting the lowest emissions among the test blends across all the engine load conditions.
For example, at 25 % engine load the blends of 90/WPPO5/E5, 80/WPPO10/E10, 70/WPPO15/E15, 60/WPPO20/E20, 50/WPPO25/E25 reported values of 0.055 %, 0.0565 %, 0.06 %, 0.0615 % and 0.0625 %. However, as the load increased for example, from 25 % to 75 % the values reported are 0.035 %, 0.0375 %, 0.0445 % and 0.0.0475 respectively.
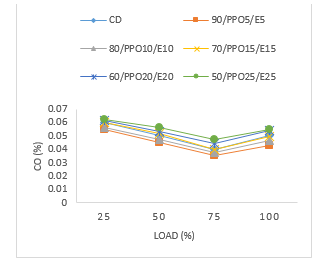 Figure 6: Carbon monoxide versus load
There are a number of factors, which explain the decrease in CO emissions as the engine load is increasing. The decrease can be attributed to increased unburnt or partially burnt hydrocarbons due to incomplete combustion, which is identical to the study by [87]. This phenomenon is linked to the increased load and the presence of ethanol, which shortened ignition delay, hence increasing CO emissions. Additionally, the decrease in CO emissions could also be due to the conversion of CO to CO2 taking up this reaction from the high oxygen content of the fuel additive ethanol.
3.5. Carbon Dioxide
Figure 7 is the variation of carbon dioxide (CO2) with engine load. The graph shows that as the blend ratio and engine load increased CO2 emissions increased but compared to CD their emission levels are still lower and almost identical. At 50 % engine load the values of CD, and the blends of 90/WPPO5/E5, 80/WPPO10/E10, 70/WPPO15/E15, 60/WPPO20/E20, 50/WPPO25/E25 were 3.58 %, 3.35 %, 2.95 %, 2.6 %, 2.55 % and 2.25 % respectively.
 Figure 7: Carbon dioxide versus load
3.6. Oxides of Nitrogen
Figure 8 is a variation of engine load with oxides of nitrogen (NOX) emissions. The graph plot shows that as the engine load was increased there was an increase in the NOX emissions irrespective of fuel, blend ratio or EHN. However, the value of NOX emissions from the blends 90/WPPO5/E5, 80/WPPO10/E10, and 70/WPPO15/E15 reported lower values compared to CD fuel. For example, at 50 % the values of the blends, was 385 ppm, 396 ppm, and 415 ppm, compared to CD fuel at 425 ppm.
 Figure 8: Oxides of nitrogen versus load
Blend 60/WPPO20/E20 and 50/WPPO25/E25 had the highest NOX emissions compared to the other blends of 90/WPPO5/E5, 80/WPPO10/E10, and 70/WPPO15/E15 across all the engine load conditions tested. In Figure 8 at 25 % engine load, the two blends had values of 205 ppm and 200 ppm respectively. However, at full engine load the NOX emissions values increased to 925 ppm and 885 ppm compared to blend 90/WPPO5/E5 at the same load with 197 ppm and at full load at 792 ppm.
From the graph plot in Figure 8, as the blend ratio increased there was a direct increase in emissions of NOX across all the blended test fuels. However, blend 90/WPPO5/E5 reported the lowest values of NOX emissions compared to all the other tested blends experimented. The formation of NOX in biodiesel fuel combustion strongly depends on the combustion temperatures and the oxygen concentration in the combustion zone. The low blend ratios of 70/WPPO15/E15, 60/WPPO20/E20, 50/WPPO25/E25, show a shortened combustion process. Hence, a poor cooling effect and failure to decrease peak combustion temperatures leading to increased NOX.
These findings show a correlation between the alcohol content in the fuel and peak flame temperatures, the content of nitrogen, and oxygen availability. this study findings are identical to the findings of [88]. The increased NOX emissions are a result of the presence of nitrogen from the CN improver ENH and other contaminants from the WPPO impurities. Additionally, it could be due to the generation of radicals of hydrocarbon through molecular unsaturation in the blends being identical to the findings of [89, 90]. The final factor is due to increased EGT temperatures, linked to the high oxygen content and the air fuel ratio.
3.7. Unburnt Hydrocarbons
Figure 9 is a variation of unburnt hydrocarbons (UHC) emission with engine load. As the engine load was increased, the UHC emissions increased too. The higher hydrocarbon emissions may be due to hydrogen radicals in the diesel-ethanol-WPPO-EHN blends. The high fraction of ethanol in blends 70/WPPO15/E15, 60/WPPO20/E20, 50/WPPO25/E25 contributes to increase in the emissions of UHC which is identical to the findings of [62, 91]. Who observed it in an SI engine cylinder walls, crevices, and quenched cylinder walls with richer air-alcohol mixtures.
However, the increase is more significant as the engine load was in intermediate loads of 75 % moving to or approaching full load. For example, at 50 % engine load, the values of blends were 22 ppm, 21 ppm, 20 ppm, 18 ppm, and 15 ppm respectively compared to full load with 35 ppm, 34 ppm, 32 ppm, 29 ppm, and 26 ppm (for blends 90/WPPO5/E5, 80/WPPO10/E10, 70/WPPO15/E15, 60/WPPO20/E20, and 50/WPPO25/E25). This leads to the conclusion that at high engine loads the values of UHC emissions are significantly high for all the blends of WPPO, ethanol and EHN, although comparatively low compared to CD fuel.
The UHC emissions from the blends 90/WPPO5/E5 and 80/WPPO10/E10 report higher values. Although, the graph plot in Figure 9 shows low values compared to the values of CD test fuel. However, the general trend by the graph in Figure 9 shows that increased blend ratio significantly reduced UHC emissions, across all the test fuels irrespective of the engine load condition. This reduction is due to the high oxygen content of ethanol and the effect of the fuel additive EHN, factors that helped in complete combustion.
 Figure 9: Unburnt hydrocarbons versus load
4. Conclusion
- The variation of BSFC with engine load shows that, as the load increases there is an increase in the fuel consumed by the test engine as in the graph as shown in Fig.1. However, the lower blend ratios 90/WPPO5/E5 and 80/WPPO10/E10 exhibit identical BSFC values to conventional diesel test fuel compared to the other blends. These blends show the lowest BSFC values compared to the other WPPO blends.
- The BTE of blend 90/WPPO5/E5 report values close to the values of conventional diesel fuel values. This is due to the close blend density values and the gross calorific values of WPPO blends, which showed very small and marginal differences. This is the case condition at lower blend ratios for WPPO blends tested.
- There is a reduction of UHC emissions with the use of WPPO blends, ethanol and EHN, with a notable reduction in NOX emissions, especially for the blend 90/WPPO5/E. This is a clear indication that this blend performed well when compared to petroleum conventional diesel.
- Although there is an indicated increase in the emissions of CO, CO2 NOX and UHC, for all the blends of WPPO, ethanol, and EHN. There is a clear indication in the graph plots discussed that blended fuels have low emission levels compared to conventional petroleum diesel in relation to the ASTM standards during experimentation.
- During experimentation, the blends of WPPO, ethanol, and EHN report identical temperature characteristics to CD test fuel as the engine load hits 75 % heading to 100 % (full load). This is due to the presence of ethanol responsible for decreased ignition delay.
Conflict of Interest
The authors declare no conflict of interest.
Acknowledgment
The writer would lie to thank the Green Energy Group for their equipment and material support in terms of logistics and transport during the course of the study
- A. Fayyazbakhsh, V. Pirouzfar, “Investigating the influence of additives-fuel on diesel engine performance and emissions: Analytical modeling and experimental validation” Fuel, 171, 167–177, 2016. https://doi.org/10.1016/j.fuel.2015.12.028
- A. Fayyazbakhsh, V. Pirouzfar, “Determining the optimum conditions for modified diesel fuel combustion considering its emission, properties and engine performance” Energy Convers. Manage., 113, 209–219, 2016. https://doi.org/10.1016/j.enconman.2016.01.058
- S. Khorramshokouh, V. Pirouzfar, Y. Kazerouni, A. Fayyazbakhsh, R. Abedini, “Improving the properties and engine performance of diesel–methanol–nanoparticle blend fuels via optimization of the emissions and engine performance” Energy Fuels, 30(10), 8200–8208, 2016. https://doi.org/10.1021/acs.energyfuels.6b01856
- V. Pirouzfar, A. Fayyazbakhsh, Diesel Fuel Additives, LAP LAMBERT Academic Publishing, Riga, Latvia, 2016.
- A. K. Agarwal, “Biofuels (alcohols and biodiesel) applications as fuels for internal combustion engines” Prog. Energy Combust. Sci., 33(3), 233–271, 2007. https://doi.org/10.1016/j.pecs.2006.08.003
- C. L. Song, Y. C. Zhou, R. J. Huang, Y. Q. Wang, Q. F. Huang, G. Lü, K. M. Liu, “Influence of ethanol–diesel blended fuels on diesel exhaust emissions and mutagenic and genotoxic activities of particulate extracts” J. Hazard. Mater., 149(2), 355–363, 2007. https://doi.org/10.1016/j.jhazmat.2007.03.088
- J. C. Escobar, E. S. Lora, O. J. Venturini, E. E. Yáñez, E. F. Castillo, O. Almazan, “Biofuels: environment, technology and food security” Renewable Sustainable Energy Rev., 13(6-7), 1275–1287, 2009. https://doi.org/10.1016/j.rser.2008.08.014
- S. Maroa, F. Inambao, “The formation, effects and control of oxides of nitrogen in diesel engines” Int. J. Eng. Res., 13(6), 3200–3209, 2018.
- S. Maroa, F. Inambao, “Transportation, pollution and the environment” Int. J. Eng. Res., 13(6), 3187–3199, 2018.
- J. B. Heywood, Internal Combustion Engine Fundamentals, McGraw-Hill Education, New Delhi, 2012.
- A. M. Taylor, “Science review of internal combustion engines” Energy Policy, 36(12), 4657–4667, 2008. https://doi.org/10.1016/j.enpol.2008.09.001
- M. Fu, Y. Ge, J. Tan, T. Zeng, B. Liang, “Characteristics of typical non-road machinery emissions in China by using portable emission measurement system” Sci. Total Environ., 437, 255–261, 2012. https://doi.org/10.1016/j.scitotenv.2012.07.095
- Y. Zhang, X. Wang, G. Li, W. Yang, Z. Huang, Z. Zhang, X. Huang, D. Wei, T. Liu, Z. Huang, et al., “Emission factors of fine particles, carbonaceous aerosols and traces gases from road vehicles: recent tests in an urban tunnel in the Pearl River Delta, China” Atmos. Environ., 122, 876–884, 2015. https://doi.org/10.1016/j.atmosenv.2015.08.024
- L. Benbrahim-Tallaa, R. A. Baan, Y. Grosse, B. Lauby-Secretan, F. El Ghissassi, V. Bouvard, N. Guha, D. Loomis, K. Straif, “Carcinogenicity of diesel-engine and gasoline-engine exhausts and some nitroarenes” Lancet Oncol., 13(7), 663–664, 2012. https://doi.org/10.1016/S1470-2045(12)70280-2
- L. V. Giles, C. Carlsten, M. S. Koehle, “The effect of pre-exercise diesel exhaust exposure on cycling performance and cardio-respiratory variables” Inhal. Toxicol., 24(12), 783–789, 2012. DOI: 10.3109/08958378.2012.717649
- W. B. Innes, “Effect of nitrogen oxide emissions on ozone levels in metropolitan regions” Environ. Sci. Technol., 15(8), 904–912, 1981. https://doi.org/10.1021/es00090a003
- R. E. Hester, R. M. Harrison (eds), Air Quality in Urban Environments. Royal Society of Chemistry, 2009. https://doi.org/10.1039/9781847559654
- A. Mills, S. Elouali, “The nitric oxide ISO photocatalytic reactor system: measurement of NOx removal activity and capacity” J. Photochem. Photobiol., A, 305, 29–36, 2015. https://doi.org/10.1016/j.jphotochem.2015.03.002
- J. Ou, Z. Yuan, J. Zheng, Z. Huang, M. Shao, Z. Li, X. Huang, H. Guo, P. K. K. Louie, “Ambient ozone control in a photochemically active region: short-term despiking or long-term attainment?” Environ. Sci. Technol., 50(11), 5720–5728, 2016. https://doi.org/10.1021/acs.est.6b00345
- D. Damodharan, A. P. Sathiyagnanam, B. Rajesh Kumar, K. C. Ganesh, “Cleaner emissions from a DI diesel engine fueled with waste plastic oil derived from municipal solid waste under the influence of n-pentanol addition, cold EGR, and injection timing” Environ. Sci. Pollut. Res., 25(14), 13611–13625, 2018. https://doi.org/10.1007/s11356-018-1558-5
- B. R. Kumar, S. Saravanan, “Use of higher alcohol biofuels in diesel engines: A review” Renewable Sustainable Energy Rev., 60, 84–115, 2016. https://doi.org/10.1016/j.rser.2016.01.085
- E. Koivisto, N. Ladommatos, M. Gold, “Systematic study of the effect of the hydroxyl functional group in alcohol molecules on compression ignition and exhaust gas emissions” Fuel, 153, 650–663, 2015. https://doi.org/10.1016/j.fuel.2015.03.042
- M. Lapuerta, R. García-Contreras, J. Campos-Fernández, M. Pilar Dorado, “Stability, lubricity, viscosity, and cold-flow properties of alcohol-diesel blends” Energy Fuels, 24(8), 4497–4502, 2010. https://doi.org/10.1021/ef100498u
- Y. Ren, Z. Huang, H. Miao. Y. Di, D. Jiang, K. Zeng, B. Liu, X. Wang, “Combustion and emissions of a DI diesel engine fueled with diesel-oxygenate blends” Fuel, 87(12), 2691–2697, 2008. https://doi.org/10.1016/j.fuel.2008.02.017
- S.M. Gaida, A. Liedtke, A. H. W. Jentges, B. Engels, S. Jennewein, “Metabolic engineering of Clostridium cellulolyticum for the production of n-butanol from crystalline cellulose” Microbial Cell Factories, 15(1), 6, 2016. https://doi.org/10.1186/s12934-015-0406-2
- S. H. Desai, C. A. Rabinovitch-Deere, Z. Fan, S. Atsumi, “Isobutanol production from cellobionic acid in Escherichia coli” Microbial Cell Factories, 14(1), 52, 2015. https://doi.org/10.1186/s12934-015-0232-6
- C. Formighieri, Solar-to-Fuel Conversion in Algae and Cyanobacteria, Springer, 2015, 31–38.
- E. Ofuonye, K. Kutin, D. T. Stuart, “Engineering Saccharomyces cerevisiae fermentative pathways for the production of isobutanol” Biofuels, 4(2), 185–201, 2013. https://doi.org/10.4155/bfs.12.85
- S. Fernando, M. Hanna, “Development of a novel biofuel blend using ethanol-biodiesel-diesel microemulsions: EB-diesel” Energy Fuels, 18(6), 1695–1703, 2004. DOI:10.1021/ef049865e
- P. Kwanchareon, A. Luengnaruemitchai, S. Jai-In, “Solubility of a diesel–biodiesel–ethanol blend, its fuel properties, and its emission characteristics from diesel engine” Fuel, 86(7-8), 1053–1061, 2007. https://doi.org/10.1016/j.fuel.2006.09.034
- M. Lapuerta, O. Armas, R. Garcia-Contreras, “Stability of diesel–bioethanol blends for use in diesel engines” Fuel, 86(10-11), 1351–1357, 2007. https://doi.org/10.1016/j.fuel.2006.11.042
- M. Lapuerta, O. Armas, J. Rodriguez-Fernandez, “Effect of biodiesel fuels on diesel engine emissions” Prog. Energy Combust. Sci., 34(2), 198–223, 2008. https://doi.org/10.1016/j.pecs.2007.07.001
- D.-G. Li, H. Zhen, L. Xingcai, Z. Wu-Gao, Y. Jian-Guang, “Physico-chemical properties of ethanol–diesel blend fuel and its effect on performance and emissions of diesel engines” Renewable Energy, 30(6), 967–976, 2005. https://doi.org/10.1016/j.renene.2004.07.010
- S. Shahir, H. H. Masjuki, M. A. Kalam, A. Imran, A. M. Ashraful, “Performance and emission assessment of diesel–biodiesel–ethanol/bioethanol blend as a fuel in diesel engines: A review” Renewable Sustainable Energy Rev., 48, 62–78, 2015. https://doi.org/10.1016/j.rser.2015.03.049
- K. Zhang, M. R. Sawaya, D. S. Eisenberg, J. C. Liao, “Expanding metabolism for biosynthesis of nonnatural alcohols” Proc. Natl. Acad. Sci. 105(52), 20653–20658, 2008. https://doi.org/10.1073/pnas.0807157106
- A. F. Cann, J. C. Liao, “Pentanol isomer synthesis in engineered microorganisms” Appl. Microbiol. Biotechnol. 85(4), 893–899, 2010. doi: 10.1007/s00253-009-2262-7.
- Y. Dekishima, E. I. Lan, C. R. Shen, K. M. Cho, J. C. Liao, “Extending carbon chain length of 1-butanol pathway for 1-hexanol synthesis from glucose by engineered Escherichia coli” J. Am. Chem. Soc., 133(30), 11399–11401, 2011. DOI: 10.1021/ja203814d
- J. Campos-Fernández, J. M. Arnal, J. Gómez, M. Pilar Doradoa, “A comparison of performance of higher alcohols/diesel fuel blends in a diesel engine” Appl. Energy, 95, 267–275, 2012. https://doi.org/10.1016/j.apenergy.2012.02.051
- Z. Chen, J. Liu, Z. Han, B. Du, Y. Liu, C. Lee, “Study on performance and emissions of a passenger-car diesel engine fueled with butanol-diesel blends” Energy, 55, 638–646, 2013. https://doi.org/10.1016/j.energy.2013.03.054
- Z. Chen, J. Liu, Z. Wu, C. Lee, “Effects of port fuel injection (PFI) of n-butanol and EGR on combustion and emissions of a direct injection diesel engine” Energy Convers. Manage., 76, 725–731, 2013. https://doi.org/10.1016/j.enconman.2013.08.030
- J. Devaraj, Y. Robinson, P. Ganapathi, “Experimental investigation of performance, emission and combustion characteristics of waste plastic pyrolysis oil blended with diethyl ether used as fuel for diesel engine” Energy, 85, 304–309, 2015. https://doi.org/10.1016/j.energy.2015.03.075
- C. Jin, M. Yao, H. Liu, C. F. Lee, J. Ji, “Progress in the production and application of n-butanol as a biofuel” Renewable Sustainable Energy Rev., 15(8), 4080–4106, 2011. https://doi.org/10.1016/j.rser.2011.06.001
- B. R. Kumar, S. Saravanan, “Effects of iso-butanol/diesel and n-pentanol/diesel blends on performance and emissions of a DI diesel engine under premixed LTC (low temperature combustion) mode” Fuel, 170, 49–59, 2016. DOI: 10.1016/j.fuel.2015.12.029
- S. Kumar, R. Prakash, S. Murugan, R. K. Singh, “Performance and emission analysis of blends of waste plastic oil obtained by catalytic pyrolysis of waste HDPE with diesel in a CI engine” Energy Convers. Manage., 74, 323–331, 2013. https://doi.org/10.1016/j.enconman.2013.05.028
- M. Mani, G. Nagarajan, S. Sampath, “Characterization and effect of using waste plastic oil and diesel fuel blends in compression ignition engine” Fuel Energy Abstracts, 36(1), 212–219, 2011. https://doi.org/10.1016/j.energy.2010.10.049
- S. H. Park, J. Cha, H. J. Kim, C. S. Lee, “Effect of early injection strategy on spray atomization and emission reduction characteristics in bioethanol blended diesel fueled engine” Energy, 39(1), 375–387, 2012. https://doi.org/10.1016/j.energy.2011.12.050
- C. D. Rakopoulos, A. M. Dimaratos, E. G. Giakoumis, D. C. Rakopoulos, “Investigating the emissions during acceleration of a turbocharged diesel engine operating with bio-diesel or n-butanol diesel fuel blends” Energy, 35(12), 5173–5184, 2010. https://doi.org/10.1016/j.energy.2010.07.049
- S. Saravanan, “Effect of exhaust gas recirculation (EGR) on performance and emissions of a constant speed DI diesel engine fueled with pentanol/diesel blends” Fuel, 160, 217–226, 2015. https://doi.org/10.1016/j.fuel.2015.07.089
- V. Soloiu, M. Duggan, S. Harp, B. Vlcek, D. Williams, “PFI (port fuel injection) of n-butanol and direct injection of biodiesel to attain LTC (low-temperature combustion) for low-emissions idling in a compression engine” Energy, 52, 143–154, 2013. https://doi.org/10.1016/j.energy.2013.01.023
- X. Wang, C. S.Cheung, Y. Di, Z. Huang, “Diesel engine gaseous and particle emissions fueled with diesel-oxygenate blends” Fuel, 94, 317–323, 2012. https://doi.org/10.1016/j.fuel.2011.09.016
- L. Wei, C. Cheung, Z. Huang, “Effect of n-pentanol addition on the combustion, performance and emission characteristics of a direct-injection diesel engine” Energy, 70, 172–180, 2014. https://doi.org/10.1016/j.energy.2014.03.106
- L. Zhu, C. S. Cheung, W. G. Zhang, Z. Huang, “Combustion, performance and emission characteristics of a DI diesel engine fueled with ethanol–biodiesel blends” Fuel, 90(5), 1743–1750, 2011. https://doi.org/10.1016/j.fuel.2011.01.024
- Q. Zhang, M. Yao, Z. Zheng, H. Liu, J. Xu, “Experimental study of n-butanol addition on performance and emissions with diesel low temperature combustion” Energy, 47(1), 515–521, 2012. https://doi.org/10.1016/j.energy.2012.09.020
- S. Xiaoyan, Y. Yunbo, H. Hong, S. Shijin, D. Hongyi, L. Rulong, “Combination of biodiesel-ethanol-diesel fuel blend and SCR catalyst assembly to reduce emissions from a heavy-duty diesel engine” J. Environ. Sci., 20(2), 177–182, 2008. https://doi.org/10.1016/S1001-0742(08)60028-5
- F. Aydın, H. Öğüt, “Effects of using ethanol-biodiesel-diesel fuel in single cylinder diesel engine to engine performance and emissions” Renewable Energy, 103, 688–694, 2017. https://doi.org/10.1016/j.renene.2016.10.083
- K. Lawyer, A. Ickes, T. Wallner, D. Ertl, R. Williamson, S. Miers, J. Naber, “Blend Ratio Optimization of Fuels Containing Gasoline Blendstock, Ethanol, and Higher Alcohols (C3-C6): Part I-Methodology and Scenario Definition” 2013, SAE Technical Paper 2013-01-1144. https://doi.org/10.4271/2013-01-1144
- Ö. Can, I. Celikten, N. Usta, “Effects of ethanol addition on performance and emissions of a turbocharged indirect injection diesel engine running at different injection pressures” Energy Convers. Manage., 45(15–16), 2429-2440, 2004. https://doi.org/10.1016/j.enconman.2003.11.024
- C. Chacartegui, J. Lopez, F. Alfonso, P. Aakko, C. Hamelinck, G. Vossen, H. Kattenwinkel, “Blending ethanol in diesel” Final report for Lot 3b of the Biodiesel Improvement on Standards. Coordination of Producers and Ethanol Studies (Bioscopes) project, 2007.
- A. C. Hansen, Q. Zhang, P. W. Lyne, “Ethanol-diesel fuel blends––a review”, Bioresour. Technol., 96(3), 277–285, 2005. https://doi.org/10.1016/j.biortech.2004.04.007
- H. Kim, B. Choi, “Effect of ethanol–diesel blend fuels on emission and particle size distribution in a common-rail direct injection diesel engine with warm-up catalytic converter” Renewable Energy, 33(10), 2222–2228, 2008. https://doi.org/10.1016/j.renene.2008.01.002
- H. Kuszewski, A. Jaworski, A. Ustrzycki, “Lubricity of ethanol–diesel blends–Study with the HFRR method” Fuel, 208, 491–498, 2017. https://doi.org/10.1016/j.fuel.2017.07.046
- W. Tutak, K. Lukács, S. Szwaja, Á. Bereczky, “Alcohol-diesel fuel combustion in the compression ignition engine” Fuel, 154, 196–206, 2015. https://doi.org/10.1016/j.fuel.2015.03.071
- N. Yilmaz, F. M. Vigil, A. B. Donaldson, T. Darabseh, “Investigation of CI engine emissions in biodiesel-ethanol-diesel blends as a function of ethanol concentration” Fuel, 115, 790–793, 2014. https://doi.org/10.1016/j.fuel.2013.08.012
- S. Moon, T. Tsujimura, M. Oguma, Z. Chen, Z. Huang, T. Saitou, “Mixture condition, combustion and sooting characteristics of ethanol-diesel blends in diffusion flames under various injection and ambient conditions” Fuel, 113, 128–139, 2013. https://doi.org/10.1016/j.fuel.2013.05.060
- K. Baczewski, P. Szczawiński, M. Kamińska, “Experimental testing of influence of commercial depressants on diesel fuels low temperature properties” J. KONES, 22(1), 7–14, 2015. DOI: 10.5604/12314005.1161595
- J. Yanowitz, M. A. Ratcliff, R. L. McCormick, J. D. Taylor, M. J. Murphy, “Compendium of Experimental Cetane Numbers” (Technichal Report No. NREL/TP-5400-67585) National Renewable Energy Laboratory, Golden, CO, 2017.
- M. E. Tat, “Cetane number effect on the energetic and exergetic efficiency of a diesel engine fuelled with biodiesel” Fuel Process. Technol., 92(7), 1311–1321, 2011. https://doi.org/10.1016/j.fuproc.2011.02.006
- K. Takahashi, M. Sekimoto, H. Watanabe, T. Saito, R. Aoki, Y. Sakurai, T. Furuse, T. Sakuraba, T. Kezuka, Imai, S,. “Effects of cetane number and chemical components on diesel emissions and vehicle performance” Proceedings 20th World Petroleum Congress, Doha, Qatar, 2011. https://doi.org/10.4271/2009-01-2692
- J. P. Szybist, B. G. Bunting, “Cetane number and engine speed effects on diesel HCCI performance and emissions” SAE Technical Paper 2005-01-3723, 1334–1346, 2005. https://doi.org/10.4271/2005-01-3723
- J. Reijnders, M. Boot, P. de Goey, “Impact of aromaticity and cetane number on the soot-NOx trade-off in conventional and low temperature combustion” Fuel, 186, p. 24–34, 2016. https://doi.org/10.1016/j.fuel.2016.08.009
- E. Kurtz, C. J. Polonowski, “The influence of fuel cetane number on catalyst light-off operation in a modern diesel engine” SAE Int. J. Fuels Lubr. 10(3), 664–671, 2017. https://doi.org/10.4271/2017-01-9378.
- M. T. Chaichan, S. T. Ahmed, “Effect of fuel cetane number on multi-cylinders direct injection diesel engine performance and exhaust emissions” Al-Khwarizmi Eng. J., 8(1), 65–75, 2012.
- R. Cataluña, R. Da Silva, “Effect of cetane number on specific fuel consumption and particulate matter and unburned hydrocarbon emissions from diesel engines” J. Combust., 2012. http://dx.doi.org/10.1155/2012/738940
- O. C. Chukwuezie, N. R. Nwakuba, S. N. Asoegwu, K. N. Nwaigwe, “Cetane number effect on engine performance and gas emission: a review” American J. Eng. Res., 6(1), 56–67, 2017.
- S. M. Fakhr Hoseini, M. Dastanian, “Predicting pyrolysis products of PE, PP, and PET using NRTL activity coefficient model” J. Chem., 2013. http://dx.doi.org/10.1155/2013/487676
- API, HPV Testing Group Kerosene/jet fuel category assessment document. Submitted to the US EPA, by The American Petroleum Institute, Consortium Registration, 2010. 1100997.
- R. A. Harley, A. J. Kean, “Chemical Composition of Vehicle-Related Volatile Organic Compound Emissions in Central California Final Report (Contract 00-14CCOS) Prepared for: San Joaquin Valleywide Air Pollution Study Agency and California Air Resources Board, 2004.
- P. Ghosh, K. J. Hickey, S. B. Jaffe, “Development of a detailed gasoline composition-based octane model” Ind. Eng. Chem. Res., 45(1), 337–345, 2006. https://doi.org/10.1021/ie050811h
- P. Basu, Economic Issues of Biomass Energy Conversion, Springer, 2013 25–43. https://doi.org/10.1016/C2011-0-07564-6
- D. R. Nhuchhen, P. Basu, B. Acharya, “A comprehensive review on biomass torrefaction” Int. J. Renewable Energy Biofuels, 2014, 1–56, 2014. http://doi.org/10.5171/2014.506376
- M. Lapuerta, O. Armas, J. J. Hernández, “Potential for reducing emissions in a diesel engine by fuelling with conventional biodiesel and Fischer–Tropsch diesel” Fuel, 89(10), 3106–3113, 2010. https://doi.org/10.1016/j.fuel.2010.05.013
- G. Tüccar, E. Tosun, T. Özgür, K. Aydın, “Diesel engine emissions and performance from blends of citrus sinensis biodiesel and diesel fuel” Fuel, 132, 7–11, 2014. https://doi.org/10.1016/j.fuel.2014.04.065
- H. Raheman, S. V. Ghadge, “Performance of compression ignition engine with mahua (Madhuca indica) biodiesel” Fuel, 86(16), 2568–2573, 2007. https://doi.org/10.1016/j.fuel.2007.02.019
- O. Armas, K. Yehliu, A. L. Boehman, “Effect of alternative fuels on exhaust emissions during diesel engine operation with matched combustion phasing” Fuel, 89(2), 438–456, 2010. https://doi.org/10.1016/j.fuel.2009.09.022
- S. Godiganur, C. S. Murthy, R. P. Reddy, “Performance and emission characteristics of a Kirloskar HA394 diesel engine operated on fish oil methyl esters” Renewable Energy, 35(2), 355–359, 2010. https://doi.org/10.1016/j.renene.2009.07.007
- L. Zhu, W. Zhang, W. Liu, Z. Huang, “Experimental study on particulate and NOx emissions of a diesel engine fueled with ultra-low sulfur diesel, RME-diesel blends and PME-diesel blends” Sci. Total Environ., 408(5), 1050-1058, 2010. doi: 10.1016/j.scitotenv.2009.10.056.
- M.M. Rahman, M. Hj. Hassan, Md. A. Kalam, A. E. Atabani, L. A. Memon, S. M. Ashrafur Rahman, “Performance and emission analysis of Jatropha curcas and Moringa oleifera methyl ester fuel blends in a multi-cylinder diesel engine” J. Cleaner Prod., 65, 304–310, 2014. https://doi.org/10.1016/j.jclepro.2013.08.034
- J. B. Heywood, Internal Combustion Engine Fundamentals, McGraw-Hill, New York, 1988.
- P. Benjumea, J. R. Agudelo, A. F. Agudelo, “Effect of the degree of unsaturation of biodiesel fuels on engine performance, combustion characteristics, and emissions” Energy Fuels, 25(1), 77–85, 2010. https://doi.org/10.1021/ef101096x
- Ş. Altun, “Effect of the degree of unsaturation of biodiesel fuels on the exhaust emissions of a diesel power generator” Fuel, 117, 450–457, 2014. https://doi.org/10.1016/j.fuel.2013.09.028
- F. Lujaji, L. Kristóf, A. Bereczky, M. Mbarawa, “Experimental investigation of fuel properties, engine performance, combustion and emissions of blends containing croton oil, butanol, and diesel on a CI engine” Fuel, 90(2), 505–510, 2011. https://doi.org/10.1016/j.fuel.2010.10.004